
INTRODUCTION
Nasopharyngeal carcinoma (NPC) is a type of head and neck neoplasm typically associated with cervical lymphadenopathy, epistaxis, and rhinocleisis, that shows high incidence in South China and East Asia. Although the exact cause of NPC is in most cases unclear, environmental factors, certain dietary factors, and Epstein-Barr virus (EBV) infection are known to be closely related with its development. In addition, it is believed that genetic factors are important determinants of NPC risk [1-3].
A single nucleotide polymorphism (SNP) is a third-generation genetic marker, after first-generation restriction fragment length polymorphism and second-generation simple sequence length (microsatellite) polymorphism. A SNP is a polymorphism in a gene’s sequence caused by a variation in a single nucleotide. Research on SNPs focus mainly on their impact on three classes of genes: tumor suppressor genes, metabolic enzymes genes, and DNA repair genes, and is an important new approach to understand disease susceptibility and pathogenesis, and to guide diagnosis and individual treatment choice.
SNPs are usually detected by polymerase chain reaction (PCR), which is a technology with low speed and efficiency. The introduction of next-generation sequencing technology (NGS), however, made it possible the detection of SNPs with high-throughput. NGS, used to sequence hundreds of thousands to millions of genetic molecules in parallel, is a second-generation sequencing technology developed after first generation (Sanger) sequencing. NGS is much more convenient than the traditional genetic testing technologies [4, 5]. At present, NGS is mainly used in the analysis of whole-genome gene expression profiles, tumor genome re-sequencing, whole-genome small molecule RNA analysis, whole-genome methylation analysis, and chromosome structure analysis, among others [6-10].
Although many studies have focused on the detection of tumor SNPs by NGS, for example in colorectal cancer, renal cell carcinoma, ovarian cancer, etc. [11-13], there are no reports, to our knowledge, evaluating the association of SNPs with NPC susceptibility using NGS. Therefore, we conducted both a meta-analysis of the association of SNPs with NPC risk in East Asian populations, as well as a case-control study to assess the expression of the identified SNPs using NGS. Our aim was to obtain concise, reliable data on the association of SNPs with NPC susceptibility, as to provide a theoretical basis for NPC screening and help guide early prevention efforts in high-risk populations. In addition, we hope our findings will provide new strategies and ideas to improve the diagnosis and treatment of NPC.
RESULTS
Meta-analysis
3754 relevant articles were initially retrieved, and 1821 articles remained after eliminating duplicates. After screening the titles and abstracts according to the inclusion criteria, 184 articles were selected. Data from 97 articles were entered after full-text review. From these, we found a relationship between 279 polymorphic loci in 126 genes and susceptibility to NPC.
After eliminating polymorphic loci represented in less than two articles, 15 SNPs were found to be significantly associated with the risk of NPC: TP53 (rs1042522, C>G) [14-18], GSTM1 (+/DEL) [19-21], IL-10 (rs1800896, A>G) [22, 23], GABBR1 (rs2076483, T>C; rs29232, G>A) [24, 25], MDM2 (rs2279744, T>G) [16, 26], miR-146a (rs2910164, C>G) [27, 28], MDS1-EVI1 (rs6774494, G>A) [29, 30], XPC (rs2228000, C>T) [30, 31],, HCG9 (rs3869062, A>G; rs16896923, T>C) [24, 25], HLA-F (rs3129055, T>C) [24, 25], MMP2 (rs243865, C>T) [32, 33], SPLUNC1 (rs2752903, T>C; rs750064, A>G) [34, 35]. Among these, two SNPs (in the TP53 and GSTM1 genes) were addressed in more than two relevant articles, while each of the others were mentioned in two studies. Among the 15 SNPs identified, those located on miR-146a (rs2910164, C>G), HCG9 (rs3869062, A>G), HCG9 (rs16896923, T>C), MMP2 (rs243865, C>T), GABBR1 (rs2076483, T>C), and TP53 (rs1042522, C>G) were associated with decreased susceptibility to NPC, while the remaining SNPs were associated with an increased risk. The specific features of the 15 SNPs are shown in Table 1. The predominant characteristics and the quality scores of the eligible studies are shown in Supplementary Tables 15.
Table 1: Features of the 15 SNPs significantly associated with NPC
Gene |
rs |
Allele |
Sample |
Model |
Summary OR (95% CI) |
Studies n. |
|---|---|---|---|---|---|---|
TP53 |
rs1042522 |
G |
1419/1707 |
Fixed-effects |
0.812(0.734, 0.897) |
5 |
GSTM1 |
—— |
NULL |
837/1299 |
Fixed-effects |
1.323(1.119, 1.565) |
3 |
IL-10 |
rs1800896 |
G |
374/732 |
Fixed-effects |
2.102(1.64,2.694) |
2 |
GABBR1 |
rs2076483 |
C |
1498/2446 |
Fixed-effects |
0.6(0.535,0.674) |
2 |
MDM2 |
rs2279744 |
G |
1325/1475 |
Random-effects |
1.461(1.091,1.957) |
2 |
miR-146a |
rs2910164 |
G |
389/3976 |
Fixed-effects |
0.714(0.603,0.847) |
2 |
MDS1-EVI1 |
rs6774494 |
A |
6267/6129 |
Fixed-effects |
1.179(1.107,1.255) |
2 |
XPC |
rs2228000 |
T |
1330/1340 |
Fixed-effects |
1.196(1.1072,1.335) |
2 |
GABBR1 |
rs29232 |
A |
1498/2442 |
Fixed-effects |
1.708(1.556, 1.875) |
2 |
HCG9 |
rs3869062 |
G |
1484/2432 |
Fixed-effects |
0.566(0.508, 0.631) |
2 |
HLA-F |
rs3129055 |
C |
1500/2445 |
Fixed-effects |
1.152(1.373, 1.665) |
2 |
HCG9 |
rs16896923 |
C |
1494/2439 |
Fixed-effects |
0.575(0.509, 0.649) |
2 |
MMP2 |
rs243865 |
T |
1173/1149 |
Fixed-effects |
0.632(0.492,0.811) |
2 |
SPLUNC1 |
rs2752903 |
C |
684/768 |
Fixed-effects |
1.764(1.408,2.21) |
2 |
SPLUNC1 |
rs750064 |
G |
313/429 |
Fixed-effects |
1.462(1.184,1.804) |
2 |
Case-control study
Peripheral venous blood samples from 40 NPC patients and 40 healthy volunteers in South China were collected. There were 33 men and 7 women in the case group (Group A), in which the age distribution (mean ± standard deviation) was 46.05 ± 13.77 years. There were 15 men and 25 women in the control group (Group B), with an age distribution (mean ± standard deviation) of 36.13 ± 10.20 years. The results of the DNA and target fragments’ quality testing are shown in Figure 1. A single, clear main band and few number of side band indicated that the quality of the extracted DNA and the amplified target fragments was high.
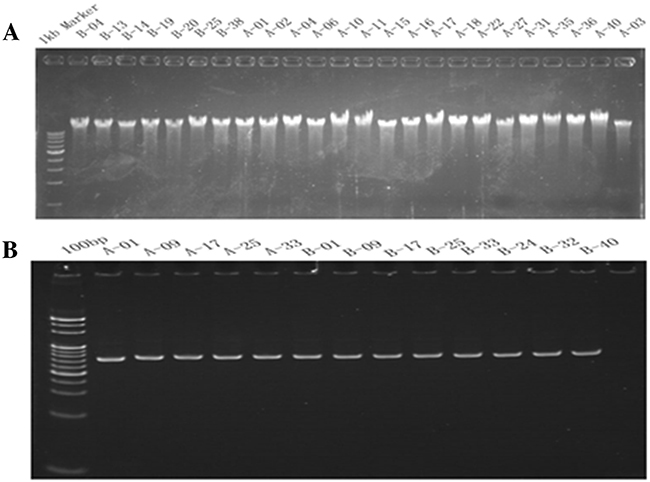
Figure 1: Gene quality testing electrophoretogram. (A) DNA agarose gel electrophoresis detection; (B) Target fragments detection by PAGE gel electrophoresis.
Partial data of automatic sequence, base recognition and data processing by the P-STAR high-throughput instrument are shown in Figure 2. The 15 SNP loci genotypes of all 80 samples could be obtained through automatic analysis with the PSTAR sequencer.
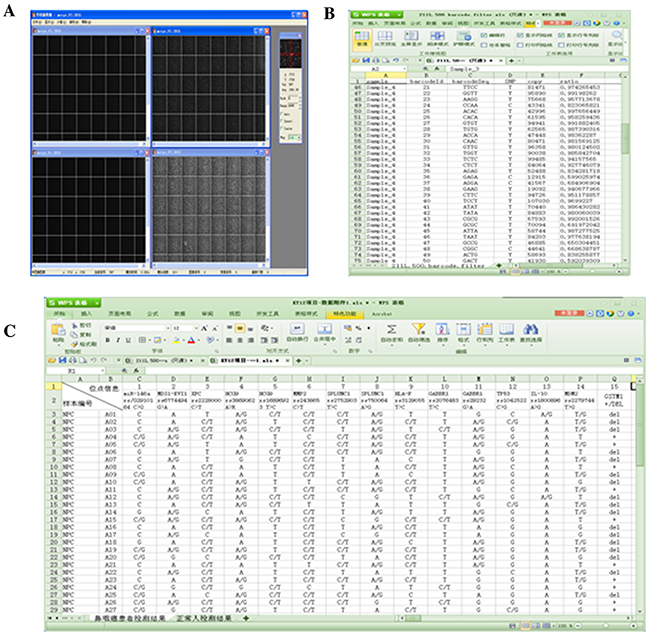
Figure 2: Automatic detection and analysis with the PSTAR high-throughput instrument. (A) High-throughput sequence image, base recognition and data processing; (B) High-throughput sequencing results file generation; (C) High-throughput sequencing results statistics.
The specific gene distribution of the 15 SNPs in the case group (Group A) and the control group (Group B) is shown in Table 2 and Table 3. SNP-15 (GSTM1) could not be subjected to Hardy-Weinberg equilibrium (HWE) test because it has only two genotypes. Thus, the HWE test was performed on the case and control groups for the other 14 SNPs, and the results are shown in Table 4.
Table 2: Specific gene distribution of identified SNPs, except SNP-15 (GSMT1) which has only two genotypes
All Samples |
Group A (40) |
Group B (40) |
|||
|---|---|---|---|---|---|
SNP |
Genotype |
Sample Counts |
Sample Counts |
||
SNP-01 |
|||||
miR-146a |
CC |
16 |
40.00% |
16 |
40.00% |
rs2910164 |
GG |
4 |
10.00% |
6 |
15.00% |
C>G |
CG |
20 |
50.00% |
18 |
45.00% |
SNP-02 |
|||||
MDS1-EVI1 |
GG |
5 |
12.50% |
6 |
15.00% |
rs6774494 |
AA |
18 |
45.00% |
13 |
32.50% |
G>A |
GA |
17 |
42.50% |
21 |
52.50% |
SNP-03 |
|||||
XPC |
CC |
6 |
15.00% |
11 |
27.50% |
rs2228000 |
TT |
5 |
12.50% |
3 |
7.50% |
C>T |
CT |
29 |
72.50% |
26 |
65.00% |
SNP-04 |
|||||
HCG9 |
AA |
15 |
37.50% |
7 |
17.50% |
rs3869062 |
GG |
4 |
10.00% |
3 |
7.50% |
A>G |
AG |
21 |
52.50% |
30 |
75.00% |
SNP-05 |
|||||
HCG9 |
TT |
25 |
62.50% |
22 |
55.00% |
rs16896923 |
CC |
0 |
0.00% |
0 |
0.00% |
T>C |
TC |
15 |
37.50% |
18 |
45.00% |
SNP-06 |
|||||
MMP2 |
CC |
2 |
5.00% |
0 |
0.00% |
rs243865 |
TT |
6 |
15.00% |
8 |
20.00% |
C>T |
CT |
32 |
80.00% |
32 |
80.00% |
SNP-07 |
|||||
SPLUNC1 |
TT |
20 |
50.00% |
21 |
52.50% |
rs2752903 |
CC |
3 |
7.50% |
0 |
0.00% |
T>C |
TC |
17 |
42.50% |
19 |
47.50% |
SNP-08 |
|||||
SPLUNC1 |
AA |
13 |
32.50% |
10 |
25.00% |
rs750064 |
GG |
5 |
12.50% |
7 |
17.50% |
A>G |
AG |
22 |
55.00% |
23 |
57.50% |
SNP-09 |
|||||
HLA-F |
TT |
14 |
35.00% |
18 |
45.00% |
rs3129055 |
CC |
5 |
12.50% |
2 |
5.00% |
T>C |
CT |
21 |
52.50% |
20 |
50.00% |
SNP-10 |
|||||
GABBR1 |
TT |
29 |
72.50% |
24 |
60.00% |
rs2076483 |
CC |
0 |
0.00% |
0 |
0.00% |
T>C |
CT |
11 |
27.50% |
16 |
40.00% |
SNP-11 |
|||||
GABBR1 |
GG |
11 |
27.50% |
26 |
65.00% |
rs29232 |
AA |
6 |
15.00% |
0 |
0.00% |
G>A |
GA |
23 |
57.50% |
14 |
35.00% |
SNP-12 |
|||||
TP53 |
CC |
6 |
15.00% |
8 |
20.00% |
rs1042522 |
GG |
29 |
72.50% |
20 |
50.00% |
C>G |
CG |
5 |
12.50% |
12 |
30.00% |
SNP-13 |
|||||
IL-10 |
AA |
37 |
92.50% |
37 |
92.50% |
rs1800896 |
GG |
0 |
0.00% |
0 |
0.00% |
A>G |
AG |
3 |
7.50% |
3 |
7.50% |
SNP-14 |
|||||
MDM2 |
TT |
9 |
22.50% |
8 |
20.00% |
rs2279744 |
GG |
9 |
22.50% |
10 |
25.00% |
T>G |
TG |
22 |
55.00% |
22 |
55.00% |
Table 3: Distribution of the 15 SNP alleles
All Allele |
Group A (80) |
Group B (80) |
|||
|---|---|---|---|---|---|
SNP |
Allele |
Counts |
Counts |
||
SNP-01 |
|||||
miR-146a |
C |
52 |
0.65 |
50 |
0.625 |
rs2910164 |
G |
28 |
0.35 |
30 |
0.375 |
SNP-02 |
|||||
MDS1-EVI1 |
G |
27 |
33.75% |
33 |
41.25% |
rs6774494 |
A |
53 |
66.25% |
47 |
58.75% |
SNP-03 |
|||||
XPC |
C |
41 |
51.25% |
48 |
60.00% |
rs2228000 |
T |
39 |
48.75% |
32 |
40.00% |
SNP-04 |
|||||
HCG9 |
A |
51 |
63.75% |
44 |
55.00% |
rs3869062 |
G |
29 |
36.25% |
36 |
45.00% |
SNP-05 |
|||||
HCG9 |
T |
65 |
81.25% |
62 |
77.50% |
rs16896923 |
C |
15 |
18.75% |
18 |
22.50% |
SNP-06 |
|||||
MMP2 |
C |
36 |
45.00% |
32 |
40.00% |
rs243865 |
T |
44 |
55.00% |
48 |
60.00% |
SNP-07 |
|||||
SPLUNC1 |
T |
57 |
71.25% |
61 |
76.25% |
rs2752903 |
C |
23 |
28.75% |
19 |
23.75% |
SNP-08 |
|||||
SPLUNC1 |
A |
48 |
60.00% |
43 |
53.75% |
rs750064 |
G |
32 |
40.00% |
37 |
46.25% |
SNP-09 |
|||||
HLA-F |
T |
49 |
61.25% |
56 |
70.00% |
rs3129055 |
C |
31 |
38.75% |
24 |
30.00% |
SNP-10 |
|||||
GABBR1 |
T |
69 |
86.25% |
64 |
80.00% |
rs2076483 |
C |
11 |
13.75% |
16 |
20.00% |
SNP-11 |
|||||
GABBR1 |
G |
45 |
56.25% |
66 |
82.50% |
rs29232 |
A |
35 |
43.75% |
14 |
17.50% |
SNP-12 |
|||||
TP53 |
C |
17 |
21.25% |
28 |
35.00% |
rs1042522 |
G |
63 |
78.75% |
52 |
65.00% |
SNP-13 |
|||||
IL-10 |
A |
77 |
96.25% |
77 |
96.25% |
rs1800896 |
G |
3 |
3.75% |
3 |
3.75% |
SNP-14 |
|||||
MDM2 |
T |
40 |
50.00% |
38 |
47.50% |
rs2279744 |
G |
40 |
50.00% |
42 |
52.50% |
SNP-15 |
|||||
GSTM1 |
+ |
15 |
37.50% |
25 |
62.50% |
DEL |
25 |
62.50% |
15 |
37.50% |
|
Table 4: HWE test of the case group (Group A) and control group (Group B)
SNP No. |
SNP |
HWE (P value) |
|
|---|---|---|---|
Group A |
Group B |
||
SNP-01 |
miR-146a |
0.391(0.532) |
0.064(0.800) |
SNP-02 |
MDS1-EVI1 |
0.098(0.754) |
0.277(0.599) |
SNP-03 |
XPC |
8.133(0.004) |
5.017(0.025) |
SNP-04 |
HCG9 |
0.739(0.390) |
10.615(0.001) |
SNP-05 |
HCG9 |
2.130(0.144) |
3.371(0.066) |
SNP-06 |
MMP2 |
15.186(0.000) |
17.778(0.000) |
SNP-07 |
SPLUNC1 |
0.056(0.813) |
3.881(0.049) |
SNP-08 |
SPLUNC1 |
0.851(0.356) |
0.980(0.322) |
SNP-09 |
HLA-F |
0.449(0.503) |
1.451(0.228) |
SNP-10 |
GABBR1 |
1.017(0.313) |
2.500(0.114) |
SNP-11 |
GABBR1 |
1.132(0.287) |
1.800(0.180) |
SNP-12 |
TP53 |
15.701(0.000) |
4.642(0.031) |
SNP-13 |
IL-10 |
0.061(0.805) |
0.061(0.805) |
SNP-14 |
MDM2 |
0.400(0.527) |
0.422(0.516) |
SNP-15 |
GSTM1 |
- |
- |
Statistical analysis on all SNPs were performed using the homozygous wild-type genotype as reference to assess the relationship between SNPs and NPC susceptibility (Table 5). The statistical analysis yielded the following results. Firstly, the mutant heterozygous type of SNP-04 (HCG9, rs3869062, A>G) might be related to the incidence of NPC, as an increased risk was found for the AG versus the AA genotype (OR = 3.061, 95%CI: 1.064-8.804), while no association was found between the GG genotype and NPC risk. Secondly, the SNP-11 variation (GABBR1, rs29232, G>A) might have a protective role in the development of NPC, because the risk of the SNP-11 mutant genotype was lower than that of the wild-type (OR = 0.204, 95% CI: 0.079-0.528). Thirdly, genetic deletion of SNP-15 (GSTM1) might contribute to increased susceptibility to NPC. Finally, no associations were found between the remaining SNPs and NPC risk in our case-control study.
Table 5: Statistical analysis of the relationship between theSNPs and NPC susceptibility
Group A |
Group B |
P value |
OR |
95%CI |
|
|---|---|---|---|---|---|
SNP-01 |
|||||
GG/CG |
24 |
24 |
1.000 |
1.000 |
0.409-2.446 |
GG |
4 |
6 |
0.826 |
0.900 |
0.351-2.307 |
CG |
20 |
18 |
0.849 |
1.500 |
0.355-6.347 |
CC |
16 |
16 |
|||
SNP-02 |
|||||
GA/AA |
35 |
34 |
0.745 |
0.810 |
0.226-2.903 |
AA |
18 |
13 |
0.712 |
0.602 |
0.151-2.404 |
GA |
17 |
21 |
1.000 |
1.029 |
0.267-3.963 |
GG |
5 |
6 |
|||
SNP-03 |
|||||
TT/CT |
34 |
39 |
0.172 |
0.465 |
0.153-1.413 |
TT |
5 |
3 |
0.389 |
0.327 |
0.057-1.870 |
CT |
29 |
26 |
0.209 |
0.489 |
0.158-1.509 |
CC |
6 |
11 |
|||
SNP-04 |
|||||
GG/AG |
25 |
33 |
0.045 |
2.829 |
1.003-7.977 |
GG |
4 |
3 |
0.665 |
1.607 |
0.281-9.204 |
AG |
21 |
30 |
0.034 |
3.061 |
1.064-8.804 |
AA |
15 |
7 |
|||
SNP-05 |
|||||
CC/TC |
15 |
18 |
0.496 |
1.364 |
0.558-3.331 |
CC |
0 |
0 |
|||
TC |
15 |
18 |
|||
TT |
25 |
22 |
|||
SNP-06 |
|||||
TT |
6 |
8 |
0.556 |
1.417 |
0.443-4.534 |
CT/CC |
34 |
32 |
|||
CT |
32 |
32 |
|||
CC |
2 |
0 |
|||
SNP-07 |
|||||
CC/TC |
20 |
19 |
0.823 |
0.905 |
0.376-2.175 |
CC |
3 |
0 |
0.234 |
||
TC |
17 |
19 |
0.891 |
1.064 |
0.434-2.608 |
TT |
20 |
21 |
|||
SNP-08 |
|||||
GG/AG |
27 |
30 |
0.459 |
1.444 |
0.545-3.828 |
GG |
5 |
7 |
0.489 |
1.820 |
0.443-7.477 |
AG |
22 |
23 |
0.551 |
1.359 |
0.495-3.734 |
AA |
13 |
10 |
|||
SNP-09 |
|||||
CC/CT |
26 |
22 |
0.361 |
0.658 |
0.268-1.619 |
CC |
5 |
2 |
0.235 |
0.311 |
0.052-1.849 |
CT |
21 |
20 |
0.526 |
0.741 |
0.293-1.875 |
TT |
14 |
18 |
|||
SNP-10 |
|||||
CC/CT |
11 |
16 |
0.237 |
1.758 |
0.687-4.495 |
CC |
0 |
0 |
|||
CT |
11 |
16 |
|||
TT |
29 |
24 |
|||
SNP-11 |
|||||
AA/GA |
29 |
14 |
0.001 |
0.204 |
0.079-0.528 |
AA |
6 |
0 |
|||
GA |
23 |
14 |
0.005 |
0.258 |
0.098-0.678 |
GG |
11 |
26 |
|||
SNP-12 |
|||||
GG/CG |
34 |
32 |
0.556 |
0.706 |
0.221-2.259 |
GG |
29 |
20 |
0.278 |
0.517 |
0.155-1.721 |
CG |
5 |
12 |
0.477 |
1.800 |
0.407-7.957 |
CC |
6 |
8 |
|||
SNP-13 |
|||||
GG/AG |
3 |
3 |
1.000 |
1.000 |
0.189-5.280 |
GG |
0 |
0 |
|||
AG |
3 |
3 |
|||
AA |
37 |
37 |
|||
SNP-14 |
|||||
GG/TG |
31 |
32 |
0.785 |
1.161 |
0.397-3.395 |
GG |
9 |
10 |
1.000 |
1.250 |
0.337-4.636 |
TG |
22 |
22 |
0.837 |
1.125 |
0.367-3.451 |
TT |
9 |
8 |
|||
SNP-15 |
|||||
+ |
15 |
25 |
0.025 |
0.360 |
0.146-0.890 |
DEL |
25 |
15 |
The statistical analysis was made between TT gene model and CT gene model combined with CC gene model of SNP-06. The OR value of the CC gene model of SNP-07 could not be calculated because of the little number. OR, odds ratio; CI, confidence intervals.
DISCUSSION
The study of the association of SNPs with tumor development and progression has become a hot area of research. For instance, using NGS, Gerlinger et al. found that VHL gene aberrations and an increased proportion of C>T transitions at CpG sites were closely related with the occurrence and development of clear cell renal carcinoma [12]. Stemke-Hale et al., on the other hand, reported that several SNPs and other mutations on multiple gene loci, such as KRAS c.35G>A p.Gly12Asp, BRAF V600E, and PIK3CA H1047Y, were related to borderline ovarian tumors [13]. In addition, NGS-based studies describing the association of SNPs and genetic mutations with colorectal cancer [11], breast cancer [36], glioblastoma [37], and adenoid cystic carcinoma [6], have been recently published. Although numerous studies investigated the relationship of SNPs with NPC susceptibility, the results are generally underpowered and somewhat controversial. Although many methods exist to study SNPs, such as PCR and probe hybridization technologies, only a few studies have analyzed the association of SNPs with NPC susceptibility by high-throughput sequencing technologies, especially NGS. Therefore, and to provide a theoretical basis for NPC screening and early prevention, we performed a meta-analysis to review existing SNP/NPC association data in East Asian populations, and carried out a case-control study to directly assess, using NGS, the expression of candidate SNPs in 40 NPC patients.
Our meta-analysis revealed that 15 SNPs were associated with the risk of NPC: TP53 (rs1042522, C>G), GSTM1 (+/DEL), IL-10 (rs1800896, A>G), GABBR1 (rs2076483, T>C; rs29232, G>A), MDM2 (rs2279744, T>G), miR-146a (rs2910164, C>G), MDS1-EVI1 (rs6774494, G>A), XPC (rs2228000, C>T), HCG9 (rs3869062, A>G; rs16896923, T>C), HLA-F (rs3129055, T>C), MMP2 (rs243865, C>T), and SPLUNC1 (rs2752903, T>C; rs750064, A>G). TP53 is a tumor suppressor gene located on human chromosome 17p13, and plays an important role in the stress response to hypoxia, gene damage, oncogene activation, and other injuries. TP53 also contributes to maintaining gene stability and regulating cell cycle [14-18]. Glutathione S-transferase M1 (GSTM1), a member of the glutathione s-transferase family, mediates cellular detoxification of electrophilic compounds, including carcinogens, by conjugation with glutathione [19-21]. The interleukin-10 (IL-10) gene is located on chromosome 1q31-32, and is mainly expressed in macrophages, mononuclear cells, activated B cells, and Th2 cells. IL-10 is a multifunctional negative regulatory factor and promotes tumor evasion of the immune response by downregulating the production of interferon-γ [22, 23]. The gamma-aminobutyric acid type B receptor subunit 1 gene (GABBR1), located on chromosome 6p21.3, encodes the GABAB1 receptor of gamma-aminobutyric acid, the main inhibitory neurotransmitter in the central nervous system. GABBR1 is a metabolic pathway gene, mainly related to neural network remodeling and inhibition of the diffusion of abnormal brain electrical activity [24, 25]. The murine double minute 2 (MDM2) proto-oncogene is located on chromosome 12q13-14. The MDM2 T309G polymorphism (rs2279744) can enhance MDM2 binding to the transcription factor SP1, thereby enhancing its own transcription and increasing the inhibition of the tumor suppressor TP53. MDM2 can also mediate TP53-independent tumorigenicity and control cell growth and proliferation through regulation of E2F1 expression via the MDM2-TP53-p21 signaling pathway [16, 26]. The micro ribonucleic acid-146a (miR-146a) gene, located on chromosome 5q33.3, is overexpressed or underexpressed in some tumors and functions as an oncogene or tumor suppressor gene [27, 28]. The Myelodysplastic Syndrome 1 / Ecotropic Viral Integration site-1 (MDS1-EVI1) complex locus encodes three kinds of proteins, namely EVI1, MDS1, and the fusion protein MDS1-EVI1. MDS1-EVI1 is a strong activator of promoters containing a GATA motif [29, 30]. Xeroderma pigmentosum group C (XPC), located on chromosome 3p25, is one of the key genes of the nucleotide excision repair (NER) pathway in the gene damage repair system. The main function of XPC is to identify and excise damaged sites in the genes [30, 31]. HCG9, the human leukocyte antigen (HLA) complex 9 gene, belongs to the HLA complex family along with HLA-F. The HLA complex, located on chromosome 6p21.3, is composed of a group of closely linked genes and is the most complex gene system in the human genome [24, 25]. Matrix metalloproteinase 2 (MMP2) is the main and the most widely distributed member of the matrix metalloproteinase family. It is involved in the degradation of extracellular matrix, and can destroy tissue barriers during the process of tumor cell invasion [32, 33]. The short palate lung and nasal epithelium clone 1 (SPLUNC1) gene belongs to the palate lung and nasal epithelium clone family, which has host defense functions. This gene family is expressed mostly on the epithelial surface of the respiratory and digestive tracts and play a role in signal transduction of external stimuli. SPLUNC1 is a natural immune protective molecule; it has anti-inflammatory actions, tumor suppressor effects, and helps maintain the normal physiology of the upper respiratory tract [34, 35]. Our analysis indicates that miR-146a (rs2910164, C>G), HCG9 (rs3869062, A>G), HCG9 (rs16896923, T>C), MMP2 (rs243865, C>T), GABBR1 (rs2076483, T>C), and TP53 (rs1042522, C>G) are associated with decreased susceptibility to NPC, while the other SNPs might contribute instead to increased risk of NPC. Based on our meta-analysis’ results, we carried out a case-control study to evaluate, using NGS, the presence of the 15 candidate SNPs in NPC patients and healthy controls. To this end, blood samples were extracted and amplified to obtain a large number of target genes, which were then sequenced by the PSTAR high-throughput instrument. We found a significantly increased risk for NPC in individuals carrying the AG genotype of HCG9 (rs3869062, A>G), as compared with those carrying AA alleles. A positive association with NPC was also detected for a genetic deletion (i.e. heterozygous genotype) of the GSTM1 allele. In contrast, our study indicated a negative association between a SNP in GABBR1 (rs29232, G>A) and NPC, which might indicate a protective role for this gene variant in the carcinogenesis of NPC. In contrast with most previous findings, no associations were found between the remaining candidate SNPs and NPC risk.
In our case-control study, the positive association of HCG9 (rs3869062) and GABBR1 (rs29232) with NPC risk contrasts with the negative association detected between these SNPs and NPC risk in our meta-analysis. The reason of this discrepancy may be that the sample size of our case-control experiment is small, and statistical analysis could not be carried out for some genotypes. Other limitations of our case-control study is that no consideration was paid to possible gene interactions, likely to affect the development of NPC and other cancers as well. However, our study identified three SNPs which are most likely related to NPC susceptibility, and provides a basis for further SNP analyses of NPC risk.
Hundreds of thousands to millions of DNA molecules can be analyzed in parallel using NGS technology, making gene analysis much more convenient and quick. Therefore, our future research plan is to enlarge the sample size to confirm through NGS the association of the three significant genetic variants [HCG9 (rs3869062), GABBR1 (rs29232), and GSTM1 (+/DEL)] with NPC susceptibility. This should allow validation of a robust NPC risk screening protocol useful to detect at-risk population and guide early prevention efforts.
MATERIALS AND METHODS
Meta-analysis methods and SNP identification
A comprehensive search strategy was performed to identify relevant case-control studies about the association of SNPs with NPC susceptibility. Using electronic databases, including PubMed (http://www.ncbi.nlm.nih.gov/pubmed/), Web of Science (http://wokinfo.com/) and SD (http://www.science-direct.com/), a search strategy was performed based on combinations of the keywords ‘nasopharyngeal, rhinopharyngeal, nasopharynx, rhinopharynx, or nasal part of pharynx’ and ‘cancer, tumor, tumour, neoplasm, carcinoma or adenocarcinoma’ and ‘polymorphism, variation, genetic, mutation, variant, or SNP’. The last search was updated on April 1, 2014. Although no language restrictions were applied initially, for the full-text review and final analysis the resources only permitted the review of studies published in English. The following eligibility criteria were used: i) studies published in English; ii) case-control design; iii) evaluating the association between SNP and NPC susceptibility; iv) participants were from East Asia, including China, Japan and Korea; and v) the studies indicated sample size, distribution of alleles, genotypes, or other information which could aid in inferring the estimation of odds ratios (OR) and their 95% confidence intervals (CI). Data from the eligible studies, selected in strict accordance with the inclusion criteria, were independently extracted by two investigators. Controversial issues were resolved following group discussion. The following data were extracted from each study: first author’s name, publication year, gene, SNP, rs number, country of origin, genotyping method, conclusion (positive/negative), total number of cases and controls, genotype or allele distribution, and the P-value for Hardy-Weinberg equilibrium (HWE). The quality of the eligible studies was assessed by two investigators independently, according to a set of predefined criteria (Supplementary Table 16) originally proposed by Thankkinstian et al [38]. The revised criteria cover the representativeness of cases, the credibility of controls, specimens of cases determining genotypes, HWE in the controls, and total sample size. Disagreements between investigators were resolved by consensus. Study quality scores ranged between 0 (lowest) and 15 (highest). Studies with scores ≥10 were considered high-quality, while those with scores <10 were considered low-quality studies. Articles addressing the same SNP(s) were combined for meta-analysis. Summary ORs and corresponding 95% CIs were used to estimate the strength of the associations between each SNP and NPC risk in different comparison models. Z test was used to evaluate the statistical significance of pooled OR values. The statistical heterogeneity among studies was assessed by Q test and I2 statistics. A random-effects model (DerSimonian and Laird method) was used to estimate the summary OR when the result of the Q test was P < 0.1 or I2 ≥ 50%, which indicated the presence of heterogeneity. The fixed-effects model (Mantel-Haenszel method) was used when the result of the Q test was P ≥ 0.1 and I2 < 50%, which indicated the absence of heterogeneity. Stata software, version 11.0 (Stata Corp., College Station, TX, USA) was used for all statistical analyses. All P-values were two-sided.
Case-study
Subjects recruitment
The case group consisted of 40 subjects from South China that were pathologically diagnosed with NPC and treated at the Department of Oncology of the First Affiliated Hospital of Guangdong Pharmaceutical University between June 2014 and July 2014. The control group consisted of 40 healthy people from South China that underwent physical examination in the Medical Center of the same hospital during the same time. All subjects signed informed consent. This study was approved by the ethics committees of the First Affiliated Hospital of Guangdong Pharmaceutical University.
SNP genotyping
A 5 ml venous blood sample was collected from each subject. The samples from the 40 NPC patients in the case group (Group A), were numbered A01 to A40. Likewise, the 40 blood samples from the healthy volunteers in the control group (Group B), were numbered B01 to B40. Numbering and basic information of the 15 SNPs associated with NPC susceptibility, as detected by meta-analysis, are shown in Table 6. DNA was extracted from blood samples using the HYK Blood DNA mini Extraction Kit (HYK, Shenzhen, China). The quality and concentration of genomic DNA for each sample were determined using a NanoDrop Spectrophotometer (Thermo Scientific, Wilmington, DE). If the extracted DNA did not meet the experiment’s concentration requirement (at least 50 ng/μl), it was re-extracted. The quality of the extracted DNA was assessed by agarose gel electrophoresis (Tanon, Shanghai, China). A single, clear main band with a faint side band indicated that the extracted DNA quality was high and uncontaminated. Primer Premier 5 (Premier Biosoft, CA) primer design software was used to design primers targeting a ~100bp region around the polymorphic loci, and primer sequences were compared in the NCBI database to determine specificity. The primers used for PCR amplification of the 15 SNPs, synthesized by Sangon Biotech Co., Ltd (Shanghai, China), are shown in Table 7. A PCR instrument (Eppendorf, DE) was used to amplify the sequence of the detection region of each polymorphic locus, which was called target fragment. The quality of the amplified target fragment was assessed by PAGE gel electrophoresis (Tanon, Shanghai, China). Individually labeled magnetic beads were linked to each target fragment and then retrieved for high-throughput sequencing. The magnetic bead’s label corresponding to each target fragment was annotated for proper identification. Finally, a PSTAR-II high-throughput sequencing instrument (HYK, Shenzhen, China) was used, according to the manufacturer’s instructions, to detect the target fragments in order to analyze the corresponding polymorphic loci. The sequencing principle of the PSTAR-II was as follows: the sequencing primer was combined to the joint sequence of the sequencing sample by annealing based on the principle of base complementation. Then the fluorescent probe was combined with the sample under the action of the sequencing enzyme. The fluorescent signal emitted at specific excitation wavelengths was collected, and the base of the test site on the sample was determined by the type of fluorescent signal. Information on the sequencing primers is shown in Table 8.
Table 6: Numbering and information of the 15 SNPs
SNP No. |
SNP |
RS_ID |
Ref_SNP |
|---|---|---|---|
SNP-01 |
miR-146a |
rs2910164 |
C>G |
SNP-02 |
MDS1-EVI1 |
rs6774494 |
G>A |
SNP-03 |
XPC |
rs2228000 |
C>T |
SNP-04 |
HCG9 |
rs3869062 |
A>G |
SNP-05 |
HCG9 |
rs16896923 |
T>C |
SNP-06 |
MMP2 |
rs243865 |
C>T |
SNP-07 |
SPLUNC1 |
rs2752903 |
T>C |
SNP-08 |
SPLUNC1 |
rs750064 |
A>G |
SNP-09 |
HLA-F |
rs3129055 |
T>C |
SNP-10 |
GABBR1 |
rs2076483 |
T>C |
SNP-11 |
GABBR1 |
rs29232 |
G>A |
SNP-12 |
TP53 |
rs1042522 |
C>G |
SNP-13 |
IL-10 |
rs1800896 |
A>G |
SNP-14 |
MDM2 |
rs2279744 |
T>G |
SNP-15 |
GSTM1 |
—— |
+/DEL |
Table 7: Primers used for PCR amplification of candidate SNPs
No. |
SNP |
Primer no. |
Primer sequence |
|---|---|---|---|
1 |
miR-146a |
NPC-SNP-01(184)F |
AAAGCCGATGTGTATCCTCAG |
NPC-SNP-01(184)R |
GCCTTCTGTCTCCAGTCTTCC |
||
2 |
MDS1-EVI1 |
NPC-SNP-02(175)F |
GACATCACCTGTTCACCCACTC |
NPC-SNP-02(175)R |
CAAGCCAGGAATCAAAGATGAC |
||
3 |
XPC |
NPC-SNP-03(136)F |
CAAAGGCTGGGTCCAAGAG |
NPC-SNP-03(136)R |
TCTGCCTTCTCACCATCGC |
||
4 |
HCG9 |
NPC-SNP-04(136)F |
AAGGTGAGTGCTCCCTGATGG |
NPC-SNP-04(136)R |
CCTGACCTTGTGATCTACCCG |
||
5 |
HCG9 |
NPC-SNP-05(152)F |
TTGCTAACAACTATAAAAAAGTCGG |
NPC-SNP-05(152)R |
GTCTCCTCCTTGGTATTCCATTC |
||
6 |
MMP2 |
NPC-SNP-06(137)F |
TTGCTGTTTTTCATCTCTGGGC |
NPC-SNP-06(137)R |
GACAATCAAGGAAGGCTTCCTG |
||
7 |
SPLUNC1 |
NPC-SNP-07(155)F |
AAACAGGAGACCCTTGCCC |
NPC-SNP-07(155)R |
GGAAGGGACCTCAGTCTCATC |
||
8 |
SPLUNC1 |
NPC-SNP-08(132)F |
TTCAGGGCTCTCCAAAGTAAA |
NPC-SNP-08(132)R |
CCGCTCAGGAAACCATAAAGT |
||
9 |
HLA-F |
NPC-SNP-09(118)F |
GTTGACACTGACGTTTCCTCC |
NPC-SNP-09(118)R |
AATGGTTTGGGGGTGGAT |
||
10 |
GABBR1 |
NPC-SNP-10(178)F |
TGGCTTTTCTTGTTCTGTTTTG |
NPC-SNP-10(178)R |
GGAAGAAGCACAATTGGGATAG |
||
11 |
GABBR1 |
NPC-SNP-11(147)F |
TGCTCTACTCCTATTCCCGATG |
NPC-SNP-11(147)R |
AGCATTAGACCTGGCAAGACC |
||
12 |
TP53 |
NPC-SNP-12(187)F |
AAGCAATGGATGATTTGATGC |
NPC-SNP-12(187)R |
TGGGAAGGGACAGAAGATGAC |
||
13 |
IL-10 |
NPC-SNP-13(187)F |
CCAACTGGCTCCCCTTACC |
NPC-SNP-13(187)R |
GAAATAACAAGGAAAAGAAGTCAGG |
||
14 |
MDM2 |
NPC-SNP-14(96)F |
GCGGGAGTTCAGGGTAAAGG |
NPC-SNP-14(96)R |
CTAGTGACCCGACAGGCACC |
||
15 |
GSTM1 |
NPC-SNP-15(215)F |
GAACTCCCTGAAAAGCTAAAGC |
NPC-SNP-15(215)R |
CTTGGGCTCAAATATACGGTGG |
Table 8: Sequencing primers of the 15 SNPs
No. |
SNP |
Primer no. |
Primer sequence |
|---|---|---|---|
1 |
miR-146a |
NPC-SNP-ANCHOR-01 |
GGTCTGACACTGAC |
2 |
MDS1-EVI1 |
NPC-SNP-ANCHOR-02 |
AGCCATGGCCTGTA |
3 |
XPC |
NPC-SNP-ANCHOR-03 |
TGGCAAGCTTGGGT |
4 |
HCG9 |
NPC-SNP-ANCHOR-04 |
TTTTATTATGGGTT |
5 |
HCG9 |
NPC-SNP-ANCHOR-05 |
CAAATCCTTTCACA |
6 |
MMP2 |
NPC-SNP-ANCHOR-06 |
AGTGCTGGGTGGGG |
7 |
SPLUNC1 |
NPC-SNP-ANCHOR-07 |
CCTACATCTGGGGT |
8 |
SPLUNC1 |
NPC-SNP-ANCHOR-08 |
ACCAAATAGCTTAA |
9 |
HLA-F |
NPC-SNP-ANCHOR-09 |
AGCCAAAATCCAGA |
10 |
GABBR1 |
NPC-SNP-ANCHOR-10 |
TGGGGAGGAGGGAA |
11 |
GABBR1 |
NPC-SNP-ANCHOR-11 |
TTTTGATAGCATTG |
12 |
TP53 |
NPC-SNP-ANCHOR-12 |
GGGAGCAGCCTCT |
13 |
IL-10 |
NPC-SNP-ANCHOR-13 |
CCCAAAGAAGCCTT |
14 |
MDM2 |
NPC-SNP-ANCHOR-14 |
GCGGCCCCGCAGC |
15 |
GSTM1 |
NPC-SNP-ANCHOR-15 |
ATGCTCTGGAAAACT |
Statistical analysis
PSTAR-II v33.211 software was used for PSTAR high-throughput data analysis. After HWE test (http://www.oege.org/software/hardy-weinberg.html), the genotype frequencies between Group A and Group B were compared by two-sided χ2 test. Unconditional logistic regression analysis was used for estimating OR and 95% CI. Three genotypes were discriminated for each SNP (except for GSTM1), and the homozygous wild-type was used as the reference for statistical analysis. A P-value <0.05 was considered statistically significant. Statistical analysis was performed using SPSS version 19.0 software (SPSS Inc., Chicago, IL, USA).
Abbreviations
NPC: nasopharyngeal carcinoma
EBV: Epstein-Barr virus
SNP: single nucleotide polymorphism
PCR: polymerase chain reaction
NGS: next-generation sequencing technology
HWE: Hardy-Weinberg equilibrium
GSTM1: Glutathione S-transferase M1
IL-10: Interleukin-10
GABBR1: Gamma aminobutyric acid b receptor 1
MDM2: Murine double minute 2
miR-146a: Micro ribonucleic acid-146a
MDS1-EVI1: Myelodysplasia 1 and ecotropic viral insertion site 1 fusion proteins
XPC: Xeroderma pigmentosum group C
NER: nucleotide excision repair
HLA: human leukocyte antigen
MMP2: Matrix metalloproteinase 2
SPLUNC1: Short palate lung and nasal epithelium clone 1
OR: odds ratio
CI: confidence interval
Author contributions
Guarantor of integrity of the entire study : Xi-Cheng Wang
Study concepts : Xi-Cheng Wang, Ying Ding and Shu Yang
Study design: Xi-Cheng Wang, Mu-Yun Wu and Shu-Jing Huang
Literature research : Xi-Cheng Wang, Mu-Yun Wu, Shu-Jing Huang and Fan Yang
Clinical studies : Mu-Yun Wu, Shu-Jing Huang and Fan Yang
Experimental studies : Mu-Yun Wu, Shu-Jing Huang and Dong Liu
Data acquisition : Fan Yang, Xin-Tian Qin and Dong Liu
Data analysis : Fan Yang, Xin-Tian Qin and Dong Liu
Statistical analysis : Mu-Yun Wu, Shu-Jing Huang, and Fan Yang
Manuscript preparation : Mu-Yun Wu and Shu-Jing Huang
Manuscript editing : Mu-Yun Wu and Shu-Jing Huang
Manuscript revision : Xi-Cheng Wang, Ying Ding and Shu Yang
ACKNOWLEDGMENTS AND FUNDING
This study is partially supported by the Guangzhou Science and Technology Plan Project (No. 201400000001-1) and the Guangdong Science and Technology Plan Project (No.2014A020209083 and No.2013B022000093).
CONFLICTS OF INTEREST
The authors declare no conflict of interest.
REFERENCES
1. Jia WH, Qin HD. Non-viral environmental risk factors for nasopharyngeal carcinoma: a systematic review. Semin Cancer Biol. 2012; 22:117–26.
2. Hildesheim A, Wang CP. Genetic predisposition factors and nasopharyngeal carcinoma risk: a review of epidemiological association studies, 2000-2011: Rosetta Stone for NPC: genetics, viral infection, and other environmental factors. Semin Cancer Biol. 2012; 22:107–16.
3. Su CK, Wang CC. Prognostic value of Chinese race in nasopharyngeal cancer. Int J Radiat Oncol Biol Phys. 2002; 54:752–58.
4. Gaudet M, Fara AG, Beritognolo I, Sabatti M. Allele-specific PCR in SNP genotyping. Methods Mol Biol. 2009; 578:415–24.
5. Burnside J, Ouyang M, Anderson A, Bernberg E, Lu C, Meyers BC, Green PJ, Markis M, Isaacs G, Huang E, Morgan RW. Deep sequencing of chicken microRNAs. BMC Genomics. 2008; 9:185.
6. Stephens PJ, Davies HR, Mitani Y, Van Loo P, Shlien A, Tarpey PS, Papaemmanuil E, Cheverton A, Bignell GR, Butler AP, Gamble J, Gamble S, Hardy C, et al. Whole exome sequencing of adenoid cystic carcinoma. J Clin Invest. 2013; 123:2965–68.
7. Newburger DE, Kashef-Haghighi D, Weng Z, Salari R, Sweeney RT, Brunner AL, Zhu SX, Guo X, Varma S, Troxell ML, West RB, Batzoglou S, Sidow A. Genome evolution during progression to breast cancer. Genome Res. 2013; 23:1097–108.
8. Kreck B, Richter J, Ammerpohl O, Barann M, Esser D, Petersen BS, Vater I, Murga Penas EM, Bormann Chung CA, Seisenberger S, Lee Boyd V, Smallwood S, Drexler HG, et al. Base-pair resolution DNA methylome of the EBV-positive Endemic Burkitt lymphoma cell line DAUDI determined by SOLiD bisulfite-sequencing. Leukemia. 2013; 27:1751–53.
9. Shankar R. The bioinformatics of next generation sequencing: a meeting report. J Mol Cell Biol. 2011; 3:147–50.
10. Sarhadi VK, Lahti L, Scheinin I, Tyybäkinoja A, Savola S, Usvasalo A, Räty R, Elonen E, Ellonen P, Saarinen-Pihkala UM, Knuutila S. Targeted resequencing of 9p in acute lymphoblastic leukemia yields concordant results with array CGH and reveals novel genomic alterations. Genomics. 2013; 102:182–88.
11. Han SW, Kim HP, Shin JY, Jeong EG, Lee WC, Lee KH, Won JK, Kim TY, Oh DY, Im SA, Bang YJ, Jeong SY, Park KJ, et al. Targeted sequencing of cancer-related genes in colorectal cancer using next-generation sequencing. PLoS One. 2013; 8:e64271.
12. Gerlinger M, Horswell S, Larkin J, Rowan AJ, Salm MP, Varela I, Fisher R, McGranahan N, Matthews N, Santos CR, Martinez P, Phillimore B, Begum S, et al. Genomic architecture and evolution of clear cell renal cell carcinomas defined by multiregion sequencing. Nat Genet. 2014; 46:225–33.
13. Stemke-Hale K, Shipman K, Kitsou-Mylona I, de Castro DG, Hird V, Brown R, Flanagan J, Gabra H, Mills GB, Agarwal R, El-Bahrawy M. Frequency of mutations and polymorphisms in borderline ovarian tumors of known cancer genes. Mod Pathol. 2013; 26:544–52.
14. Golovleva I, Birgander R, Själander A, Lundgren E, Beckman L. Interferon-α and p53 alleles involved in nasopharyngeal carcinoma. Carcinogenesis. 1997; 18:645–47.
15. Tsai MH, Lin CD, Hsieh YY, Chang FC, Tsai FJ, Chen WC, Tsai CH. Prognostic significance of the proline form of p53 codon 72 polymorphism in nasopharyngeal carcinoma. Laryngoscope. 2002; 112:116–19.
16. Xiao M, Zhang L, Zhu X, Huang J, Jiang H, Hu S, Liu Y. Genetic polymorphisms of MDM2 and TP53 genes are associated with risk of nasopharyngeal carcinoma in a Chinese population. BMC Cancer. 2010; 10:147.
17. Li L, Wu J, Sima X, Bai P, Deng W, Deng X, Zhang L, Gao L. Interactions of miR-34b/c and TP-53 polymorphisms on the risk of nasopharyngeal carcinoma. Tumour Biol. 2013; 34:1919–23.
18. Zhang X, Chen X, Zhai Y, Cui Y, Cao P, Zhang H, Wu Z, Li P, Yu L, Xia X, He F, Zhou G. Combined effects of genetic variants of the PTEN, AKT1, MDM2 and p53 genes on the risk of nasopharyngeal carcinoma. PLoS One. 2014; 9:e92135.
19. Cheng YJ, Chien YC, Hildesheim A, Hsu MM, Chen IH, Chuang J, Chang J, Ma YD, Luo CT, Hsu WL, Hsu HH, Huang H, Chang JF, et al. No association between genetic polymorphisms of CYP1A1, GSTM1, GSTT1, GSTP1, NAT2, and nasopharyngeal carcinoma in Taiwan. Cancer Epidemiol Biomarkers Prev. 2003; 12:179–80.
20. Guo X, O’Brien SJ, Zeng Y, Nelson GW, Winkler CA. GSTM1 and GSTT1 gene deletions and the risk for nasopharyngeal carcinoma in Han Chinese. Cancer Epidemiol Biomarkers Prev. 2008; 17:1760–63.
21. Jiang Y, Li N, Dong P, Zhang N, Sun Y, Han M, Wen J, Chen M. Polymorphisms in GSTM1, GSTTI and GSTP1 and nasopharyngeal cancer in the east of China: a case-control study. Asian Pac J Cancer Prev. 2011; 12:3097–100.
22. Tsai CW, Tsai MH, Shih LC, Chang WS, Lin CC, Bau DT. Association of interleukin-10 (IL10) promoter genotypes with nasopharyngeal carcinoma risk in Taiwan. Anticancer Res. 2013; 33:3391–96.
23. Wei YS, Kuang XH, Zhu YH, Liang WB, Yang ZH, Tai SH, Zhao Y, Zhang L. Interleukin-10 gene promoter polymorphisms and the risk of nasopharyngeal carcinoma. Tissue Antigens. 2007; 70:12–17.
24. Hsu WL, Tse KP, Liang S, Chien YC, Su WH, Yu KJ, Cheng YJ, Tsang NM, Hsu MM, Chang KP, Chen IH, Chen TI, Yang CS, et al. Evaluation of human leukocyte antigen-A (HLA-A), other non-HLA markers on chromosome 6p21 and risk of nasopharyngeal carcinoma. PLoS One. 2012; 7:e42767.
25. Tse KP, Su WH, Chang KP, Tsang NM, Yu CJ, Tang P, See LC, Hsueh C, Yang ML, Hao SP, Li HY, Wang MH, Liao LP, et al. Genome-wide association study reveals multiple nasopharyngeal carcinoma-associated loci within the HLA region at chromosome 6p21.3. Am J Hum Genet. 2009; 85:194–203.
26. Zhou G, Zhai Y, Cui Y, Zhang X, Dong X, Yang H, He Y, Yao K, Zhang H, Zhi L, Yuan X, Qiu W, Zhang X, et al. MDM2 promoter SNP309 is associated with risk of occurrence and advanced lymph node metastasis of nasopharyngeal carcinoma in Chinese population. Clin Cancer Res. 2007; 13:2627–33.
27. Huang GL, Chen ML, Li YZ, Lu Y, Pu XX, He YX, Tang SY, Che H, Zou Y, Ding C, He Z. Association of miR-146a gene polymorphism with risk of nasopharyngeal carcinoma in the central-southern Chinese population. J Hum Genet. 2014; 59:141–44.
28. Lung RW, Wang X, Tong JH, Chau SL, Lau KM, Cheng SH, Woo JK, Woo J, Leung PC, Ng MH, Tang NL, To KF. A single nucleotide polymorphism in microRNA-146a is associated with the risk for nasopharyngeal carcinoma. Mol Carcinog. 2013; 52:E28–38.
29. Bei JX, Li Y, Jia WH, Feng BJ, Zhou G, Chen LZ, Feng QS, Low HQ, Zhang H, He F, Tai ES, Kang T, Liu ET, et al. A genome-wide association study of nasopharyngeal carcinoma identifies three new susceptibility loci. Nat Genet. 2010; 42:599–603.
30. Yee Ko JM, Dai W, Wun Wong EH, Kwong D, Tong Ng W, Lee A, Kai Cheong Ngan R, Chung Yau C, Tung S, Li Lung M. Multigene pathway-based analyses identify nasopharyngeal carcinoma risk associations for cumulative adverse effects of TERT-CLPTM1L and DNA double-strand breaks repair. Int J Cancer. 2014; 135:1634–45.
31. Yang ZH, Liang WB, Jia J, Wei YS, Zhou B, Zhang L. The xeroderma pigmentosum group C gene polymorphisms and genetic susceptibility of nasopharyngeal carcinoma. Acta Oncol. 2008; 47:379–84.
32. Shao JY, Cao Y, Miao XP, Huang MY, Deng L, Hao JJ, Liang XM, Hu LF, Ernberg I, Lin DX, Zeng YX. A single nucleotide polymorphism in the matrix metalloproteinase 2 promoter is closely associated with high risk of nasopharyngeal carcinoma in Cantonese from southern China. Chin J Cancer. 2011; 30:620–26.
33. Zhou G, Zhai Y, Cui Y, Qiu W, Yang H, Zhang X, Dong X, He Y, Yao K, Zhang H, Peng Y, Yuan X, Zhi L, et al. Functional polymorphisms and haplotypes in the promoter of the MMP2 gene are associated with risk of nasopharyngeal carcinoma. Hum Mutat. 2007; 28:1091–97.
34. Yew PY, Mushiroda T, Kiyotani K, Govindasamy GK, Yap LF, Teo SH, Lim PV, Govindaraju S, Ratnavelu K, Sam CK, Yap YY, Khoo AS, Pua KC, et al, and Malaysian NPC Study Group. Identification of a functional variant in SPLUNC1 associated with nasopharyngeal carcinoma susceptibility among Malaysian Chinese. Mol Carcinog. 2012; 51:E74–82.
35. He Y, Zhou G, Zhai Y, Dong X, Lv L, He F, Yao K. Association of PLUNC gene polymorphisms with susceptibility to nasopharyngeal carcinoma in a Chinese population. J Med Genet. 2005; 42:172–76.
36. Robinson DR, Kalyana-Sundaram S, Wu YM, Shankar S, Cao X, Ateeq B, Asangani IA, Iyer M, Maher CA, Grasso CS, Lonigro RJ, Quist M, Siddiqui J, et al. Functionally recurrent rearrangements of the MAST kinase and Notch gene families in breast cancer. Nat Med. 2011; 17:1646–51.
37. Keller A, Harz C, Matzas M, Meder B, Katus HA, Ludwig N, Fischer U, Meese E. Identification of novel SNPs in glioblastoma using targeted resequencing. PLoS One. 2011; 6:e18158.
38. Thakkinstian A, McEvoy M, Minelli C, Gibson P, Hancox B, Duffy D, Thompson J, Hall I, Kaufman J, Leung TF, Helms PJ, Hakonarson H, Halpi E, et al. Systematic review and meta-analysis of the association between {beta}2-adrenoceptor polymorphisms and asthma: a HuGE review. Am J Epidemiol. 2005; 162:201–11.