
INTRODUCTION
Experimental studies have demonstrated the promising properties of selective serotonin reuptake inhibitors (SSRI) such as citalopram in cancer diseases especially colorectal carcinoma [1, 2]. Citalopram and its S-eniantomer escitalopram have never been assessed and compared on neuroblastoma, the extracranial cancer the most commonly diagnosed during infancy [3]. Neuroblastoma is a developmental tumor which cell components originate in the neural crests and migrate to further contribute to the peripheral sympathetic nervous system: the sympathetic-chain ganglia trunks, the adrenal medulla and the prevertebral ganglia where neuroblastic proliferation may result in frequent tumor localizations.
Clinical presentation and prognosis of neuroblastoma display a surprising heterogeneity, ranging from benign tumors with cases of spontaneous regression to polymetastatic lethal disease. Genetic analysis of tumor samples performed in the last two decades correlated these prognostic disparities to an extensive series of genetic features actually considered as the prognosis markers of the disease notably MYCN [4, 5]. Those associated with a poor clinical outcome have become the potential targets for the development of new therapeutic approaches.
The aim of this work was to assess and compare the cytotoxicity of 2 SSRI, citalopram and escitalopram, on neuroblastoma cell lines including 2 non-MYCN amplified cell lines (rat B104 and human SH-SY5Y) and 2 human MYCN amplified cell lines (IMR32 and Kelly). The innocuity of citalopram and escitalopram on the myelin of the peripheral nervous system was assessed on primary human Schwann cells. Gene expression profiles of neuroblastoma prognosis markers using microarray method and quantitative real-time PCR (qPCR) analysis were determined to explore the molecular mechanisms of citalopram and escitalopram cytotoxicity on neuroblastoma cell lines.
RESULTS
Effects of citalopram and escitalopram on the viability of rat B104, human SH-SY5Y, IMR32 and Kelly neuroblastoma cell lines and human primary Schwann cells
Rat B104, human SH-SY5Y, IMR32 and Kelly neuroblastoma cells were exposed to increasing concentrations of citalopram and escitalopram. On all cell lines citalopram and escitalopram showed a concentration-dependent cytotoxicity, as assessed by the neutral red assay [6], but citalopram was more cytotoxic than escitalopram. In addition IMR32 was the cell line the most sensitive to both molecules. No toxicity was detected on human primary Schwann cells for citalopram or escitalopram.
B104 cell line: Citalopram significantly decreased B104 cell viability, 61%, 33% and 11% at respectively 100, 125 and 150 μM. Escitalopram significantly decreased B104 cell viability, 65%, 34% and 14% at respectively 125, 150 and 175 μM (Figure 1A).
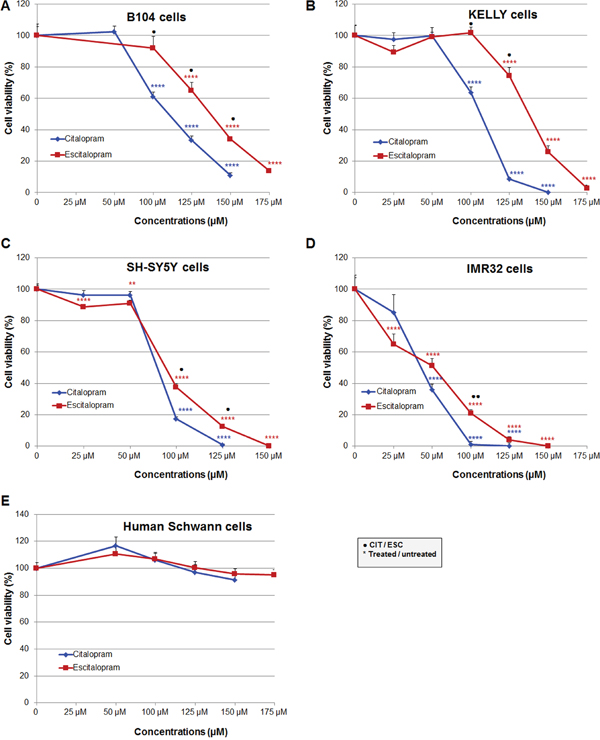
Figure 1: Comparative cytotoxicity of citalopram and escitalopram on rat B104, human Kelly, SH-SY5Y and IMR32 neuroblastoma cell lines and human Schwann cell primary cultures treated for 24 h with citalopram and escitalopram. Cell viability was assessed using neutral red assay in (A) B104 cells, (B) Kelly cells, (C) SH-SY5Y cells, (D) IMR32 cells and (E) Human Schwann cells. Citalopram was more cytotoxic than escitalopram on all neuroblastoma cell lines. Human Schwann cells were resistant to citalopram and escitalopram treatment. Data represent treated cell viability as a percentage to untreated cells and are presented as mean values +/- SEM. Significantly different from untreated cells, ** p<0.01, **** p<0.001. Significant difference between citalopram and escitalopram treated cells, ● p<0.05, ●● p<0.01.
Kelly cell line: Citalopram significantly decreased Kelly cell viability, 64%, 9% and 0% at respectively 100, 125 and 150 μM. Escitalopram significantly decreased Kelly cell viability, 74%, 26% and 3% at respectively 125, 150 and 175 μM (Figure 1B).
SH-SY5Y cell line: Citalopram drastically decreased SH-SY5Y cell viability, 17%, 1% at respectively 100 and 125 μM. Escitalopram decreased cell viability to a lesser extent, 89%, 91%, 38% and 12% at respectively 25, 50, 100 and 125 μM; total mortality was observed at 150 μM (Figure 1C).
IMR32 cell line: Citalopram drastically decreased IMR32 cell viability, 36%, 1% and 0% at respectively 50, 100 and 125 μM. Escitalopram decreased cell viability to a lesser extent, 65%, 51%, 21%, 4% and 0% at respectively 25, 50, 100, 125 and 150 μM (Figure 1D).
Primary human Schwann cells: Citalopram or escitalopram did not impact human Schwann cell viability at 50, 100, 125, 150 and 175 μM (Figure 1E).
Comparative sensitivity of neuroblastoma cell lines: The sensitivity of neuroblastoma cell lines to citalopram and escitalopram are presented in Figure 2.
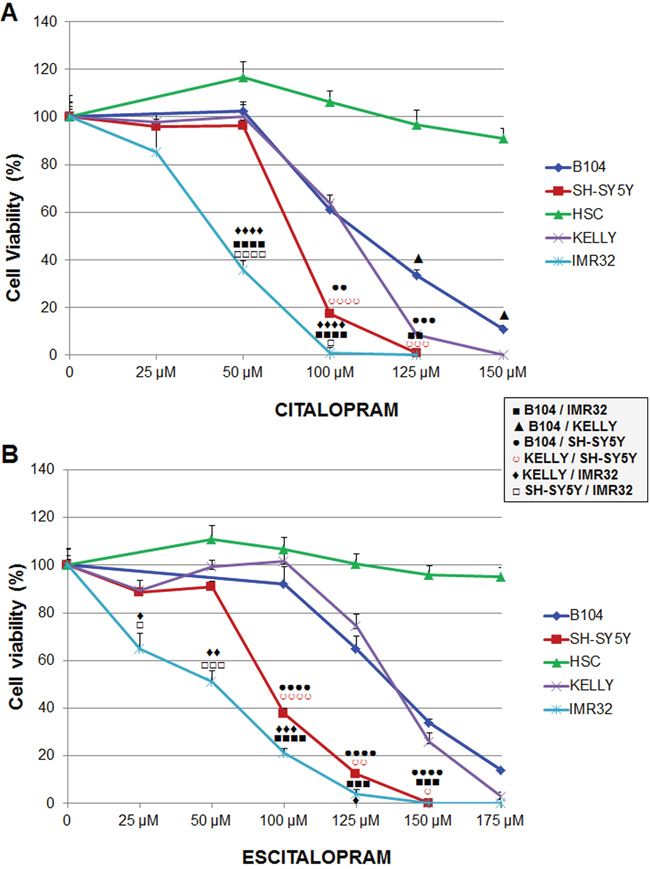
Figure 2: Sensitivity of B104, Kelly, SH-SY5Y and IMR32 neuroblastoma cell lines and human Schwann cells to citalopram or escitalopram. (A) Viability after 24 h treatment with citalopram. Cytotoxicity of citalopram was dose-dependent; IMR32 were the most sensitive cells. No cytotoxic effect of citalopram was measured on human Schwann cells. (B) Viability after 24 h treatment with escitalopram. Escitalopram cytotoxicity was dose-dependent. IMR32 were the most sensitive cells. No cytotoxic effect of escitalopram was measured on human Schwann cells. Data represent treated cell viability as a percentage to untreated cells and are presented as mean values +/- SEM.
After treatment with citalopram: Briefly the viability of all cell lines was significantly decreased at concentrations of citalopram superior to 50 μM except IMR32 cells which viability was already altered at this concentration (Figure 2A). B104 cell line was the most resistant cell line. At lower concentrations Kelly cells provided a similar profile as B104 cells but were significantly more sensitive at higher concentrations. IMR32 was the most sensitive cell line with viability close to 0% at 100μM. SH-SY5Y displayed an intermediary profile with sensitivity between IMR32 and Kelly cells.
After treatment with escitalopram: IMR32 cells were the most sensitive cells with a viability that decreased from 25 μM of escitalopram. SH-SY5Y displayed a similar profile, with no significant difference with IMR32 at higher concentrations. The viability of B104 and Kelly cell lines was decreased at concentrations of escitalopram superior to 100 μM. Their profile was similar (Figure 2B).
Effects of citalopram and escitalopram on gene expression
Microarray analysis: Expression profile of B104 cells following a 24 h treatment with citalopram or escitalopram was studied by microarray experiments using 30 367 rat oligonucleotide probes. Citalopram and escitalopram modulated the expression of respectively 5 004 and 4 033 probes related to genes of known function. In addition, the expression of 3 979 probes was modulated by both citalopram and escitalopram. 1 586 probes were regulated only by citalopram while 461 probes were regulated only by escitalopram. More precisely, citalopram modulated the expression of 1 502 genes with a fold change ≥ 2, and p<0.05 including 516 up-regulated genes and 986 down regulated. Escitalopram modulated the expression of 1 164 genes with a fold change ≥ 2, and p<0.05. They included 428 up-regulated genes and 736 down-regulated genes. The expression of 1 021 genes with a fold change ≥ 2, and p<0.05 were modulated by both citalopram and escitalopram (Figure 3A, 3B). Genes differentially expressed following treatment of neuroblastoma cell line with citalopram or escitalopram were analyzed according to their pathways as recorded in the Kyoto Encyclopedia of Genes and Genomes (KEGG database). With p<10-5 citalopram modulated 69 pathways; the 4 most affected pathways were Cell Cycle (68 genes), Lysosome (60 genes), Pathways in Cancer (98 genes) and DNA Replication (28 genes) (Supplementary data 1). With the same p value, escitalopram modulated 42 pathways; the 4 most affected pathways were Cell Cycle (62 genes), Lysosome (56 genes), DNA Replication (29 genes) and Pathways in Cancer (78 genes) (Supplementary data 2). Ten signaling pathways were differently modulated by citalopram and escitalopram with p<6.83 10-6. Only 5 genes involved in Glioma pathway were differently modulated by citalopram and escitalopram (with p<0.04) (Supplementary data 3). The influence of citalopram and escitalopram on gene expression was first focused on genes that might be involved in the prognosis of neuroblastoma (Table 1, Figure 3C). The genes which expression was drastically inhibited were MYBL2, BIRC5 and BARD1 with a fold-change of respectively -107 (p<2.26 10-7), -24.1 (p<5.6 10-9) and -17.7 (p<1.2 10-7) after treatment with citalopram and respectively -89 (p<2.26 10-7), -18.8 (p<5.6 10-9) and -27.3 (p<1.2 10-7) after treatment with escitalopram. Gene expression of CCNE1, AURKA, IGF2, MYCN and ERBB2 was significantly inhibited by both molecules whereas the expression of IGF1 was inhibited only by citalopram. The expression of MDM2 and VEGFA were significantly increased by both molecules. The expression of AKT1, ALK, BCL2, IGF1R and IGF2R, EGF and EGFR, LIN28B, PDGFA and PDGFB, PHOX2B, TP53 was not modulated by either molecule. Several signaling pathways (Human Gene Database, GeneCards, PathCards) were more specifically altered by citalopram or escitalopram, notably PI3K-AKT, cell cycle, GPCR and MAPK signaling pathways. The study was extended to the expression of genes involved in general carcinogenesis (Table 2, Figure 4). Briefly, most genes were modulated by both molecules in the same way, 3 genes were modulated exclusively by escitalopram and 16 genes exclusively by citalopram. Particularly, CCNA2 was drastically down-regulated by both citalopram and escitalopram with a fold-change of respectively -90 and -67 with p<4.86 10-11. The main signaling pathways modulated by both molecules were PI3K-AKT, GPCR, FGFR, MAPK and ERK. In the Glioma pathways (KEGG), 3 genes were down-regulated by both citalopram and escitalopram (E2F1, DAPK1, CCND1). Two genes (CDK6 and IGF1) were down-regulated only by citalopram, while CDKN1A and IL6 were up-regulated only by citalopram, and STAT3 up-regulated only by escitalopram with p<10-4 (Table 1, Table 2).
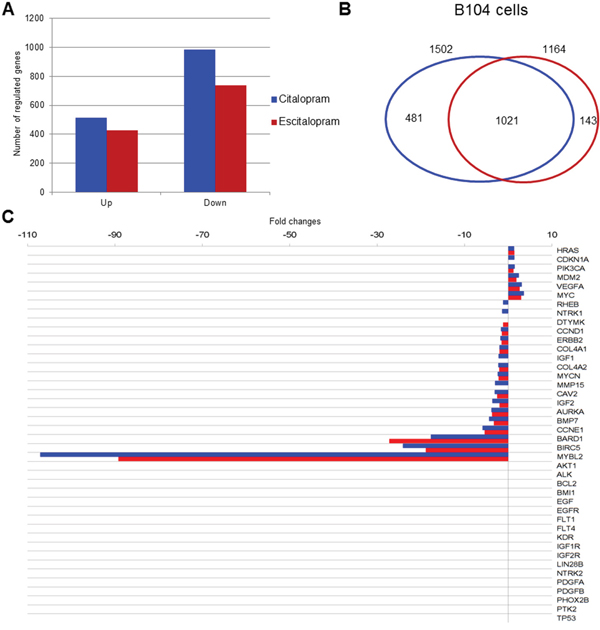
Figure 3: Modulation of gene expression by citalopram or escitalopram in B104 cells, Venn diagram, neuroblastoma prognostic marker gene expression. (A) Modulation of gene expression by citalopram (blue) or escitalopram (red) in B104 cells. Histogram shows the number of up-regulated and down-regulated gene. The spectrum of action of citalopram is broader than escitalopram. (B) Venn diagram showing gene modulation by 24 h treatment with citalopram (blue) or escitalopram (red), fold change ≥ 2, and p<0.05. 1 196 genes are regulated by both molecules whereas 504 are specifically modulated by citalopram and 109 by escitalopram. (C) Neuroblastoma prognostic marker gene expression after treatment with citalopram (blue) or escitalopram (red). Prognosis markers are classified according to their fold change, with max p<7.36 10-4. The action of citalopram is more intense, its spectrum of action broader than escitalopram.
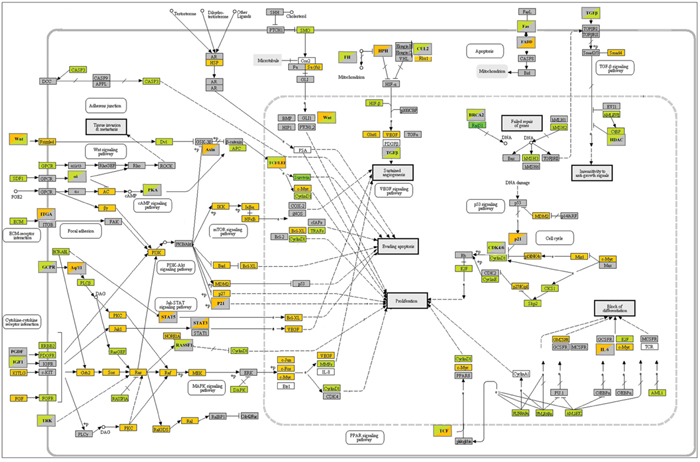
Figure 4: KEGG pathways in cancer. B104 cells. Gene expression modulations by citalopram and escitalopram. Orange: up-regulation; green: down-regulation; grey: no regulation. Upper left corner: regulation by citalopram; lower right corner regulation by escitalopram.
Table 1: Neuroblastoma prognostic marker gene expression after treatment by citalopram or escitalopram
Gene symbol |
Gene name |
GenBank |
CIT |
ESC |
||
|---|---|---|---|---|---|---|
Accession number |
Fold change |
p value |
Fold change |
p value |
||
AKT1 |
V-Akt Murine Thymoma Viral Oncogene Homolog 1 |
NM_033230 |
- |
- |
- |
- |
ALK |
Anaplastic Lymphoma Receptor Tyrosine Kinase |
NM_001169101 |
- |
- |
- |
- |
AURKA |
Aurora Kinase A |
NM_153296 |
-3.87 |
5.97E-09 |
-3.72 |
5.97E-09 |
BARD1 |
BRCA1 Associated RING Domain 1 |
NM_153296 |
-17.71 |
1.20E-07 |
-27.25 |
1.20E-07 |
BCL2 |
B-Cell CLL/Lymphoma 2 |
NM_016993 |
- |
- |
- |
- |
BIRC5 |
Baculoviral IAP Repeat Containing 5 (survivin) |
NM_022274 |
-24.09 |
5.63E-09 |
-18.88 |
5.63E-09 |
BMI1 |
BMI1 Proto-Oncogene, Polycomb Ring Finger |
NM_001107368 |
- |
- |
- |
- |
BMP7 |
Bone Morphogenetic Protein 7 |
NM_001191856 |
-4.38 |
6.82E-08 |
-3.28 |
6.82E-08 |
CAV2 |
Caveolin 2 |
NM_131914 |
-3.07 |
7.70E-07 |
-2.53 |
7.70E-07 |
CCND1 |
Cyclin D1 |
NM_171992 |
-1.65 |
1.02E-04 |
-1.47 |
1.02E-04 |
CCNE1 |
Cyclin E1 |
NM_001100821 |
-5.91 |
9.27E-10 |
-5.39 |
9.27E-10 |
CDKN1A |
Cyclin-Dependent Kinase Inhibitor 1A (p21) |
NM_080782 |
1.38 |
7.36E-04 |
- |
- |
COL4A1 |
Collagen, Type IV, Alpha 1 |
NM_001135009 |
-2.02 |
4.40E-06 |
-2.03 |
4.40E-06 |
COL4A2 |
Collagen, Type IV, Alpha 2 |
XM_001076134 |
-2.29 |
7.03E-06 |
-2.10 |
7.03E-06 |
DTYMK |
Deoxythymidylate Kinase |
NM_001106925 |
- |
- |
- |
- |
EGF |
Epidermal Growth Factor |
NM_012842 |
- |
- |
- |
- |
EGFR |
Epidermal Growth Factor Receptor |
NM_031507 |
- |
- |
- |
- |
ERBB2 |
Erb-B2 Receptor Tyrosine Kinase 2 |
NM_017003 |
-1.78 |
5.41E-05 |
-1.52 |
5.41E-05 |
FLT1 |
Fms-Related Tyrosine Kinase 1 (VEGFR1) |
NM_019306 |
- |
- |
- |
- |
FLT4 |
Fms-Related Tyrosine Kinase 4 (VEGFR3) |
NM_053652 |
- |
- |
- |
- |
HRAS |
Harvey Rat Sarcoma Viral Oncogene Homolog |
NM_001098241 |
1.32 |
2.48E-05 |
1.38 |
2.48E-05 |
IGF1 |
Insulin-Like Growth Factor 1 |
NM_001082479 |
-2.2 |
3.64E-05 |
- |
- |
IGF2 |
Insulin-Like Growth Factor 2 |
NM_031511 |
-3.63 |
1.86E-04 |
-1.99 |
1.86E-04 |
IGF1R |
Insulin-Like Growth Factor 1 Receptor |
NM_052807 |
- |
- |
- |
- |
IGF2R |
Insulin-Like Growth Factor 2 Receptor |
NM_012756 |
- |
- |
- |
- |
KDR |
Kinase Insert Domain Receptor (VEGFR2) |
NM_013062 |
- |
- |
- |
- |
LIN28B |
Lin-28 Homolog B (C. Elegans) |
XM_001069344 |
- |
- |
- |
- |
MDM2 |
MDM2 Proto-Oncogene, E3 Ubiquitin Protein Ligase |
NM_001108099 |
2.43 |
6.50E-07 |
1.88 |
6.50E-07 |
MMP15 |
Matrix Metallopeptidase 15 |
NM_001106168 |
-3.02 |
4.34E-05 |
- |
|
MYBL2 |
V-Myb Avian Myeloblastosis Viral Oncogene Homolog-Like 2 |
NM_001106536 |
-107.09 |
2.26E-07 |
-89.22 |
2.26E-07 |
MYC |
V-Myc Avian Myelocytomatosis Viral Oncogene Homolog |
NM_012603 |
3.53 |
7.44E-9 |
2.98 |
7.44E-09 |
MYCN |
V-Myc Avian Myelocytomatosis Viral Oncogene Neuroblastoma Derived Homolog |
NM_001013096 |
-2.43 |
2.08E-07 |
-2.19 |
2.08E-07 |
NTRK1 |
Neurotrophic Tyrosine Kinase, Receptor, Type 1 |
NM_021589 |
-1.38 |
3.49E-04 |
- |
- |
NTRK2 |
Neurotrophic Tyrosine Kinase, Receptor, Type 2 |
NM_012731 |
- |
- |
- |
- |
PDGFA |
Platelet-Derived Growth Factor Alpha Polypeptide |
XM_006248919 |
- |
- |
- |
- |
PDGFB |
Platelet-Derived Growth Factor Beta Polypeptide |
NM_031524 |
- |
- |
- |
- |
PHOX2B |
Paired-Like Homeobox 2b |
NM_013158 |
- |
- |
- |
- |
PIK3CA |
Phosphatidylinositol-4,5-Bisphosphate 3-Kinase, Catalytic Subunit Alpha |
NM_133399 |
1.43 |
1.43E-06 |
1.19 |
1.43E-06 |
PTK2 |
Protein Tyrosine Kinase (FAK) |
NM_013081 |
- |
- |
- |
- |
RHEB |
Ras Homolog Enriched In Brain |
NM_013216 |
-1.20 |
8.35E-05 |
- |
- |
TP53 |
Tumor Protein P53 |
NM_030989 |
- |
- |
- |
- |
VEGFA |
Vascular Endothelial Growth Factor A |
NM_001287107 |
3.10 |
1.60E-05 |
2.61 |
1.60E-05 |
Table 2: List of genes involved in cancer pathways significantly modulated by citalopram or escitalopram treatment
Gene symbol |
Gene name |
GenBank |
CIT |
ESC |
||
|---|---|---|---|---|---|---|
Accession number |
Fold change |
p value |
Fold change |
p value |
||
ABL1 |
ABL Proto-Oncogene 1, Non-Receptor Tyrosine Kinase |
NM_001100850 |
-1.65 |
6.71E-06 |
-1.89 |
1.59E-05 |
ADCY5 |
Adenylate Cyclase 5 |
NM_022600 |
1.44 |
7.36E-07 |
1.54 |
7.36E-07 |
APC2 |
Adenomatosis Polyposis Coli 2 |
NM_001106769 |
-8.28 |
8.77E-09 |
-5.44 |
8.77E-09 |
AXIN1 |
Axin 1 |
NM_024405 |
1.15 |
1.25E-03 |
- |
- |
BAD |
BCL2-Associated Agonist Of Cell Death |
NM_022698 |
1.23 |
9.43E-05 |
1.22 |
9.43E-05 |
BCL2L1 |
BCL2-Like 1 (bcl-xl) |
NM_001033670 |
1.74 |
1.75E-06 |
1.44 |
1.75E-06 |
BRCA2 |
Breast Cancer 2, Early Onset |
NM_031542 |
-6.70 |
5.78E-05 |
- |
- |
CASP3 |
Caspase 3, Apoptosis-Related Cysteine Peptidase |
NM_012922 |
-1.38 |
1.51E-06 |
-1.29 |
1.51E-06 |
CCNA2 |
Cyclin A2 |
NM_053702 |
-89.96 |
4.86E-11 |
-67.41 |
4.86E-11 |
CCNE2 |
Cyclin E2 |
NM_001108656 |
-29.86 |
2.49E-06 |
-26.18 |
2.49E-06 |
CDK6 |
Cyclin-Dependent Kinase 6 |
NM_001191861 |
-2.97 |
6.37E-06 |
- |
- |
CDKN1B |
Cyclin-Dependent Kinase Inhibitor 1B (P27, Kip1) |
NM_031762 |
1.89 |
1.63E-06 |
1.72 |
1.63E-06 |
KS1B |
CDC28 Protein Kinase Regulatory Subunit 1B |
NM_001135749 |
-3.10 |
6.54E-09 |
-2.76 |
9.14E-08 |
CSF2RA |
Colony Stimulating Factor 2 Receptor, Alpha, Low-Affinity(GMCSFR) |
NM_001037660 |
1.57 |
4.23E-06 |
1.69 |
4.23E-06 |
CTBP2 |
C-Terminal Binding Protein 2 |
NM_053335 |
-1.57 |
5.21E-05 |
-1.50 |
5.21E-05 |
CUL2 |
Cullin 2 |
NM_001108417 |
-1.39 |
1.11E-04 |
- |
- |
CXCL12 |
Chemokine (C-X-C Motif) Ligand 12 (SDF1) |
NM_022177 |
-3.60 |
1.87E-06 |
-3.04 |
1.87E-06 |
DAPK1 |
Death-Associated Protein Kinase 1 |
NM_001107335 |
-1.35 |
7.98E-04 |
-1.35 |
7.98E-04 |
DVL1 |
Dishevelled Segment Polarity Protein 1 |
NM_031820 |
-1.21 |
2.91E-04 |
-1.19 |
2.91E-04 |
E2F1 |
E2F Transcription Factor 1 |
NM_001100778 |
-3.08 |
8.78E-09 |
-2.91 |
8.78E-09 |
E2F8 |
E2F Transcription Factor 8 |
XM_001080259 |
-23.62 |
1.86E-08 |
-30.44 |
1.86E-09 |
EGLN2 |
Egl-9 Family Hypoxia-Inducible Factor 2(HPH) |
NM_001004083 |
1.33 |
1.99E-03 |
- |
- |
FADD |
Fas (TNFRSF6)-Associated Via Death Domain |
NM_152937 |
- |
- |
2.17 |
6.59E-04 |
FAS |
Fas Cell Surface Death Receptor |
NM_139194 |
-6.46 |
1.85E-05 |
- |
- |
FGF9 |
Fibroblast Growth Factor 9 |
NM_012952 |
3.35 |
1.36E-05 |
4.17 |
1.36E-05 |
FGFR1 |
Fibroblast Growth Factor Receptor 1 |
NM_024146 |
-2.00 |
4.56E-05 |
-1.75 |
4.64E-05 |
FH |
Fumarate Hydratase |
NM_017005 |
-1.50 |
6.40E-06 |
- |
- |
FOS |
Cellular Oncogene C-Fos |
NM_022197 |
3.79 |
4.42E-05 |
3.01 |
4.42E-05 |
FZD1 |
Frizzled Class Receptor 1 |
NM_021266 |
-2.93 |
5.55E-08 |
-2.72 |
5.55E-05 |
GRB2 |
Growth Factor Receptor-Bound Protein 2 |
NM_030846 |
1.27 |
8.39E-05 |
1.29 |
8.39E-05 |
Hdac1 |
Histone Deacetylase 1 |
NM_001025409 |
-1.20 |
4.25E-04 |
- |
- |
IKBKB |
Inhibitor Of Kappa Light Polypeptide Gene Enhancer In B-Cells, Kinase Beta |
NM_053355 |
1.30 |
8.25E-05 |
1.14 |
8.25E-05 |
IL6 |
Interleukin 6 |
NM_012589 |
3.60 |
2.18E-04 |
- |
- |
ITGA3 |
Integrin, Alpha 3 (Antigen CD49C, Alpha 3 Subunit Of VLA-3 Receptor) |
XM_003750907 |
1.33 |
2.89E-03 |
- |
- |
JAK1 |
Janus Kinase 1 |
NM_053466 |
1.47 |
2.70E-04 |
1.34 |
2.70E-04 |
JUN |
Proto-Oncogene C-Jun |
NM_021835 |
3.55 |
6.41E-05 |
3.19 |
6.41E-05 |
KITLG |
KIT Ligand |
NM_021843 |
3.15 |
3.01E-07 |
2.71 |
3.27E-04 |
LAMTOR1 |
Late Endosomal/Lysosomal Adaptor, MAPK And MTOR Activator 1 |
NM_199102 |
2.12 |
1.05E-06 |
2.06 |
1.05E-04 |
LAMTOR3 |
Late Endosomal/Lysosomal Adaptor, MAPK And MTOR Activator 3 |
NM_001008375 |
1.90 |
8.28E-07 |
1.77 |
8.28E-04 |
LAMTOR4 |
Late Endosomal/Lysosomal Adaptor, MAPK And MTOR Activator 4 |
NM_001108330 |
1.31 |
4.07E-05 |
1.36 |
4.07E-05 |
LAMTOR5 |
Late Endosomal/Lysosomal Adaptor, MAPK And MTOR Activator 5 |
NM_001106462 |
1.49 |
5.21E-05 |
1.50 |
5.21E-05 |
MAP2K1 |
Mitogen-Activated Protein Kinase Kinase 1 |
NM_031643 |
1.80 |
1.64E-05 |
1.51 |
1.64E-05 |
MMP2 |
Matrix Metallopeptidase 2 |
NM_031054 |
-6.66 |
2.37E-06 |
-5.04 |
6.65E-05 |
MSH2 |
MutS Homolog 2(hMSH2) |
NM_031058 |
-2.82 |
3.95E-06 |
-2.55 |
3.95E-06 |
MSH3 |
MutS Homolog 3(hMSH3) |
NM_001191957 |
-1.90 |
1.20E-06 |
-1.69 |
1.20E-06 |
NFKB2 |
Nuclear Factor Of Kappa Light Polypeptide Gene Enhancer In B-Cells 2 (P49/P100) |
NM_001008349 |
1.39 |
1.25E-03 |
- |
- |
NFKBIA |
Nuclear Factor Of Kappa Light Polypeptide Gene Enhancer In B-Cells Inhibitor, Alpha |
NM_001105720 |
1.97 |
1.02E-06 |
2.42 |
1.02E-06 |
PDGFRL |
Platelet-Derived Growth Factor Receptor-Like |
NM_001011921 |
-2.83 |
3.03E-06 |
-2.80 |
3.03E-06 |
PRKCA |
Protein Kinase C, Alpha |
NM_001105713 |
1.65 |
6.24E-05 |
1.48 |
6.24E-05 |
PRKCD |
Protein Kinase C, Delta |
NM_133307 |
2.85 |
2.65E-09 |
2.69 |
2.65E-09 |
PRKDC |
Protein Kinase, DNA-Activated, Catalytic Polypeptide |
XM_003751100 |
-1.55 |
3.36E-04 |
- |
- |
RAD51 |
RAD51 Recombinase |
NM_001109204 |
-49.86 |
6.06E-10 |
-41.01 |
1.74E-07 |
RAF1 |
Raf-1 Proto-Oncogene, Serine/Threonine Kinase |
NM_012639 |
1.23 |
6.52E-05 |
1.26 |
6.52E-05 |
RALA |
RAL |
NM_031093 |
1.87 |
1.66E-05 |
1.72 |
1.66E-05 |
RALGDS |
Ral Guanine Nucleotide Dissociation Stimulator |
NM_019250 |
1.55 |
2.69E-04 |
1.39 |
2.69E-04 |
RASSF1 |
Ras Association (RalGDS/AF-6) Domain Family Member 1 |
NM_001007754 |
-1.67 |
3.57E-04 |
- |
- |
RBX1 |
Ring-Box 1, E3 Ubiquitin Protein Ligase |
NM_001034135 |
1.21 |
1.29E-04 |
1.27 |
1.29E-04 |
RUNX1 |
Runt-Related Transcription Factor 1(AML1) |
NM_017325 |
-1.40 |
1.64E-05 |
-1.35 |
1.64E-05 |
SKP2 |
S-Phase Kinase-Associated Protein 2, E3 Ubiquitin Protein Ligase |
NM_130413 |
-3.73 |
4.44E-07 |
-4.58 |
4.44E-07 |
SLC2A1 |
Solute Carrier Family 2 (Facilitated Glucose Transporter), Member 1(Glut1) |
NM_138827 |
2.23 |
2.72E-08 |
2.10 |
2.72E-08 |
SMAD4 |
SMAD Family Member 4 |
NM_019275 |
1.50 |
5.85E-06 |
1.40 |
5.85E-06 |
SMO |
Smoothened, Frizzled Class Receptor |
NM_012807 |
-1.88 |
3.16E-05 |
-1.36 |
3.16E-05 |
SOS2 |
Son Of Sevenless Homolog 2 |
NM_001135561 |
1.56 |
7.96E-04 |
1.35 |
6.40E-06 |
STAT3 |
Signal Transducer And Activator Of Transcription 3 |
NM_012747 |
- |
- |
1.40 |
1.15E-04 |
STAT5A |
Signal Transducer And Activator Of Transcription 5A |
NM_017064 |
1.39 |
2.96E-04 |
- |
- |
STAT5B |
Signal Transducer And Activator Of Transcription 5B |
NM_022380 |
1.97 |
2.42E-05 |
- |
- |
SUFU |
Suppressor Of Fused Homolog |
NM_001024899 |
1.41 |
3.80E-04 |
1.27 |
3.80E-04 |
TGFB2 |
Transforming Growth Factor, Beta 2 |
NM_031131 |
- |
- |
-2.23 |
2.49E-04 |
TRAF4 |
TNF Receptor-Associated Factor 4 |
NM_001107017 |
-2.12 |
8.60E-06 |
-2.00 |
8.60E-06 |
WNT1 |
Wingless-Type MMTV Integration Site Family, Member 1 |
NM_001105714 |
1.41 |
2.93E-03 |
- |
- |
WNT6 |
Wingless-Type MMTV Integration Site Family, Member 6 |
NM_001108226 |
-1.59 |
6.07E-03 |
-1.35 |
6.07E-05 |
Gene expression analysis by qPCR using TaqMan low density array (TLDA)
Quantitative PCR studies were performed in B104, SH-SY5Y, Kelly and IMR32 cell lines to confront the microarray data obtained from B104 cell line. We specifically studied MYCN, MYBL2, BIRC5, BARD1 and AURKA, poor prognosis markers of neuroblastoma, and CCNA2 and CCNE1 genes, involved in general carcinogenesis.
MYCN non-amplified cell lines (B104, SH-SY5Y): Citalopram and escitalopram strongly down-regulated MYBL2, BIRC5, BARD1, AURKA, CCNA2 and CCNE1 in B104 cells and at a lesser extent but significantly in SH-SY5Y cells. In B104 cells sharp down-regulation of MYCN was observed after treatment with citalopram or escitalopram, whereas in SH-SY5Y cells the down-regulation was a tendency. E2F1, involved in glioma pathways, was strongly down-regulated in B104 cells; its modulation was not explored in human cell lines (Figure 5A 5B, Table 3).
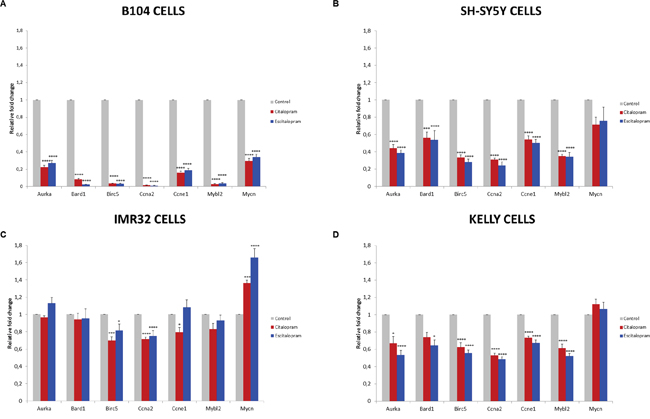
Figure 5: Fold change of representative genes after 24 h treatment with citalopram or escitalopram. B104 cells (A), SH-SY5Y cells (B), IMR32 cells (C) and Kelly cells (D). Duplicate values are normalized to 2 housekeeping gene expression and represented as fold induction compared with untreated cells set as 1. Results are expressed as means ± SEM, from 3 independent experiments (n=3). * p<0.05, *** p<0.005, ****p < 0.001.
Table 3: Fold changes of specific genes after treatment by citalopram or escitalopram
Gene symbol |
B104 |
SH-SY5Y |
KELLY |
IMR32 |
||||||||||||
|---|---|---|---|---|---|---|---|---|---|---|---|---|---|---|---|---|
Citalopram |
Escitalopram |
Citalopram |
Escitalopram |
Citalopram |
Escitalopram |
Citalopram |
Escitalopram |
|||||||||
AURKA |
-4,48 |
**** |
-3,69 |
**** |
-2,27 |
**** |
-2,59 |
**** |
-1,49 |
* |
-1,87 |
**** |
-1,03 |
1,13 |
||
BARD1 |
-12,23 |
**** |
-40,08 |
**** |
-1,78 |
*** |
-1,86 |
**** |
-1,35 |
-1,56 |
* |
-1,06 |
-1,05 |
|||
BIRC5 |
-28,34 |
**** |
-30,10 |
**** |
-2,97 |
**** |
-3,55 |
**** |
-1,60 |
**** |
-1,80 |
**** |
-1,43 |
*** |
-1,23 |
* |
CCNA2 |
-63,59 |
**** |
-85,11 |
**** |
-3,23 |
**** |
-4,08 |
**** |
-1,88 |
**** |
-2,05 |
**** |
-1,40 |
**** |
-1,33 |
**** |
CCNE1 |
-6,20 |
**** |
-5,35 |
**** |
-1,84 |
**** |
-1,99 |
**** |
-1,37 |
**** |
-1,49 |
**** |
-1,26 |
* |
1,08 |
|
MYBL2 |
-35,32 |
**** |
-29,35 |
**** |
-2,86 |
**** |
-2,92 |
**** |
-1,63 |
**** |
-1,92 |
**** |
-1,20 |
-1,07 |
||
MYCN |
-3,37 |
**** |
-2,92 |
**** |
-1,40 |
-1,32 |
1,12 |
1,07 |
1,36 |
*** |
1,66 |
**** |
||||
E2F1 |
-3,82 |
**** |
-3,60 |
**** |
ND |
ND |
ND |
ND |
ND |
ND |
||||||
ND: not determined; * p<0.05, *** p<0.005, ****p < 0.001.
MYCN amplified cell lines (Kelly, IMR32): In both cell lines BIRC5 and CCNA2 were significantly down-regulated by both molecules, the effect being more significant on Kelly than IMR32 cell line. The effect of citalopram tended to be more powerful on IMR32 than Kelly cell lines. MYCN was significantly up-regulated by escitalopram and at a lesser extent by citalopram in IMR32 cells, and not modulated by either molecules in Kelly cells. AURKA, MYBL2 and CCNE1 were significantly down-regulated by both molecules on Kelly cell line. AURKA and MYBL2 were not affected by the treatment in IMR32 cell line. In this latter cell line, CCNE1 was significantly down-regulated by citalopram only (Figure 5C, 5D, Table 3).
DISCUSSION
Neuroblastoma is a developmental malignancy considered as the most frequent extra-axial solid tumor in childhood. It develops from neuroblasts of the neural crest that give birth to the peripheral sympathetic system through a multistage process of maturation involving successive expression of transcriptional factors. Disruption at discrete times of the process may be triggered by distinct oncogenes. Gradual identification of these oncogenes such as MYCN provides prognostic markers and therapeutic targets [5]. In the last two decades improvement has been performed in the therapeutic management of neuroblastoma but little has been gained in term of outcome for multi-metastatic patients. For these patients there is an urgent need to develop new therapeutic approaches.
SSRI are well known antidepressants which cytotoxic effects have been assessed with promising results in several cancer cell lines, more particularly colorectal carcinomas [1, 2]. They were initially suspected to promote cancer by historical studies which originally demonstrated serotonin promoted cell proliferation in the jejunum epithelium of rat [7] and in dimethylhydrazine-induced adenocarcinoma [8]. Later on, these data were contradicted by experiments showing the suppression of cell proliferation and tumor growth by fluoxetine and citalopram in two rodent models of colorectal carcinomas [1]. Then SSRI were found to promote fibrosarcomas, melanomas and mammary carcinomas on rodent models [9, 10] while positive association between SSRI usage and breast cancer risk was observed in epidemiological surveys [11, 12]. More recently case-control studies provided contradictory data, notably a reduced risk of colorectal cancer associated with SSRI use [13, 14]. Since, potent anticancer properties of SSRI have been more specified and extended to other types of cancers such as fluoxetine, paroxetine and citalopram on Burkitt lymphoma [15], fluoxetine on ovarian carcinoma [16], lung, colon, neuroblastoma, medulloblastoma, rhabdomyosarcoma, astrocytoma and breast cancer cell lines [17], and escitalopram on glioma C6 cells [18]. Nevertheless, potent carcinogenetic properties of citalopram have never been totally disclaimed. In mice exposed to recommended human dosages, citalopram induced significant DNA-strand breaking and micronuclei formation and displayed aneugenic and clastogenic effects on somatic cells, hence predisposing to the development of secondary tumors [19].
Up to now, citalopram and escitalopram have never been assessed in the indication of neuroblastoma and their potent efficacies have never been compared. We first assessed the 2 molecules on the rat B104 cell line. Our results led us to complement the study on human cell lines. Cell lines without amplification of MYCN (SH-SY5Y) or with amplification of MYCN (IMR32, Kelly) were selected to explore whether the cytotoxicity was still exerted on cells with MYCN amplification, a marker of poor prognosis present in 20% of patients [5].
In this work we demonstrate for the first time a significant cytotoxic effect of both citalopram and escitalopram in 4 neuroblastoma cell lines. We show a quantitative and qualitative difference of effect between the 2 molecules, citalopram showing a greater cytotoxicity than escitalopram on all neuroblastoma cell lines. The human IMR32 was the cell line significantly the most sensitive to both citalopram and escitalopram, while the lack of cytotoxicity on primary human Schwann cells suggested the innocuity of citalopram and escitalopram on the myelin sheath of the peripheral nervous system.
The most prominent feature of neuroblastoma resides in its clinical heterogeneity, with a prognosis ranging from cases of spontaneous regression in infants to extensive, metastatic, lethal disease [20]. Genetic profiling of human histological specimens has shown this clinical heterogeneity was related to a considerable genetic diversity [21]. Nevertheless, systematic correlation of genetic features to patient outcomes led to define prognostic markers [22] that might favor/inhibit neuroblastoma tumorigenesis by disturbing the equilibrium between cell survival and senescence signaling pathways and constitute potential therapeutic targets such as MYCN oncogene. Citalopram and escitalopram were cytotoxic on both MYCN and non-MYCN amplified cell lines and more notably on IMR32. Nevertheless our results suggest their action might not depend only on MYCN expression, since MYCN was not modulated in Kelly cells and increased in IMR32 cells, the cell line the most sensitive to both molecules.
To better understand the mechanisms of their cytotoxicity, we studied how gene expression was modified by citalopram and escitalopram using microarray method on B104 cells. The two molecules were compared at the same concentration of 100 μM because above 100 μM citalopram was too toxic to enable gene profiling (only 34% of cell viability was observed at 125 μM). Citalopram showed a broader spectrum of action than escitalopram on gene expression, modulating the expression of 1 502 genes whereas escitalopram modulated the expression of 1 164 genes with a fold change ≥ 2. The 2 molecules exerted distinct spectrums of action: 481 genes were regulated only by citalopram while 143 genes were regulated only by escitalopram.
Our study was focused on the genes identified as prognosis markers and potential therapeutic targets of neuroblastoma [4, 5, 21, 23, 24]. Concerning poor prognosis factors, when gene expression was modulated by both citalopram and escitalopram, the action was always a decrease except for MDM2 and VEGFA. The action of citalopram was consistently more intense than escitalopram except for HRAS. The expression of 4 poor prognosis markers, MYBL2, BIRC5, BARD1 and AURKA were drastically decreased by both molecules using the microarray analysis. These data were confirmed by the qPCR analysis in rat B104, human SH-SY5Y and Kelly cell lines. In IMR32 cells, only BIRC5 was significantly down-regulated.
The sharp down-regulation of MYBL2 (B-MYB) by citalopram and escitalopram, as shown by the microarray method on B104 cells were confirmed by qPCR on SH-SY5Y and Kelly cell lines. These data may be crucial since MYBL2 over-expression, identified in advanced stages of neuroblastoma, confers a chemo-resistance to neuroblastoma cells [25, 26]. MYBL2 promotes cell proliferation and survival. Cell proliferation might be promoted in association with several factors involved in cell cycle pathways such as E2Fs and cyclin A2 [27, 28, 29]. Interestingly, E2F1 was strongly down-regulated by citalopram and escitalopram in B104 cells according to the microarray and qPCR analyses. CCNA2 was strongly down-regulated in all cell lines including IMR32 and Kelly overexpressing MYCN. The stimulation of cell survival by MYBL2 could be mediated by the activation of BCL2 [30, 31] which was not modulated by either molecule. MYBL2 and MYCN have been demonstrated to participate in a reciprocal regulatory loop [31, 32]. In microarray study of B104 cells MYCN was decreased at a lesser degree than MYBL2 by citalopram and escitalopram, but the p value was strongly significant (2.08 10-7). These modulations on B104 cells were confirmed by qPCR. The loop involving MYBL2 and MYCN might constitute a therapeutic target particularly for the 20% of aggressive neuroblastomas where amplification of MYCN is observed [32]. Inhibitors of MYCN transcriptional function have been designed [21]. They include compounds termed MYRAs (for MYC pathway Response Agents) that selectively target MYCN pathway [34] and inhibitors of MYCN expression by the use of antisense oligonucleotides [35, 36]. Surprisingly, TP53, a direct transcriptional target of MYCN in neuroblastoma [37], was not modulated by citalopram and escitalopram. In fact, mutational inactivation of TP53, rarely observed in neuroblastoma, has been identified only in relapsing tumors [38]. MDM2, another transcriptional target of MYCN and poor prognosis factor of neuroblastoma [38] was slightly but significantly (p<6.5 10-7) increased by the 2 molecules whereas CCNE1, transcriptional target of MYCN identified in stage 4 neuroblastoma [40, 41], was strongly down-regulated by citalopram and escitalopram in B104, SH-SY5Y and Kelly cell lines and by citalopram in IMR32 cell line.
In our study, we demonstrate a significant down-regulation of BIRC5 in the four neuroblastoma cell lines by qPCR analysis. Over-expression of BIRC5 has been associated with aggressive forms of neuroblastoma [42] and other several types of cancer [43]. Anti-apoptotic protein BIRC5 was recently shown to shift neuroblastoma cells from oxidative phosphorylation to anaerobic glycolysis, increasing their resistance to chemotherapy [44]. Promising results obtained by BIRC5 inhibitors in pancreatic cancers with complete remission of liver metastases [45] make BIRC5 a potential target of chemotherapy in neuroblastoma.
BARD1 was significantly down-regulated by citalopram and escitalopram in B104, SH-SY5Y and Kelly cell lines using qPCR analysis. Oncogenic action of BARD1 in neuroblastoma has been demonstrated to be exerted by stabilizing AURKA involved in aggressive neuroblastomas [46, 47]. AURKA was down-regulated by citalopram and escitalopram in B104, SH-SY5Y and Kelly cell lines using qPCR analysis. The kinase AURKA stabilizes MYCN [48, 49] and constitutes an interesting target for anticancer drug development. Inhibitors of AURKA are being assessed in clinical trials [50].
The analysis of signaling pathways involving the markers modulated by citalopram and escitalopram suggests the two enantiomer molecules have distinct biological properties. Citalopram has a broader spectrum of action than escitalopram. Some of their mechanisms of action might be distinct. Citalopram modulated 69 pathways and escitalopram 42 pathways. The 4 pathways most affected by the two molecules were identical but the number of genes modulated by citalopram was significantly greater than those modulated by escitalopram, 98 versus 78 in Pathways in Cancer. In addition, 10 signaling pathways were significantly differently modulated by citalopram and escitalopram. In the Pathway Glioma 5 genes were differently modulated by citalopram and escitalopram but only with a p-value of 0.04.
We analyzed the markers of glioma modulated by the molecules. Cytotoxicity of SSRI has been formerly studied in vitro on several models of glioma. In a glioma C6 cell line fluoxetine and paroxetine were previously proved to induce apoptosis [51]. On the same model, escitalopram was showed to induce apoptotic activity at roughly the same dosages as in our study [18]. The mechanisms underlying this cytotoxicity remain partially understood. Using our model of a neuroblastoma cell line exposed to citalopram or escitalopram, the study of gene expression involved in the KEGG Glioma pathways provided mixed results. Interestingly E2F1 and the key component of the pRb/E2F1 pathway CCND1 were down-regulated by both citalopram and escitalopram. While the position of E2F1 as a prognosis marker of glioma is debated [52, 53], abnormalities of the p16/pRb/E2F pathway with over-expression of E2F are present in most of gliomas and suggest E2F1 as a potential therapeutic target [54]. Interestingly, CDK6 and IGF1 were down-regulated only by citalopram. Up-regulation of CDK6 might be correlated with the malignancy of glioma, promoting both its proliferative and invasive capabilities [55, 56]. In addition CDK6 activates transcription factor E2F1/2 that might activate several drug-resistant genes which are up-regulated in glioma cells [57, 58]. These data have suggested CDK6 might constitute a therapeutic target for malignant gliomas. In vitro, inhibitors of CDK6 have been shown to enhance the sensitivity to chemotherapy on glioma cell lines [56]. They induce cell-cycle arrest and senescence in human neuroblastoma cell lines [59]. Two genes contributing to the malignant progression of various cancer types notably gliomas WHO grade II–IV, IL6 and STAT3, were modulated by either molecules [60]. IL6 was up-regulated by citalopram while STAT3 was up-regulated by escitalopram. In human neuroblastoma cell lines STAT3 mediates the inhibition of apoptosis by IL-6 and the up-regulation of BIRC5 and BCL2L1 by IL-6 two actions probably involved in the drug resistance of some human neuroblastomas [61]. These data show mixed effects of citalopram and escitalopram on gliomas that should require gene profile exploration on relevant cell lines.
In this study we demonstrate a cytotoxic effect of citalopram and escitalopram on 4 neuroblastoma cell lines and their innocuity on primary human Schwann cells. The 2 molecules were active on both MYCN and non-MYCN amplified cell lines. The effect of citalopram was significantly more powerful than escitalopram on all neuroblastoma cell lines. To better understand their mechanisms of cytotoxicity, we studied the modification of gene expression induced by citalopram and escitalopram using microarray hybridization and qPCR. Citalopram was consistently more powerful on gene modulation with a broader spectrum of action on signaling pathways than escitalopram.
MATERIALS AND METHODS
Cytotoxicity assay
Cytotoxicity of citalopram and escitalopram was assessed on a rat B104 neuroblastoma cell line, SH-SY5Y, IMR32 and Kelly human neuroblastoma cell lines and a primary human Schwann cell culture (HSC).
Chemical compounds: Stock solutions of 10 mM citalopram (Sigma-Aldrich, Saint-Quentin-Fallavier, France; PubChem CID: 77995) and 50 mM escitalopram (Sigma-Aldrich, Saint-Quentin-Fallavier, France; PubChem CID: 146571) were prepared in distilled water. Dilutions of citalopram and escitalopram were made just prior to each experiment.
Cell culture: Rat B104 neuroblastoma cells (ICLC, Genova, Italy) and human SH-SY5Y neuroblastoma cells (ECACC, Salisbury, UK) were cultured in Dulbecco’s Modified Eagle’s Medium (DMEM) (Thermo Fisher Scientific, USA) supplemented with 2 mM glutamine, 100 U/ml penicillin, 100 μg/ml streptomycin and 10% fetal bovine serum (FBS) (Invitrogen) in a humidified atmosphere at 37°C with 5% CO2. Human IMR32 cells (ECACC, Salisbury, UK) were cultured in DMEM supplemented with 2 mM glutamine, 100 U/ml penicillin, 100 μg/ml streptomycin, 1% non-essential amino-acids (Invitrogen) and 10% FBS in a humidified atmosphere at 37°C with 5% CO2. Human Kelly cells (ECACC, Salisbury, UK) were cultured in RPMI (Invitrogen) supplemented with 2 mM glutamine, 100 U/ml penicillin, 100 μg/ml streptomycin and 10% fetal bovine serum (FBS) (Invitrogen) in a humidified atmosphere at 37°C with 5% CO2. HSCs isolated from human spinal nerves (ScienCell Research Laboratories, USA) were cultured on poly-L-lysine coated flasks in Schwann Cell Medium (ScienCell Research Laboratories, USA). Passage numbers were P5 for B104 cells, P19 for SH-SY5Y cells, P68 for IMR32 cells, P3 for Kelly cells and P3 for HSCs. The medium of all cell cultures was changed every 3 days.
Cell treatment: All neuroblastoma cell lines were plated onto poly-D-lysine-coated 96-well plates at a final density of 20 000 cells/well in complete medium. HSCs were plated onto poly-L-Lysine-coated plates at the same seeding density as neuroblastoma cells in Schwann Cell Medium. Treatment was administered 29 h after seeding. Five hours after seeding B104 cells were deprived of serum for 24 h and treated for 24 h with 100 μl/well of citalopram (50, 100, 125, 150 μM) or escitalopram (100, 125, 150, 175 μM) without serum. SH-SY5Y cells were treated for 24 h with 100 μl/well of citalopram (25, 50, 100, 125 μM) or escitalopram (25, 50, 100, 125, 150 μM) in presence of 3% FBS. IMR32 cells were treated for 24 h with 100 μl/well of citalopram (25, 50, 100, 125 μM) or escitalopram (25, 50, 100, 125, 150 μM) in presence of 3% FBS. Kelly cells were treated for 24 h with 100 μl/well of citalopram (25, 50, 100, 125, 150 μM) or escitalopram (25, 50, 100, 125, 150, 175 μM) in presence of 3% FBS. HSCs were treated for 24 h with 100 μl/well of citalopram (50, 100, 125, 150 μM) or escitalopram (50, 100, 125, 150, 175 μM) in Schwann Cell Medium.
Neutral red assay: Cell viability was evaluated using the neutral red uptake assay (Sigma-Aldrich, Saint-Quentin-Fallavier, France) after 24 h of treatment. The neutral red uptake assay is based on the ability of viable cells to incorporate and bind the neutral red dye within lysosomes [6]. Quadruplicate wells were used for each condition, and each experiment was repeated 3 to 4 times. Briefly, following exposure to treatments, cells were incubated for 2 h 30 with neutral red (40 μg/ml) dissolved in DMEM for B104, SH-SY5Y and IMR32 cells, in RPMI for Kelly cells and in Schwann Cell Medium for HSCs. After neutral red uptake cells were washed with Phosphate Buffered Saline (PBS). Incorporated dye was extracted from the cells by the addition of 150 μl/well of 1% acetic acid solution containing 50% ethanol. The plate was rapidly shaken for at least 10 min, or until the neutral red has been extracted from the cells. Absorbance was spectrophotometrically measured at 540 nm using the Multiskan Spectrum microplate reader (Thermo Scientific, Illkrich, France) with a background absorbance without cells as a blank. Cell viability of untreated cells was set to 100%. Treated cell viability was expressed as a ratio to untreated cell viability.
Statistics: Results were expressed as means ± SEM of 3-4 experiments. Statistical significance between sets of data was determined by ANOVA followed by the Dunnett post-hoc test. Differences were considered as statistically significant when p<0.05.
RNA extraction
B104, SH-SY5Y, Kelly and IMR32 cells were seeded into 25 cm2 flasks at a density of 62 500 cells/cm2. B104 and Kelly cells were exposed to 100 μM citalopram or escitalopram for 24 h. IMR32 and SH-SY5Y were exposed to 75 μM citalopram or escitalopram for 24 h. Total RNA was extracted using the RNeasy Plus Mini Kit (Qiagen, Courtaboeuf, France) following the manufacturer’s protocol. RNA quantity and purity (260/280 > 1.8) were determined using NanoDrop ND-1000 spectrophotometer (Thermo Scientific, Illkrich, France). RNA integrity was determined using Agilent 2100 Bioanalyzer and RNA 6000 Nano Kit (Agilent Technologies, Waldbronn, Germany). Only RNA samples with a RIN number > 8.0 were used for microarray analysis and qPCR analysis.
Microarray analysis
Gene-expression profile was performed with RNA extracted from the B104 neuroblastoma cell line. Each experimental condition (treatment by citalopram, escitalopram and control) was performed in duplicates.
Sample labeling and microarray hybridization: Total RNA from B104 cells was reverse transcribed and the cRNA was labeled using Agilent Low Input Quick Amp Labeling Kit One-color (Agilent Technologies) following the manufacturer’s protocol (One-color Microarray-Based Gene Expression Analysis v6.9). A hundred and fifty nanograms of each total RNA sample were used for linear T7-based amplification step and incorporation of cyanine 3-CTP for the production of Cy3-labeled cRNA. Labeled cRNA was purified using the RNeasy Mini kit (Qiagen) and quantified using NanoDrop ND-1000 spectrophotometer (Thermo Scientific, Illkrich, France). Only labeled cRNA samples with cRNA yields > 0.825 ng and specific activity > 6 pmol Cy3 per μg cRNA were selected for hybridization. Labeled cRNA quality (broad band size from 200 to 2000 nucleotides) was checked using Agilent 2100 Bioanalyzer with RNA 6000 Nano kit (Agilent Technologies, Waldbronn, Germany). Fragmentation and hybridization mixes were prepared using the Agilent Gene Expression Hybridization kit (Agilent Technologies). Subsequently, 600 ng Cy3-fragmented cRNA in hybridization buffer were hybridized 17 h at 65°C to SurePrint G3 Rat Gene Expression 8x60K microarray (Agilent Technologies Design ID 028279). Slides were washed with Agilent Gene Expression Wash Buffer I for 1 minute at room temperature followed by a second wash with Agilent Gene Expression Wash Buffer II for 1 minute at 37°C. Fluorescence signals of hybridized microarrays were detected at 3 μm resolution using the Microarray Scanner System G2505C (Agilent Technologies).
Data collection and processing: Raw data were extracted from scanned array images using Agilent Feature Extraction 11.5 software. Data were then analyzed using GeneSpring GX 12.0 software (Agilent Technologies). The raw signals were log transformed and normalized using percentile shift normalization method, the value was set at 75th percentile. For each probe, the median of the log summarized values from all the samples was calculated and subtracted from each of the samples to get transformed baseline. After normalization, probes were filtered according to quality flags set by the Agilent Feature Extraction software. Descriptive analysis was performed with GeneSpring GX 12.0: principal component analysis, box plots, unsupervised hierarchical clustering by Pearson's distance measure on average linkage. Gene significance was performed to determine differentially expressed genes through ANOVA (more than two groups) or unpaired t-test using the following parameters: p < 0.05, Benjamini-Hochberg false discovery rate as multiple testing correction, and SNK as a post-hoc test for ANOVA.
Analysis of differentially expressed genes: Bioinformatic analysis for enriched terms was performed using WEB-based Gene Set Analysis Toolkit (WebGestalt; http://www.webgestalt.org/) which performs a hypergeometric test for the enrichment of gene ontology (GO) terms and Kyoto Encyclopedia of Genes and Genomes (KEGG pathways) in the selected genes, followed by the Benjamini-Hochberg (BH) method for multiple test adjustment (adjP).
Gene expression analysis by qPCR using TaqMan low density array (TLDA)
To confirm the results of microarray analyses we performed qPCR on RNA isolated from 3 independent cultures of untreated and citalopram or escitalopram-treated B104, SH-SY5Y, IMR32 and Kelly cells. Briefly, only RNA samples with a RIN number > 8.0 were used. From total RNA, 0.5 μg were reverse transcribed in a total volume of 20 μl using a High Capacity cDNA reverse transcription Kit (Life Technologies, Carlsbad, CA, USA). qPCR analysis was performed using custom designed arrays in the 384-well microfluidic cards TaqMan® Low Density Array (Life Technologies, Carlsbad, CA, USA). Each well contained specific, user-defined primers and 6-FAM (carboxyfluorescein) labeled TaqMan dihydrocyclopyrroloindole tripeptide Minor Groove Binder (MGB) probes to detect single genes. The card was configured into 3 identical sets of 23 genes including 2 housekeeping genes determined by TaqMan® Rat and Human Endogenous Control Arrays using geNorm algorithm: PPIA and PGK1 for B104, 18S and POLR2A for SH-SY5Y, IPO8 and POLR2A for Kelly and IPO8 and 18S for IMR32 cells. Eight samples per card were processed in duplicate. A total of 100 μl reaction mixtures with 50 μl (100 ng) cDNA templates and an equal volume of TaqMan® universal master mix (Life Technologies, USA) was added to each line of microfluidic card after gentle vortex mixing. The array was centrifuged twice at 331 g for 1 min to distribute the samples from the loading port into each well. The card was then sealed and run on Applied Biosystems Prism 7900HT sequence detection system (Thermo Fisher Scientific, USA) according to recommended thermal cycling conditions. The threshold cycle (Ct) was automatically given by SDS v2.2 software package (Thermo Fisher Scientific, USA). Relative quantities (RQ) were determined using the equation: RQ = 2-ΔΔCt. Expression levels of genes of interest were normalized to the average expression level of housekeeping genes from the same sample. Gene relative expression was defined as the ratio of gene expression to that of the housekeeping genes. Fold changes were defined as the ratio of gene relative expression in treated cells to that in untreated cells. The data presented are given as the mean of the fold changes (n=3 per treatment) ± standard error mean (SEM). Statistical significance between sets of data was determined by ANOVA followed by the Dunnett post-hoc test. Differences were considered as statistically significant when p<0.05.
CONFLICTS OF INTEREST
The authors declare no conflicts of interest.
REFERENCES
1. Tutton PJ, Barkla DH. Influence of inhibitors of serotonin uptake on intestinal epithelium and colorectal carcinomas. Br J Cancer. 1982; 46:260–65.
2. van Noort V, Schölch S, Iskar M, Zeller G, Ostertag K, Schweitzer C, Werner K, Weitz J, Koch M, Bork P. Novel drug candidates for the treatment of metastatic colorectal cancer through global inverse gene-expression profiling. Cancer Res. 2014; 74:5690–99.
3. Gurney JG, Ross JA, Wall DA, Bleyer WA, Severson RK, Robison LL. Infant cancer in the U.S.: histology-specific incidence and trends, 1973 to 1992. J Pediatr Hematol Oncol. 1997; 19:428–32.
4. Megison ML, Gillory LA, Beierle EA. Cell survival signaling in neuroblastoma. Anticancer Agents Med Chem. 2013; 13:563–75.
5. Louis CU, Shohet JM. Neuroblastoma: molecular pathogenesis and therapy. Annu Rev Med. 2015; 66:49–63.
6. Repetto G, del Peso A, Zurita JL. Neutral red uptake assay for the estimation of cell viability/cytotoxicity. Nat Protoc. 2008; 3:1125–31.
7. Tutton PJ. The influence of serotonin on crypt cell proliferation in the jejunum of rat. Virchows Arch B Cell Pathol Incl Mol Pathol. 1974; 16:79–87.
8. Tutton PJ, Barkla DH. Cell proliferation in the descending colon of dimethylhydrazine treated rats and in dimethylhydrazine induced adenocarcinomata. Virchows Arch B Cell Pathol. 1976; 21:147–60.
9. Brandes LJ, Arron RJ, Bogdanovic RP, Tong J, Zaborniak CL, Hogg GR, Warrington RC, Fang W, LaBella FS. Stimulation of malignant growth in rodents by antidepressant drugs at clinically relevant doses. Cancer Res. 1992; 52:3796–800.
10. Hilakivi-Clarke L, Wright A, Lippman ME. DMBA-induced mammary tumor growth in rats exhibiting increased or decreased ability to cope with stress due to early postnatal handling or antidepressant treatment. Physiol Behav. 1993; 54:229–36.
11. Moorman PG, Grubber JM, Millikan RC, Newman B. Antidepressant medications and their association with invasive breast cancer and carcinoma in situ of the breast. Epidemiology. 2003; 14:307–14.
12. Steingart A, Cotterchio M, Kreiger N, Sloan M. Antidepressant medication use and breast cancer risk: a case-control study. Int J Epidemiol. 2003; 32:961–66.
13. Xu W, Tamim H, Shapiro S, Stang MR, Collet JP. Use of antidepressants and risk of colorectal cancer: a nested case-control study. Lancet Oncol. 2006; 7:301–08.
14. Chubak J, Boudreau DM, Rulyak SJ, Mandelson MT. Colorectal cancer risk in relation to antidepressant medication use. Int J Cancer. 2011; 128:227–32.
15. Serafeim A, Holder MJ, Grafton G, Chamba A, Drayson MT, Luong QT, Bunce CM, Gregory CD, Barnes NM, Gordon J. Selective serotonin reuptake inhibitors directly signal for apoptosis in biopsy-like Burkitt lymphoma cells. Blood. 2003; 101:3212–19.
16. Lee CS, Kim YJ, Jang ER, Kim W, Myung SC. Fluoxetine induces apoptosis in ovarian carcinoma cell line OVCAR-3 through reactive oxygen species-dependent activation of nuclear factor-kappaB. Basic Clin Pharmacol Toxicol. 2010; 106:446–53.
17. Stepulak A, Rzeski W, Sifringer M, Brocke K, Gratopp A, Kupisz K, Turski L, Ikonomidou C. Fluoxetine inhibits the extracellular signal regulated kinase pathway and suppresses growth of cancer cells. Cancer Biol Ther. 2008; 7:1685–93.
18. Dikmen M, Cantürk Z, Oztürk Y. Escitalopram oxalate, a selective serotonin reuptake inhibitor, exhibits cytotoxic and apoptotic effects in glioma C6 cells. Acta Neuropsychiatr. 2011; 23:173–78.
19. Attia SM, Ashour AE, Bakheet SA. Comet-FISH studies for evaluation of genetic damage of citalopram in somatic cells of the mouse. J Appl Toxicol. 2013; 33:901–05.
20. Brodeur GM. Neuroblastoma: biological insights into a clinical enigma. Nat Rev Cancer. 2003; 3:203–16.
21. Van Roy N, De Preter K, Hoebeeck J, Van Maerken T, Pattyn F, Mestdagh P, Vermeulen J, Vandesompele J, Speleman F. The emerging molecular pathogenesis of neuroblastoma: implications for improved risk assessment and targeted therapy. Genome Med. 2009; 1:74.
22. Hiyama E, Hiyama K, Yamaoka H, Sueda T, Reynolds CP, Yokoyama T. Expression profiling of favorable and unfavorable neuroblastomas. Pediatr Surg Int. 2004; 20:33–38.
23. Pinto NR, Applebaum MA, Volchenboum SL, Matthay KK, London WB, Ambros PF, Nakagawara A, Berthold F, Schleiermacher G, Park JR, Valteau-Couanet D, Pearson AD, Cohn SL. Advances in Risk Classification and Treatment Strategies for Neuroblastoma. J Clin Oncol. 2015; 33:3008–17.
24. Brodeur GM, Iyer R, Croucher JL, Zhuang T, Higashi M, Kolla V. Therapeutic targets for neuroblastomas. Expert Opin Ther Targets. 2014; 18:277–92.
25. Cervellera M, Raschella G, Santilli G, Tanno B, Ventura A, Mancini C, Sevignani C, Calabretta B, Sala A. Direct transactivation of the anti-apoptotic gene apolipoprotein J (clusterin) by B-MYB. J Biol Chem. 2000; 275:21055–60.
26. Raschellà G, Cesi V, Amendola R, Negroni A, Tanno B, Altavista P, Tonini GP, De Bernardi B, Calabretta B. Expression of B-myb in neuroblastoma tumors is a poor prognostic factor independent from MYCN amplification. Cancer Res. 1999; 59:3365–68.
27. Okada M, Akimaru H, Hou DX, Takahashi T, Ishii S. Myb controls G(2)/M progression by inducing cyclin B expression in the Drosophila eye imaginal disc. EMBO J. 2002; 21:675–84.
28. Sala A, Calabretta B. Regulation of BALB/c 3T3 fibroblast proliferation by B-myb is accompanied by selective activation of cdc2 and cyclin D1 expression. Proc Natl Acad Sci USA. 1992; 89:10415–19.
29. Zhu W, Giangrande PH, Nevins JR. E2Fs link the control of G1/S and G2/M transcription. EMBO J. 2004; 23:4615–26.
30. Willis S, Day CL, Hinds MG, Huang DC. The Bcl-2-regulated apoptotic pathway. J Cell Sci. 2003; 116:4053–56.
31. Gualdrini F, Corvetta D, Cantilena S, Chayka O, Tanno B, Raschellà G, Sala A. Addiction of MYCN amplified tumours to B-MYB underscores a reciprocal regulatory loop. Oncotarget. 2010; 1:278–88. doi: 10.18632/oncotarget.100808.
32. Sottile F, Gnemmi I, Cantilena S, D’Acunto WC, Sala A. A chemical screen identifies the chemotherapeutic drug topotecan as a specific inhibitor of the B-MYB/MYCN axis in neuroblastoma. Oncotarget. 2012; 3:535–45. doi: 10.18632/oncotarget.498.
33. Maris JM. Unholy matrimony: aurora A and N-Myc as malignant partners in neuroblastoma. Cancer Cell. 2009; 15:5–6.
34. Mo H, Vita M, Crespin M, Henriksson M. Myc overexpression enhances apoptosis induced by small molecules. Cell Cycle. 2006; 5:2191–94.
35. Burkhart CA, Cheng AJ, Madafiglio J, Kavallaris M, Mili M, Marshall GM, Weiss WA, Khachigian LM, Norris MD, Haber M. Effects of MYCN antisense oligonucleotide administration on tumorigenesis in a murine model of neuroblastoma. J Natl Cancer Inst. 2003; 95:1394–403.
36. Negroni A, Scarpa S, Romeo A, Ferrari S, Modesti A, Raschellà G. Decrease of proliferation rate and induction of differentiation by a MYCN antisense DNA oligomer in a human neuroblastoma cell line. Cell Growth Differ. 1991; 2:511–18.
37. Chen L, Iraci N, Gherardi S, Gamble LD, Wood KM, Perini G, Lunec J, Tweddle DA. p53 is a direct transcriptional target of MYCN in neuroblastoma. Cancer Res. 2010; 70:1377–88.
38. Vogan K, Bernstein M, Leclerc JM, Brisson L, Brossard J, Brodeur GM, Pelletier J, Gros P. Absence of p53 gene mutations in primary neuroblastomas. Cancer Res. 1993; 53:5269–73.
39. Slack A, Chen Z, Tonelli R, Pule M, Hunt L, Pession A, Shohet JM. The p53 regulatory gene MDM2 is a direct transcriptional target of MYCN in neuroblastoma. Proc Natl Acad Sci USA. 2005; 102:731–36.
40. Mao L, Ding J, Perdue A, Yang L, Zha Y, Ren M, Huang S, Cui H, Ding HF. Cyclin E1 is a common target of BMI1 and MYCN and a prognostic marker for neuroblastoma progression. Oncogene. 2012; 31:3785–95.
41. Oberthuer A, Berthold F, Warnat P, Hero B, Kahlert Y, Spitz R, Ernestus K, König R, Haas S, Eils R, Schwab M, Brors B, Westermann F, Fischer M. Customized oligonucleotide microarray gene expression-based classification of neuroblastoma patients outperforms current clinical risk stratification. J Clin Oncol. 2006; 24:5070–78.
42. Islam A, Kageyama H, Takada N, Kawamoto T, Takayasu H, Isogai E, Ohira M, Hashizume K, Kobayashi H, Kaneko Y, Nakagawara A. High expression of Survivin, mapped to 17q25, is significantly associated with poor prognostic factors and promotes cell survival in human neuroblastoma. Oncogene. 2000; 19:617–23.
43. Groner B, Weiss A. Targeting survivin in cancer: novel drug development approaches. BioDrugs. 2014; 28:27–39.
44. Hagenbuchner J, Kiechl-Kohlendorfer U, Obexer P, Ausserlechner MJ. BIRC5/Survivin as a target for glycolysis inhibition in high-stage neuroblastoma. Oncogene. 2016; 35:2052–61.
45. Wobser M, Keikavoussi P, Kunzmann V, Weininger M, Andersen MH, Becker JC. Complete remission of liver metastasis of pancreatic cancer under vaccination with a HLA-A2 restricted peptide derived from the universal tumor antigen survivin. Cancer Immunol Immunother. 2006; 55:1294–98.
46. Maris JM, Morton CL, Gorlick R, Kolb EA, Lock R, Carol H, Keir ST, Reynolds CP, Kang MH, Wu J, Smith MA, Houghton PJ. Initial testing of the aurora kinase A inhibitor MLN8237 by the Pediatric Preclinical Testing Program (PPTP). Pediatr Blood Cancer. 2010; 55:26–34.
47. Morozova O, Vojvodic M, Grinshtein N, Hansford LM, Blakely KM, Maslova A, Hirst M, Cezard T, Morin RD, Moore R, Smith KM, Miller F, Taylor P, et al. System-level analysis of neuroblastoma tumor-initiating cells implicates AURKB as a novel drug target for neuroblastoma. Clin Cancer Res. 2010; 16:4572–82.
48. Otto T, Horn S, Brockmann M, Eilers U, Schüttrumpf L, Popov N, Kenney AM, Schulte JH, Beijersbergen R, Christiansen H, Berwanger B, Eilers M. Stabilization of N-Myc is a critical function of Aurora A in human neuroblastoma. Cancer Cell. 2009; 15:67–78.
49. Schnepp RW, Khurana P, Attiyeh EF, Raman P, Chodosh SE, Oldridge DA, Gagliardi ME, Conkrite KL, Asgharzadeh S, Seeger RC, Madison BB, Rustgi AK, Maris JM, Diskin SJ. A LIN28B-RAN-AURKA Signaling Network Promotes Neuroblastoma Tumorigenesis. Cancer Cell. 2015; 28:599–609.
50. Mossé YP, Lipsitz E, Fox E, Teachey DT, Maris JM, Weigel B, Adamson PC, Ingle MA, Ahern CH, Blaney SM. Pediatric phase I trial and pharmacokinetic study of MLN8237, an investigational oral selective small-molecule inhibitor of Aurora kinase A: a Children’s Oncology Group Phase I Consortium study. Clin Cancer Res. 2012; 18:6058–64.
51. Levkovitz Y, Gil-Ad I, Zeldich E, Dayag M, Weizman A. Differential induction of apoptosis by antidepressants in glioma and neuroblastoma cell lines: evidence for p-c-Jun, cytochrome c, and caspase-3 involvement. J Mol Neurosci. 2005; 27:29–42.
52. Chakravarti A, Delaney MA, Noll E, Black PM, Loeffler JS, Muzikansky A, Dyson NJ. Prognostic and pathologic significance of quantitative protein expression profiling in human gliomas. Clin Cancer Res. 2001; 7:2387–95.
53. Alonso MM, Fueyo J, Shay JW, Aldape KD, Jiang H, Lee OH, Johnson DG, Xu J, Kondo Y, Kanzawa T, Kyo S, Bekele BN, Zhou X, et al. Expression of transcription factor E2F1 and telomerase in glioblastomas: mechanistic linkage and prognostic significance. J Natl Cancer Inst. 2005; 97:1589–600.
54. Alonso MM, Alemany R, Fueyo J, Gomez-Manzano C. E2F1 in gliomas: a paradigm of oncogene addiction. Cancer Lett. 2008; 263:157–63.
55. Weissenberger J, Loeffler S, Kappeler A, Kopf M, Lukes A, Afanasieva TA, Aguzzi A, Weis J. IL-6 is required for glioma development in a mouse model. Oncogene. 2004; 23:3308–16.
56. Li B, He H, Tao BB, Zhao ZY, Hu GH, Luo C, Chen JX, Ding XH, Sheng P, Dong Y, Zhang L, Lu YC. Knockdown of CDK6 enhances glioma sensitivity to chemotherapy. Oncol Rep. 2012; 28:909–14.
57. Johnson DG, Schwarz JK, Cress WD, Nevins JR. Expression of transcription factor E2F1 induces quiescent cells to enter S phase. Nature. 1993; 365:349–52.
58. Chen HZ, Tsai SY, Leone G. Emerging roles of E2Fs in cancer: an exit from cell cycle control. Nat Rev Cancer. 2009; 9:785–97.
59. Rader J, Russell MR, Hart LS, Nakazawa MS, Belcastro LT, Martinez D, Li Y, Carpenter EL, Attiyeh EF, Diskin SJ, Kim S, Parasuraman S, Caponigro G, et al. Dual CDK4/CDK6 inhibition induces cell-cycle arrest and senescence in neuroblastoma. Clin Cancer Res. 2013; 19:6173–82.
60. Liu Q, Li G, Li R, Shen J, He Q, Deng L, Zhang C, Zhang J. IL-6 promotion of glioblastoma cell invasion and angiogenesis in U251 and T98G cell lines. J Neurooncol. 2010; 100:165–76.
61. Ara T, Nakata R, Sheard MA, Shimada H, Buettner R, Groshen SG, Ji L, Yu H, Jove R, Seeger RC, DeClerck YA. Critical role of STAT3 in IL-6-mediated drug resistance in human neuroblastoma. Cancer Res. 2013; 73:3852–64.