
INTRODUCTION
Based on their therapeutic and chemical characteristics, drug compounds are classified into 14 main categories, or 14 main ATC (Anatomical Therapeutic Chemical) classes (see, e.g., http://www.whocc.no/atc/structure_and_principles/).
Given an uncharacterized compound, can we develop a computational method to identify which ATC class it belongs to? The information thus obtained will timely help adjusting our focus and selection, significantly speed up the drug development process.
In a pioneer work, Dunkel et al. [1] proposed a computational method to identify the ATC classes of drug compounds based on their structural fingerprint information. Three years later, Chen et al. [2] developed an improved method by using the information of chemical-chemical interactions and chemical-chemical similarities. Actually, the ATC classification is a multi-label system [3], in which a same drug compound may belong to two or more different classes. To effectively deal with the difficulty caused by the multi-label nature, recently Cheng et al. [4] proposed a powerful predictor called “iATC-mISF” by incorporating the informations of the chemical-chemical interaction, structural similarity, and fingerprintal similarity into the sample formulation.
As is known, mapping the protein samples into the GO (gene ontology) database space [5–11] could significantly enhance the quality of predicting protein subcellular localization. Particularly when the proteins investigated might belong to two or more subcellular locations, as demonstrated by many publications for various different organisms [12–23], where the PseAAC (pseudo amino acid composition) approach [24, 25] was also adopted as a backup. Inspired by the successes of gene ontology approach, Chen et al. [26] proposed a drug ontology method to predict the ATC classification. The corresponding improvement, however, was not as remarkable as in the case of protein subcellular location prediction.
The present study was initiated in an attempt to propose a new DO (Drug Ontology) method for predicting the ATC classes of drug compounds by being based on the ontology via the ChEBI (Chemical Entities of Biological Interest) database [27].
RESULTS AND DISCUSSION
A new predictor called iATC-mHyb has been established by hybridizing the iATC-mISF method [4] with the powerful iATC-mDO sub-predictor. The later is a newly constructed predictor with the DO approach via the ChEBI database. The reason to adopt such hybrid method is because (1) some drug compounds are not included in the current ChEBI database, and hence iATC-mDO cannot cover them although it is extremely powerful to those within the ChEBI database, and (2) the iATC-mISF had been the most powerful one among the existing ATC predictors [4].
Listed in Table 1 are the tested results by the new predictor iATC-mHyb on the benchmark dataset (see the section of MATERIALS AND METHODS later) via the most rigorous cross-validation method, the jackknife test [28, 29]. For facilitating comparison, listed in that table are also the corresponding results obtained by the iATC-mISF, the best one among the existing predictors for ATC classification. It can be seen from Table 1 that (1) the success rates obtained by the new predictor are all higher than those by iATC-mISF in “absolute true”, “accuracy”, “aiming”, and “coverage”, and that (2) the “absolute false” rate for the new predictor is almost 50% lower than that of the existing best predictor. As pointed out in a comprehensive review paper [3], among the aforementioned five metrics for the multi-label systems, the most important are “absolute true” and “absolute false”. It is extremely difficult to increase the absolute true rate and reduce the absolute false rate of a predictor for multi-label systems. Therefore, in reporting the results of their various prediction methods for multi-label systems, many investigators (see, e.g., [2, 12–17, 30–32] even did not mention the “absolute true” and “absolute false” rates. Actually, as pointed out by two recent papers [4, 33], the absolute true rates reported by most multi-label predictors (see, e.g. [23, 34]) were under 50%. In contrast to that, the 66.75% of absolute true achieved by the new predictor (Table 1) should be deemed a significantly improvement. Also, to our best knowledge, iATC-mHyb is the first multi-label predictor ever developed in biomedicine that can achieve lower than 3% of absolute false rate.
Table 1: The jackknife success rates achieved by iATC-mHyb and ATC-mISF on the benchmark dataset of Eq.1 (cf. Supporting Information S1)
Predictor |
Five metrics for multi-label systema |
||||
|---|---|---|---|---|---|
Aiming↑b |
Coverage↑b |
Accuracy↑b |
Absolute true↑b |
Absolute false↓c |
|
iATC-mISFd |
67.83% |
67.10% |
66.41% |
60.98% |
5.85% |
iATC-mHybe |
71.91% |
71.46% |
71.32% |
66.75% |
2.43% |
aSee Eq.12 for the definitions of the five metrics used to measure the prediction quality for multi-label systems [3].
bThe upper arrow means that the larger the rate the better the prediction quality is.
cThe down arrow means that the smaller the rate the better the prediction quality is.
dThe predictor proposed in [4].
eThe predictor proposed in the current paper.
The aforementioned facts have indicated that, significant improvement can be achieved as well by adopting the DO approach.
Moreover, with its development, the ChEBI database will cover more and more drug compounds, and the iATC-mDO will further enhance its power, and so will the iATC-mHyb predictor.
As pointed out in [35], the publicly accessible web-servers represent the new direction and trend for developing new predictors or computational tools [33, 36–58]. Actually, papers with a user-friendly and publicly accessible web-server will significantly enhance their impacts [59]. In view of this, the web-server for iATC-mHyb has been established at http://www.jci-bioinfo.cn/iATC-mHyb.
To maximize users’ convenience, a step-to-step guide of how to use the iATC-mHyb web-server is given below.
Step 1. Open the web-server at http://www.jci-bioinfo.cn/iATC-mHyb, the top page of iATC-mHyb will appear on the computer screen, as shown in Figure 1. Click on the Read Me button to see a brief introduction about the iATC-mHyb and the caveat when using it.
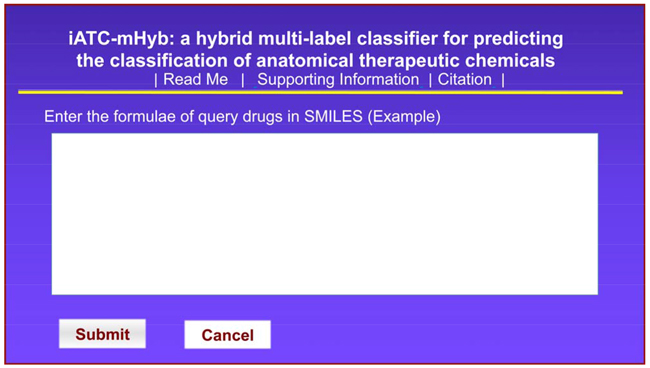
Figure 1: The semi-screenshot for the top page of the iATC-mHyb web-server, which is located at http://www.jci-bioinfo.cn/iATC-mHyb.
Step 2. Either type or copy/paste the formulae of query compounds into the input box at the center of Figure 1. The input compounds should be in the SMILES format. For the example of compounds in SMILES format, click the Example button right above the input box.
Step 3. Click on the Submit button to see the predicted result. For example, if using the formulae of the five compounds in the Example window as the input, one will see Figure 2 shown on the computer screen, indicating the following results. (1) Compound-1 belongs to three different ATC-classes; i.e., classes 3, 5 and 9, which are predicted by iATC-mDO subpredictor, meaning that the compound is covered by the ChEBI database. (2) Compound-2 belongs to only one ATC-class; i.e., class 3, which is predicted by iATC-mDO subpredictor, meaning the compound is covered by the ChEBI database. (3) Compound-3 belongs to four different ATC-classes; i.e., classes 3, 4, 10 and 12, which are predicted by iATC-mDO subpredictor, meaning that the compound is covered by the ChEBI database. (4) Compound-4 belongs to three different ATC-classes; i.e., classes 4, 5 and 13, which are predicted by iATC-mISF subpredictor, meaning that the compound is not covered by the ChEBI database. (5) Compound-5 belongs to two different ATC-classes; i.e., classes 4 and 12, which are predicted by iATC-mISF subpredictor, meaning that the compound is also not covered by the ChEBI database. All these results are fully consistent with the experimental observations.
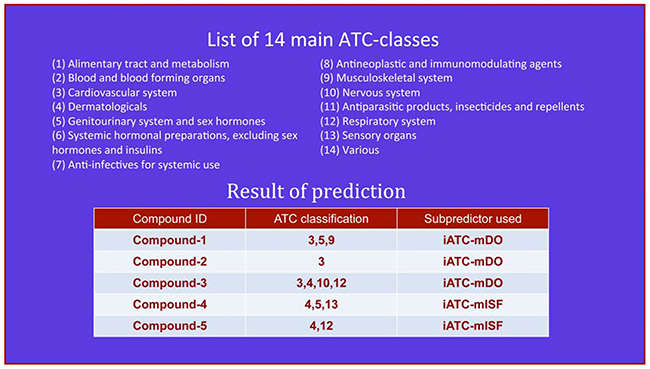
Figure 2: The semi-screenshot for the output generated by the Step 3 of users’ guide in the Results and Discussion section.
Step 4. Click on the Citation button to find the key relevant papers that have been used to document the detailed development and algorithm of iATC-mHyb.
Step 5. Click the Supporting Information button to download the all the “Supporting Information” files mentioned in this paper.
MATERIALS AND METHODS
As demonstrated in a series of recent method-developing studies [33, 45–49, 51–55, 57, 60–65], to establish a really useful statistical predictor for a drug system, according to the Chou's 5-step rule [66] we should make the following five steps very clear: (1) how to construct or select a valid benchmark dataset to train and test the predictor; (2) how to formulate the drug compound samples with an effective mathematical expression that can truly reflect their essential correlation with the target concerned; (3) how to introduce or develop a powerful algorithm (or engine) to run the prediction; (4) how to properly conduct cross-validation tests to objectively evaluate the anticipated accuracy; (5) how to provide a web-server and user guide to make users very easily to get their desired results. Below, let us to address these point-by-point.
Benchmark dataset
For facilitating comparison, in this study we used the same benchmark dataset (Supporting Information S1) as used in [2, 4]. It contains 3,883 drugs classified into the 14 main ATC-classes whose names in medicinal chemistry are given in Table 2. Thus, the benchmark dataset can be formulated as
Table 2: Breakdown of the 3,883 drug compounds in the benchmark dataset according to the 14 ATC classes (cf. Eq.1)
Subset |
Name |
Number of drugs |
|---|---|---|
Alimentary tract and metabolism |
540 |
|
Blood and blood forming organs |
133 |
|
Cardiovascular system |
591 |
|
Dermatologicals |
421 |
|
Genito-urinary system and sex hormones |
248 |
|
Systemic hormonal preparations, excluding sex hormones and insulins |
126 |
|
Antiinfectives for systemic use |
521 |
|
Antineoplastic and immunomodulating agents |
232 |
|
Musculo-skeletal system |
208 |
|
Nervous system |
737 |
|
Antiparasitic products, insecticides and repellents |
127 |
|
Respiratory system |
427 |
|
Sensory organs |
390 |
|
Various |
211 |
|
Number of total virtual drugs |
4,912a |
|
Number of total structural different drugs |
3,883b |
|
a The number of virtual drugs is counted as follows: for a structurally same drug, its contribution to the total number of virtual drugs is 2 if it occurs in two different ATC classes; that is 3 if it occurs in three different ATC classes; and so forth.
b Of the 3,883 structural different drugs, 3,295 belong to one class, 370 to two classes, 110 to three classes, 37 to four classes, 27 to five classes, and 44 to six classes. See Supporting Information S1 for the detailed drug codes listed in each of 14 ATC-classes.
where the subset only contains the samples from the m-th ATC class (m = 1,2,3,...,14), and ∪ denotes the symbol for “union” in the set theory. Listed in Table 2 is a breakdown of the benchmark dataset according to the 14 subsets in Eq.1.
As we can see from the table, among the 3,883 drugs, 3,295 occur in one class, 370 in two classes, 110 in three classes, 37 in four classes, 27 in five classes, 44 in six classes, and none occurs in more than six classes. For such a multi-label system, let us use a more intuitive method to describe the benchmark dataset as given in Supporting Information S2, where the symbol “1” under the title of “ATC classification” means the drug concerned occurs in the corresponding class, “0” means not.
Sample formulation
One of the keys in developing a powerful predictor is to formulate the samples with an effective mathematical expression that can truly reflect their intrinsic correlation with the target to be predicted [66]. In the previous paper [4], three different maximum score approaches were used to formulate the samples; they are (1) the interaction among the drug compounds concerned, (2) their structural similarity, and (3) their fingerprint similarity. Here, we are to address this problem by considering the maximum score in the DO (drug ontology) similarity; i.e., a sample in the benchmark dataset of Eq.1 is defined by
where T is the transposition operator, α1 stands for its maximum DO similarity score with the drugs in the subset , α2 for its maximum DO similarity score with the drugs in the subset , α3 for that in subset , and so forth. These DO similarity scores can be easily calculated [67, 68] from the ChEBI database [27] via KEGG [69].
Note that, of the 3,833 drug compounds in the benchmark dataset, only 1,144 can be found in the current ChEBI database (ftp://ftp.ebi.ac.uk/pub/databases/chebi/ontology/), and can be defined by Eq.2. For remaining (3,883 – 1,144) = 2,689 samples that are not included in the ChEBI, they will be expressed by the formulation in [4] and treated by the method described there. For clarity, let us use to denote the 1,144 samples that occur in the current ChEBI database. The 1,144 drug compounds in the subset are given in the Supporting Information S3.
Operation algorithm
In this study, the ML-GKR (multi-label Gaussian kernel regression) classifier has been adopted to predict the ATC-classes, as described below.
Suppose the i-th drug in the benchmark dataset can be formulated as
And its attribution in a multi-label system can be formulated as a vector Li given by
where
Likewise, for a query drug or compound, we have
Its attribution label vector in the ACT system is predicted as
where
The Δm in Eq.8 is given by
where θ is a parameter whose optimal value will be determined later, ||Dq – Di||2 is the Euclidean distance in the 14-D space (see Eq.2) between the query drug and the i-th drug of the benchmark dataset , as given by [28]
Thus, the attribution label vector Lq of Eq.7 for the query drug Dq is well defined, and hence its ATC class or classes can be explicitly predicted as well. For example: if while all the other components in Eq.7 are equal to −1, this means that the query drug belongs to the 1st, 2nd, and 14th ATC classes; if while all the others are equal to −1, meaning that the query drug belongs to the 3rd ATC class only; and so forth.
The predictor established via the aforementioned procedures is called iATC-mDO, where “i” means “identify”, “ATC” means “Anatomical Therapeutic Chemical” classification, “m” means “multiple” labels, and “DO” means “drug ontology”.
Hybridization with iATC-mISF
Question might be raised as asking how to deal with the remaining 2,689 compounds that are not included in the existing ChEBI database? Actually, similar question also existed in using GO (Gene Ontology) to predict the protein subcellular localization [5, 70], enzyme family classes [71, 72], analyzing protein pathway networks [73], and protein-protein interaction [74]. In those cases, the pseudo amino acid composition (PseAAC) approach [24, 25, 75] was applied to deal with those proteins without GO numbers. Likewise, we can also introduce a hybrid predictor for the ATC classification as given by
where “Hyb” means “hybridization” with the iATC-mISF predictor [4].
Test procedure
One of the important procedures [66] in developing a new prediction method is how to objectively evaluate its anticipated success rate [66]. To address this, we need to consider two issues. (1) What metrics should be used to quantitatively reflect the predictor’s quality? (2) What kind of test approach should be utilized to score the metrics?
A set of five metrics for multi-label systems
The metrics used to measure the prediction quality for multi-label systems are much more complicated than those for single-label systems. To make them more intuitive and easier to understand for most experimental scientists, the following five metrics were introduced by Chou [3]: (1) “aiming”, which is for checking the rate or percentage of the correctly predicted labels over the practically predicted labels; (2) “coverage”, for checking the rate of the correctly predicted labels over the actual labels in the system concerned; (3) “accuracy”, for checking the average ratio of correctly predicted labels over the total labels including correctly and incorrectly predicted labels as well as those real labels but are missed in the prediction; (4) “absolute true”, for checking the ratio of the perfectly or completely correct prediction events over the total prediction events; (5) “absolute false”, for checking the ratio of the completely wrong prediction over the total prediction events.
The aforementioned Chou’s five metrics can be formulated as [3]
Where N is the total number of the samples concerned, M is the total number of labels for the investigated system, means the operator acting on the set therein to count the number of its elements, ∪ means the symbol for the “union” in the set theory, ∩ denotes the symbol for the “intersection”, denotes the subset that contains all the labels observed by experiments for the k-th sample, represents the subset that contains all the labels predicted for the k-th sample, and
The above approach had been effectively used to study various multi-label systems, such as those in which a protein may occur in two or more different subcellular locations [18–23, 76], or an antimicrobial peptide may have two or more different types [34], or a membrane protein may have two or more different types [77].
Test by cross validation
Three cross-validation methods are often used in statistical prediction. They are: (1) independent dataset test, (2) subsampling (or K-fold cross-validation) test, and (3) jackknife test [28]. Of these three, however, the jackknife test is deemed the least arbitrary that can always yield a unique outcome for a given benchmark dataset as elucidated in [66]. Accordingly, the jackknife test has been widely recognized and increasingly used by investigators to examine the quality of various predictors (see, e.g., [11, 65, 78–90]). Accordingly, the jackknife test was also used in this study.
Parameter determination
Since Eq.9 contains a parameter θ, the predicted results obtained by iATC-mDO will depend on the parameter’s value. In this study, the optimal value for θ was determined by maximizing the absolute true rate (see the 4th sub-equation in Eq.12) by the jackknife validation on the benchmark dataset . As shown in Figure 3, when θ = 1/36, the absolute true rate reached its highest score. And such a value would be used for iATC-mDO predictor in further study.
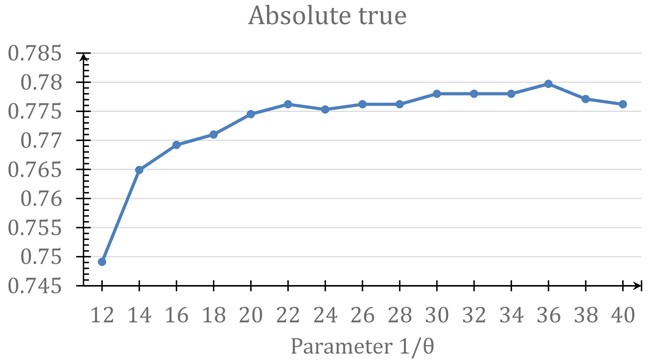
Figure 3: A plot to show the process of finding the optimal θ value in Eq.9. See the main text for further explanation.
CONCLUSION
A new method for predicting the ATC classes has been developed by hybridizing the drug ontology approach with the best existing ATC predictor. The new predictor has outperformed the best existing ATC predictor in all the five metrics used to examine the prediction quality of a predictor for multi-label systems, particularly in the “absolute true” rate and the “absolute false” rate, the two most difficult-to-improve indexes. To maximize the users’ convenience, a publically accessible web-server has been established at http://www.jci-bioinfo.cn/iATC-mHyb along with a step-by-step guide. Moreover, the MATLAB code for the new method is also available as in Supporting Information S4, which can be directly downloaded from the web-server.
CONFLICTS OF INTEREST
The authors declare no conflicts of interest.
ACKNOWLEDGMENTS
The authors wish to thank the four anonymous reviewers for their constructive comments, which were very useful for strengthening the presentation of this paper. This work was supported by the grants from the National Natural Science Foundation of China (No. 31560316, 61261027, 61462047), the Department of Education of JiangXi Province (GJJ160866), the Natural Science Foundation of Jiangxi Province, China (No. 20122BAB211033, 20122BAB201044, 20132BAB201053), the scholarship award of the State Scholarship Fund (No.201508360047), and the Graduated Innovation Fund of the Jingdezhen Ceramic Institute (JYC201521).
REFERENCES
1. Dunkel M, Günther S, Ahmed J, Wittig B, Preissner R. SuperPred: drug classification and target prediction. Nucleic Acids Res. 2008; 36:55-59.
2. Chen L, Zeng WM, Cai YD, Feng KY. Predicting Anatomical Therapeutic Chemical (ATC) classification of drugs by integrating chemical-chemical interactions and similarities. PLoS One. 2012; 7:e35254.
3. Chou KC. Some remarks on predicting multi-label attributes in molecular biosystems. Mol Biosyst. 2013; 9:1092-1100.
4. Cheng X, Zhao SG, Xiao X. iATC-mISF: a multi-label classifier for predicting the classes of anatomical therapeutic chemicals. Bioinformatics. 2016; 33:341-346.
5. Cai YD. A new hybrid approach to predict subcellular localization of proteins by incorporating gene ontology. Biochem Biophys Res Commun. 2003; 311:743-747.
6. Cai YD. Prediction of protein subcellular locations by GO-FunD-PseAA predicor. Biochem Biophys Res Commun. 2004; 320:1236-1239.
7. Shen HB. Predicting eukaryotic protein subcellular location by fusing optimized evidence-theoretic K-nearest neighbor classifiers. J Proteome Res. 2006; 5:1888-1897.
8. Shen HB. Predicting protein subcellular location by fusing multiple classifiers. J Cell Biochem. 2006; 99:517-527.
9. Chou KC, Shen HB. Large-scale predictions of Gram-negative bacterial protein subcellular locations. J Proteome Res. 2006; 5:3420-3428.
10. Shen HB. Large-scale plant protein subcellular location prediction. J Cell Biochem. 2007; 100:665-678.
11. Shen HB. Virus-PLoc: a fusion classifier for predicting the subcellular localization of viral proteins within host and virus-infected cells. Biopolymers. 2007; 85:233-240.
12. Shen HB. Euk-mPLoc: a fusion classifier for large-scale eukaryotic protein subcellular location prediction by incorporating multiple sites. J Proteome Res. 2007; 6:1728-1734.
13. Shen HB, Chou KC. Hum-mPLoc: an ensemble classifier for large-scale human protein subcellular location prediction by incorporating samples with multiple sites. Biochem Biophys Res Commun. 2007; 355:1006-1011.
14. Shen HB. A top-down approach to enhance the power of predicting human protein subcellular localization: Hum-mPLoc 2.0. Anal Biochem. 2009; 394: 269-274.
15. Chou KC, Shen HB. A new method for predicting the subcellular localization of eukaryotic proteins with both single and multiple sites: Euk-mPLoc 2.0. PLoS One. 2010; 5:e9931.
16. Shen HB. Plant-mPLoc: a top-down strategy to augment the power for predicting plant protein subcellular localization. PLoS One. 2010; 5: e11335.
17. Shen HB. Gneg-mPLoc: a top-down strategy to enhance the quality of predicting subcellular localization of Gram-negative bacterial proteins. J Theor Biol. 2010; 264:326-333.
18. Wu ZC, Xiao X. iLoc-Euk: a multi-label classifier for predicting the subcellular localization of singleplex and multiplex eukaryotic proteins. PLoS One. 2011; 6:e18258.
19. Wu ZC, Xiao X. iLoc-Plant: a multi-label classifier for predicting the subcellular localization of plant proteins with both single and multiple sites. Mol Biosyst. 2011; 7:3287-3297.
20. Xiao X, Wu ZC. iLoc-Virus: a multi-label learning classifier for identifying the subcellular localization of virus proteins with both single and multiple sites. J Theor Biol. 2011; 284:42-51.
21. Wu ZC, Xiao X. iLoc-Hum: using accumulation-label scale to predict subcellular locations of human proteins with both single and multiple sites. Mol Biosyst. 2012; 8:629-641.
22. Wu ZC, Xiao X. iLoc-Gpos: a multi-layer classifier for predicting the subcellular localization of singleplex and multiplex gram-positive bacterial proteins. Protein Pept Lett. 2012; 19:4-14.
23. Lin WZ, Fang JA, Xiao X. iLoc-Animal: a multi-label learning classifier for predicting subcellular localization of animal proteins. Mol Biosyst. 2013; 9:634-644.
24. Chou KC. Prediction of protein cellular attributes using pseudo amino acid composition. Proteins. 2001; 43:246-255.
25. Chou KC. Pseudo amino acid composition and its applications in bioinformatics, proteomics and system biology. Curr Proteomics. 2009; 6: 262-274.
26. Chen L, Lu J, Zhang N, Huang T, Cai YD. A hybrid method for prediction and repositioning of drug Anatomical Therapeutic Chemical classes. Mol Biosyst. 2014; 10:868-877.
27. Degtyarenko K, de Matos P, Ennis M, Hastings J, Zbinden M, McNaught A, Alcantara R, Darsow M, Guedj M, Ashburner M. ChEBI: a database and ontology for chemical entities of biological interest. Nucleic Acids Res. 2008; 36:D344-350.
28. Zhang CT. Review: prediction of protein structural classes. Crit Rev Biochem Mol Biol. 1995; 30:275-349.
29. Chou KC, Shen HB. Cell-PLoc 2.0: an improved package of web-servers for predicting subcellular localization of proteins in various organisms. Nat Sci. 2010; 2:1090-1103.
30. Shen HB. Gpos-mPLoc: a top-down approach to improve the quality of predicting subcellular localization of Gram-positive bacterial proteins. Protein Pept Lett. 2009; 16:1478-1484.
31. Shen HB. Virus-mPLoc: a fusion classifier for viral protein subcellular location prediction by incorporating multiple sites. J Biomol Struct Dyn. 2010; 28:175-186.
32. Chou KC, Shen HB. Cell-PLoc: a package of Web servers for predicting subcellular localization of proteins in various organisms (updated version: Cell-PLoc 2.0: an improved package of web-servers for predicting subcellular localization of proteins in various organisms. Nat Sci. 2010; 2:1090-1103) Nat Protoc. 2008; 3:153-162.
33. Qiu WR, Sun BQ, Xiao X. iPTM-mLys: identifying multiple lysine PTM sites and their different types. Bioinformatics. 2016; 32:3116-3123.
34. Xiao X, Wang P, Lin WZ, Jia JH. iAMP-2L: a two-level multi-label classifier for identifying antimicrobial peptides and their functional types. Anal Biochem. 2013; 436:168-177.
35. Shen HB. Review: recent advances in developing web-servers for predicting protein attributes. Nat Sci. 2009; 1:63-92
36. Chen W, Feng PM, Lin H. iRSpot-PseDNC: identify recombination spots with pseudo dinucleotide composition. Nucleic Acids Res. 2013; 41:e68.
37. Xu Y, Shao XJ, Wu LY. iSNO-AAPair: incorporating amino acid pairwise coupling into PseAAC for predicting cysteine S-nitrosylation sites in proteins. PeerJ. 2013; 1:e171.
38. Qiu WR, Xiao X. iRSpot-TNCPseAAC: identify recombination spots with trinucleotide composition and pseudo amino acid components. Int J Mol Sci. 2014; 15:1746-1766.
39. Lin H, Deng EZ, Ding H, Chen W. iPro54-PseKNC: a sequence-based predictor for identifying sigma-54 promoters in prokaryote with pseudo k-tuple nucleotide composition. Nucleic Acids Res. 2014; 42:12961-12972.
40. Liu B, Liu F, Wang X, Chen J. Pse-in-One: a web server for generating various modes of pseudo components of DNA, RNA, and protein sequences. Nucleic Acids Res. 2015; 43:W65-W71.
41. Chen W, Feng P, Ding H. iRNA-Methyl: identifying N6-methyladenosine sites using pseudo nucleotide composition. Anal Biochem. 2015; 490:26-33.
42. Jia J, Liu Z, Xiao X. iPPI-Esml: an ensemble classifier for identifying the interactions of proteins by incorporating their physicochemical properties and wavelet transforms into PseAAC. J Theor Biol. 2015; 377:47-56.
43. Liu B, Fang L, Wang S, Wang X. Identification of microRNA precursor with the degenerate K-tuple or Kmer strategy. J Theor Biol. 2015; 385:153-159.
44. Liu Z, Xiao X, Qiu WR. iDNA-Methyl: identifying DNA methylation sites via pseudo trinucleotide composition. Anal Biochem. 2015; 474:69-77.
45. Chen W, Tang H, Ye J. iRNA-PseU: identifying RNA pseudouridine sites. Mol Ther Nucleic Acids. 2016; 5:e332.
46. Jia J, Liu Z, Xiao X, Liu B. iSuc-PseOpt: identifying lysine succinylation sites in proteins by incorporating sequence-coupling effects into pseudo components and optimizing imbalanced training dataset. Anal Biochem. 2016; 497:48-56.
47. Jia J, Liu Z, Xiao X. pSuc-Lys: predict lysine succinylation sites in proteins with PseAAC and ensemble random forest approach. J Theor Biol. 2016; 394:223-230.
48. Jia J, Zhang L, Liu Z, Xiao X. pSumo-CD: predicting sumoylation sites in proteins with covariance discriminant algorithm by incorporating sequence-coupled effects into general PseAAC. Bioinformatics. 2016; 32:3133-3141.
49. Liu Z, Xiao X, Yu DJ, Jia J. pRNAm-PC: predicting N-methyladenosine sites in RNA sequences via physical-chemical properties. Anal Biochem. 2016; 497:60-67.
50. Liu B, Wang S, Long R. iRSpot-EL: identify recombination spots with an ensemble learning approach. Bioinformatics. 2017; 33:35-41.
51. Chen W, Ding H, Feng P. iACP: a sequence-based tool for identifying anticancer peptides. Oncotarget. 2016; 7:16895-16909. doi: 10.18632/oncotarget.7815.
52. Jia J, Liu Z, Xiao X, Liu B. iCar-PseCp: identify carbonylation sites in proteins by Monto Carlo sampling and incorporating sequence coupled effects into general PseAAC. Oncotarget. 2016; 7:34558-34570. doi: 10.18632/oncotarget.9148.
53. Qiu WR, Sun BQ, Xiao X. iHyd-PseCp: identify hydroxyproline and hydroxylysine in proteins by incorporating sequence-coupled effects into general PseAAC. Oncotarget. 2016; 7:44310-44321. doi: 10.18632/oncotarget.10027.
54. Qiu WR, Xiao X, Xu ZH, Chou KC. iPhos-PseEn: identifying phosphorylation sites in proteins by fusing different pseudo components into an ensemble classifier. Oncotarget. 2016; 7:51270-51283. doi: 10.18632/oncotarget.9987.
55. Xiao X, Ye HX, Liu Z, Jia JH. iROS-gPseKNC: predicting replication origin sites in DNA by incorporating dinucleotide position-specific propensity into general pseudo nucleotide composition. Oncotarget. 2016; 7:34180-34189. doi: 10.18632/oncotarget.9057.
56. Zhang CJ, Tang H, Li WC, Lin H. iOri-Human: identify human origin of replication by incorporating dinucleotide physicochemical properties into pseudo nucleotide composition. Oncotarget. 2016; 7:69783-69793. doi: 10.18632/oncotarget.11975.
57. Chen W, Feng P, Yang H, Ding H. iRNA-AI: identifying the adenosine to inosine editing sites in RNA sequences. Oncotarget. 2017; 8:4208-4217. doi: 10.18632/oncotarget.13758.
58. Liu B, Wu H, Zhang D, Wang X. Pse-Analysis: a python package for DNA/RNA and protein/peptide sequence analysis based on pseudo components and kernel methods. Oncotarget. 2017; 8:4208-4217. doi: 10.18632/oncotarget.14524.
59. Chou KC. Impacts of bioinformatics to medicinal chemistry. Med Chem. 2015; 11:218-234.
60. Chen J, Long R, Wang XL. dRHP-PseRA: detecting remote homology proteins using profile-based pseudo protein sequence and rank aggregation. Sci Rep. 2016; 6:32333.
61. Liu B, Fang L, Long R, Lan X. iEnhancer-2L: a two-layer predictor for identifying enhancers and their strength by pseudo k-tuple nucleotide composition. Bioinformatics. 2016; 32:362-369.
62. Liu B, Long R. iDHS-EL: identifying DNase I hypersensi-tivesites by fusing three different modes of pseudo nucleotide composition into an en-semble learning framework. Bioinformatics. 2016; 32:2411-2418.
63. Chen W, Feng P, Ding H. Using deformation energy to analyze nucleosome positioning in genomes. Genomics. 2016; 107:69-75.
64. Meher PK, Sahu TK, Saini V, Rao AR. Predicting antimicrobial peptides with improved accuracy by incorporating the compositional, physico-chemical and structural features into Chou’s general PseAAC. Sci Rep. 2017; 7:42362.
65. Khan M, Hayat M, Khan SA, Iqbal N. Unb-DPC: identify mycobacterial membrane protein types by incorporating un-biased dipeptide composition into Chou’s general PseAAC. J Theor Biol. 2017; 415:13-19.
66. Chou KC. Some remarks on protein attribute prediction and pseudo amino acid composition (50th Anniversary Year Review). J Theor Biol. 2011; 273:236-247.
67. Fu Z, Wu X, Guan C, Sun X, Ren K. Toward efficient multi-keyword fuzzy search over encrypted outsourced data with accuracy improvement. IEEE Trans Inf Forensic Sec. 2016; 11:2706-2716.
68. Chen Y, Hao C, Wu W, Wu E. Robust dense reconstruction by range merging based on confidence estimation. Sci China Inf Sci. 2016; 59: 092103.
69. Kanehisa M, Goto S, Kawashima S, Okuno Y, Hattori M. The KEGG resources for deciphering the genome. Nucleic Acids Res. 2004; 32: D277-D280.
70. Cai YD. Predicting subcellular localization of proteins in a hybridization space. Bioinformatics. 2004; 20:1151-1156.
71. Cai YD. Predicting enzyme family class in a hybridization space. Protein Sci. 2004; 13:2857-2863.
72. Cai YD, Zhou GP. Predicting enzyme family classes by hybridizing gene product composition and pseudo amino acid composition. J Theor Biol. 2005; 234:145-149.
73. Chen L, Huang T, Shi XH, Cai YD. Analysis of protein pathway networks using hybrid properties. Molecules. 2010; 15:8177-8192.
74. Chou KC, Cai YD. Predicting protein-protein interactions from sequences in a hybridization space. J Proteome Res. 2006; 5:316-322.
75. Chou KC. Using amphiphilic pseudo amino acid composition to predict enzyme subfamily classes. Bioinformatics. 2005; 21:10-19.
76. Wang X, Zhang W, Zhang Q, Li GZ. MultiP-SChlo: multi-label protein subchloroplast localization prediction with Chou’s pseudo amino acid composition and a novel multi-label classifier. Bioinformatics. 2015; 31:2639-2645.
77. Huang C, Yuan JQ. A multilabel model based on Chou’s pseudo amino acid composition for identifying membrane proteins with both single and multiple functional types. J Membr Biol. 2013; 246:327-334.
78. Zhou GP. An intriguing controversy over protein structural class prediction. J Protein Chem. 1998; 17:729-738.
79. Zhou GP, Doctor K. Subcellular location prediction of apoptosis proteins. Proteins. 2003; 50:44-48.
80. Cai YD. Prediction of membrane protein types by incorporating amphipathic effects. J Chem Inf Model. 2005; 45:407-413.
81. Nanni L, Brahnam S, Lumini A. Prediction of protein structure classes by incorporating different protein descriptors into general Chou’s pseudo amino acid composition. J Theor Biol. 2014; 360:109-116.
82. Ahmad S, Kabir M, Hayat M. Identification of Heat Shock Protein families and J-protein types by incorporating Dipeptide Composition into Chou’s general PseAAC. Comput Methods Programs Biomed. 2015; 122:165-174.
83. Dehzangi A, Heffernan R, Sharma A, Lyons J, Paliwal K, Sattar A. Gram-positive and Gram-negative protein subcellular localization by incorporating evolutionary-based descriptors into Chou’s general PseAAC. J Theor Biol. 2015; 364:284-294.
84. Liu B, Xu J, Fan S, Xu R, Jiyun Zhou J, Wang X. PseDNA-Pro: DNA-binding protein identification by combining Chou’s PseAAC and physicochemical distance transformation. Mol Inform. 2015; 34:8-17
85. Khan ZU, Hayat M, Khan MA. Discrimination of acidic and alkaline enzyme using Chou’s pseudo amino acid composition in conjunction with probabilistic neural network model. J Theor Biol. 2015; 365:197-203.
86. Kumar R, Srivastava A, Kumari B, Kumar M. Prediction of beta-lactamase and its class by Chou’s pseudo amino acid composition and support vector machine. J Theor Biol. 2015; 365:96-103.
87. Kabir M, Hayat M. iRSpot-GAEnsC: identifing recombination spots via ensemble classifier and extending the concept of Chou’s PseAAC to formulate DNA samples. Mol Genet Genomics. 2016; 291:285-296.
88. Behbahani M, Mohabatkar H, Nosrati M. Analysis and comparison of lignin peroxidases between fungi and bacteria using three different modes of Chou’s general pseudo amino acid composition. J Theor Biol. 2016; 411:1-5.
89. Rahimi M, Bakhtiarizadeh MR, Mohammadi-Sangcheshmeh A. OOgenesis_Pred: a sequence-based method for predicting oogenesis proteins by six different modes of Chou’s pseudo amino acid composition. J Theor Biol. 2016; 414:128-136.
90. Jiao YS, Du PF. Predicting protein submitochondrial locations by incorporating the positional-specific physicochemical properties into Chou’s general pseudo-amino acid compositions. J Theor Biol. 2017; 416:81-87.