
INTRODUCTION
Colorectal carcinomas (CRCs) have variable clinical, pathologic, and molecular features. Currently, these are classified based on the histologic findings, and tumor staging is determined by assessing spread at the time of diagnosis. Accurately determining the prognosis for individual patients with CRC is important, both for disease management, and for patient life planning. At present, prognosis is based predominantly on the pathologic stage of disease. However, formulating accurate projections for patients with stages II and III cancer is difficult, due to the fact that these patients have intermediate survival rates, and predicting individual responses to adjuvant chemotherapy is currently impossible. For stage III CRCs, standard therapy involves curative surgery, followed by adjuvant chemotherapy with the FOLFOX regimen. However, no biomarkers or classification system for accurately determining prognoses after this chemotherapeutic regimen in stage III CRCs is available.
Gene expression-based subtyping is widely accepted as a relevant method for assessing disease stratification [1, 2]. Recently, an international consortium [3] was dedicated to network analysis of six previously published independent classifiers [2, 4–8] using Jaccard distance, Markov cluster (MCL) algorithm, and weighted silhouette width (R package ‘WeightedCluster’). Four consensus molecular subtypes (CMSs) of CRC were established with the following distinguishing features: CMS1 (microsatellite instability immune, 14%) indicative of hypermutations and microsatellite unstable features which generally accompany strong immune activation; CMS2 (canonical, 37%) showed epithelial characters and marked WNT and MYC signaling activation; CMS3 (metabolic, 13%) showed also epithelial characters and metabolic dysregulation; CMS4 (mesenchymal, 23%) showed stromal infiltration, strong angiogenic features, and hyperactivation of transforming growth factors (TGF-β). Samples with mixed features (13%) were interpreted as a transition phenotype or represent an intratumoral heterogeneity [3].
Although these molecular subtypes can predict clinicopathologic characteristics and the natural prognosis of the disease, no gene expression-based subtyping system is available for calculating the prognoses of stage III CRCs after FOLFOX chemotherapeutic regimen. Specifically, evaluating the response to FOLFOX adjuvant chemotherapy according to molecular subtype may provide insights into 1) the natural course of stage III CRCs after FOLFOX chemotherapy according to molecular subtypes, and 2) the identification of specific subgroup(s) that most benefit from FOLFOX chemotherapy.
In this study, we selectively used fresh-frozen tissues of stage III CRCs treated with FOLFOX adjuvant chemotherapy. Homogeneous tumor cell population (> 70% tumor cells) of each tissue was collected by microdissection technique, which allowed us to minimize experimental error caused by differential proportion of tumor cells in tissue samples. We analyzed mRNA expression profiles of stage III CRCs samples and matched non-neoplastic colon mucosal tissues. In doing so, we identified colon cancer-specific transcripts and further found that CRC gene expression profiles can be divided into four types by nonnegative matrix factorization analysis. Moreover, we demonstrated an association between our specific molecular subtypes and the CMS, and further identified subtypes associated with good prognosis for stage III CRCs after FOLFOX chemotherapy.
RESULTS
Unsupervised clustering analysis of mRNA expression profiles identifies four distinct molecular subtypes
We first determined the mRNA expression profiles of 101 CRCs and 35 non-neoplastic colon mucosa tissue samples by microarray analysis, using the Human HT-12 v4 Expression BeadChip, which contains 47,323 probes representing 31,332 annotated genes (Figure 1A). As a result, 4,823 genes were identified as differentially expressed genes (DEGs) that displayed a |fold change|>2 and P-value<0.05 in colon cancers, as compared to non-neoplastic colon mucosa. To further analyze colon cancer-specific gene expression, we used unsupervised hierarchical clustering analysis of the 4,823 DEGs and found that CRC samples grouped into four separate clusters, distinct from the non-neoplastic colon mucosa tissues (Figure 1B). These gene expression microarray data have been deposited in NCBI’s Gene Expression Omnibus (GEO) database (http://www.ncbi.nlm.nih.gov/geo/) and are accessible through the GEO Series accession number GSE83889.
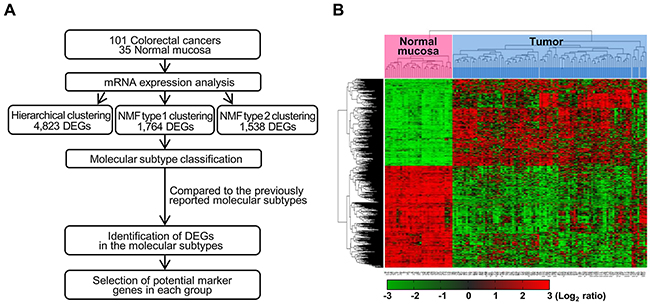
Figure 1: Workflow overview of gene expression-based molecular classification. (A) NMF consensus clustering using 1,764 DEGs in tumors compared to non-neoplastic tissues. DEGs for each of the four groups, as compared to non-neoplastic colon mucosa tissues and/or the other groups were selected. DEG: differentially expressed genes, NMF: nonnegative matrix factorization. (B) Unsupervised hierarchical clustering analysis of mRNA expression profiles from colon cancer tissues. Unsupervised classification identifies four molecularly distinct subtypes. Red and green colors indicate transcript levels above and below the sample median, respectively. Complete separation of 35 normal colon tissues (red) and 101 colon cancers (sky blue) was evident based on gene expression profiles.
Gene expression-based molecular subtypes are categorized in four groups by nonnegative matrix factorization
To classify the 101 colorectal tumors according to the gene profiles of those tumors, we performed NMF consensus clustering using 1,764 tumor-specific DEGs that displayed a |fold change|>2 and P-value<0.01 in a more strict condition compared to non-neoplastic tissues. NMF is a nonnegative matrix factorization algorithm that focuses on the analysis of data matrices whose elements are nonnegative. To identify high consensus clusters (cophenetic coefficient, ρk, is closer to 1.0), we applied the various conditions for the factorization algorithm for each value of k cluster (k=2, 3, 4, 5, 6, and 7). We then obtained a consensus plot (and cophenetic coefficient) for each k=2 to 7 value and chose k values with high consensus. Using this consensus analysis with the 1,764 DEGs, we found good consensus for k=4 clusters (coph=0.8961), suggesting that there was evidence for four consensus clusters (type 1) and hence, four functional distinct properties that can be elucidated from the DEGs of 101 colorectal tumors; group 1 (n=22, 21.8%), group 2 (n=21, 20.8%), group 3 (n=16, 15.8%), and group 4 (n=42, 41.6%) (Figure 2A). The consensus matrix showed that groups 1 and 4 appeared as individualized clusters (sharp consensus clustering), whereas groups 2 and 3 showed less distinct boundaries.
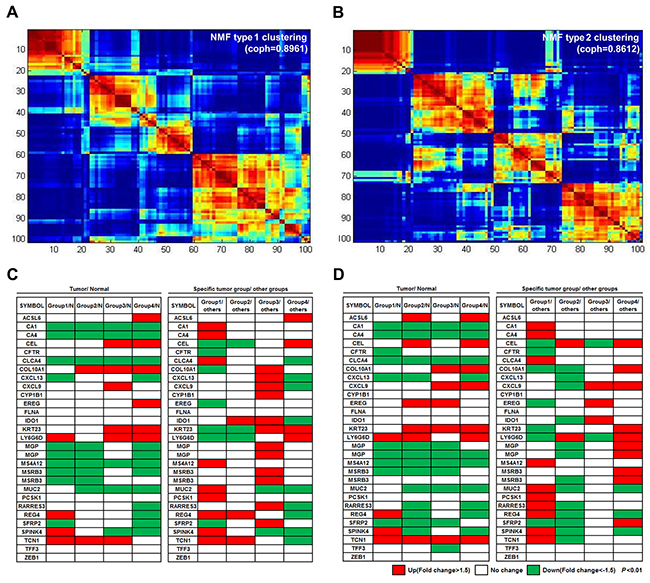
Figure 2: Four molecular subtypes identified using consensus clustering-based NMF. (A) NMF type 1 clustering: consensus clustering using 1,764 DEGs in tumors compared to non-neoplastic tissues. (B) NMF type 2 clustering: clustering with 1,538 DEGs specific for one group, as compared to other tumor groups. (C and D) Analysis of the mRNA expression patterns of the 30 genes from the CRCassigner-30 was performed according to each of the four subtypes from NMF type 1 clustering (C) and NMF type 2 clustering (D). NMF type 1 clustering showed more distinct gene expression patterns between the tumor subtypes than that of the NMF type 2 clustering.
We also performed NMF consensus clustering with another selected gene set; the 1,538 DEGs that showed differential expression among tumor groups were divided by the hierarchical clustering method (Figure 1B) when |fold change|>2 and P-value<0.01. In the NMF consensus analysis with these 1,538 DEGs, there are k=4 clusters (type 2) with high cophenetic coefficient (coph=0.8612); group 1 (n=20, 19.8%), group 2 (n=29, 28.7%), group 3 (n=24, 23.8%), and group 4 (n=28, 27.7%) (Figure 2B). Samples represented in each group divided by NMF with either the 1,764 or the 1,538 DEGs were similar (77.2% matched).
In order to further characterize the gene expression of the different tumor subtypes, we analyzed expression patterns of 30 colon cancer classifier genes, known as the CRCassigner-30 [2], in four subtypes that were obtained each from type 1 and type 2 clustering under the conditions of |fold change|>1.5 and P-value<0.01 (Figure 2C, 2D). In four tumor groups obtained from type 1 clustering, the expression of 5 genes was found to have increased in a specific tumor group, compared to the normal group (left panel of Figure 2C). In addition, the expression of 18 genes was found to have increased in a specific tumor group, compared to the rest of the tumor groups (right panel of Figure 2C). In four tumor groups obtained from type 2 clustering, the expression of two and 17 genes was also found to have increased in a specific tumor group compared to the normal group or the rest of the tumor groups, respectively (Figure 2D). Overall, type 1 clustering (NMF with 1,764 DEGs in tumors compared to non-neoplastic tissues) showed more distinct gene expression patterns between tumor groups than those of type 2 clustering (NMF with 1,538 DEGs in tumor groups divided by unsupervised hierarchical clustering). Therefore, we chose type 1 clustering for the subsequent gene expression analyses.
Clinicopathologic characteristics of CRCs according to molecular subtypes
We compared several clinicopathologic and molecular characteristics of our 101 CRCs according to the four molecular subtypes; the clinicopathologic characteristics of the samples in each of the four molecular subtypes are shown in Table 1. We found that there were several clinicopathologic parameters, showing significant differences in each group. Specifically, there are significant differences among the subtypes in tumor location (P<0.001), proportion of microsatellite instability (MSI) (P<0.001), presence of mucin (P<0.001), and incidence of KRAS mutation (P=0.01). Further, >50% of the cases in groups 3 (62.5%) and 4 (85.7%) presented as left-sided tumors. Conversely, >50% of the cases in groups 1 (54.5%) and 2 (57.1%) were located on the right side. Histologically, most cases were adenocarcinomas with moderate differentiation; there were four mucinous adenocarcinomas (mucin production in >50% of tumors) and two medullary carcinomas (carcinoma with prominent infiltration of intraepithelial lymphocytes). All four mucinous adenocarcinomas were in group 1, and the two medullary carcinomas were in group 2. In regards to extracellular mucin production, most cases in groups 3 (87.5%) and 4 (92.9%) did not present with extracellular mucin production; whereas, >50% of cases in groups 1 and 2 showed extracellular mucin. We also found frequent KRAS mutations in group 1 (63.6%) and group 3 (56.3%) and less in groups 2 (28.6%) and 4 (26.2%). Further, we observed high MSI (MSI-H) in groups 2 (28.6%), and 1 (9%), but no instances in groups 3 and 4.
Table 1: Clinical and pathologic features of each molecular group
Category |
Variables |
Group 1 |
Group 2 |
Group 3 |
Group 4 |
P-value |
||||
|---|---|---|---|---|---|---|---|---|---|---|
(n=22, 21.8%) |
(n=21, 20.8%) |
(n=16, 15.8%) |
(n=42, 41.6%) |
|||||||
Age, years |
57.95±13.26 |
58.09±13.67 |
62±9.04 |
58.81±9.42 |
0.802 |
|||||
Gender |
Male |
14 |
63.6% |
8 |
38.1% |
7 |
43.8% |
22 |
52.4% |
0.376 |
Female |
8 |
36.4% |
13 |
61.9% |
9 |
56.2% |
20 |
47.6% |
||
Location |
Right side |
12 |
54.5% |
12 |
57.1% |
6 |
37.5% |
6 |
14.3% |
<0.001a |
Left side |
10 |
45.5% |
9 |
42.9% |
10 |
62.5% |
36 |
85.7% |
||
Preop CEA level |
≤5 ng/ml |
18 |
81.8% |
17 |
81.0% |
10 |
62.5% |
28 |
66.7% |
0.367 |
>5 ng/ml |
4 |
18.2% |
4 |
19.0% |
6 |
37.5% |
14 |
33.3% |
||
Histologic diagnosis |
Adenocarcinoma |
18 |
81.8% |
19 |
90.5% |
16 |
100.0% |
42 |
100.0% |
<0.001a |
Mucinous adenocarcinoma |
4 |
18.2% |
0 |
0.0% |
0 |
0.0% |
0 |
0.0% |
||
Medullary carcinoma |
0 |
0.0% |
2 |
9.5% |
0 |
0.0% |
0 |
0.0% |
||
Mucin formation |
Absent |
10 |
45.5% |
9 |
42.8% |
14 |
87.5% |
39 |
92.9% |
0a |
Focal |
8 |
36.4% |
12 |
57.2% |
2 |
12.5% |
3 |
7.1% |
||
predominant |
4 |
18.2% |
0 |
0.0% |
0 |
0.0% |
0 |
0.0% |
||
Crohn like lymphoid reaction |
low-density group |
14 |
63.6% |
13 |
61.9% |
8 |
50.0% |
33 |
78.6% |
0.157 |
high-density group |
8 |
36.4% |
8 |
38.1% |
8 |
50.0% |
9 |
21.4% |
||
invasion pattern |
expending |
2 |
9.1% |
7 |
33.3% |
2 |
12.5% |
4 |
9.5% |
0.098 |
infiltrative |
20 |
90.9% |
14 |
66.7% |
14 |
87.5% |
38 |
90.5% |
||
BRAFb |
Wild type |
22 |
100.0% |
20 |
95.2% |
16 |
100.0% |
42 |
100.0% |
0.366 |
Mutation |
0 |
0.0% |
1 |
4.8% |
0 |
0.0% |
0 |
0.0% |
||
KRASb |
Wild type |
8 |
36.4% |
15 |
71.4% |
7 |
43.8% |
31 |
73.8% |
0.01a |
Mutation |
14 |
63.6% |
6 |
28.6% |
9 |
56.3% |
11 |
26.2% |
||
MSI status |
MSS/ MSI-low |
20 |
90.9% |
15 |
71.4% |
16 |
100.0% |
42 |
100.0% |
<0.001a |
MSI-high |
2 |
9.0% |
6 |
28.6% |
0 |
0.0% |
0 |
0.0% |
||
MLH1 lossc |
0 |
6 |
0 |
0 |
||||||
MSH2 lossc |
1 |
1 |
0 |
0 |
||||||
PMS2 lossc |
1 |
5 |
0 |
0 |
||||||
MSH6 lossc |
1 |
1 |
0 |
0 |
||||||
aP<0.05, bPyrosequencing, cImmunohistochemical stain, MSS: Microsatellite stability, MSI: Microsatellite instability
Protein expression of the mismatch repair genes (MLH1, MSH2, PMS2, and MSH6) were then evaluated by immunohistochemistry. All six cases of MSI-H in group 2 showed loss of expression of MLH1 (five cases showed loss of MLH1 and PMS2 expression, and the remaining one case showed loss of MLH1, PMS2, and MSH6 expression). In contrast, one MSI-H case in group 1 showed loss of expression of PMS2, and the other case showed loss expression of MSH2 and MSH6. One out of four mucinous adenocarcinomas was MSI-H, and both medullary carcinomas were MSI-H. Crohn’s-like lymphoid reaction is a common feature of MSI in colon cancer, and therefore, this was evaluated using the Väyrynen-Mäkinen criteria. However, no significant differences were found between the different subtypes.
Correlation between our four molecular subtypes and the consensus molecular subtypes
We next employed ‘CMSclassifier’ (scripts and code for CMS classifier available at: https://github.com/Sage-Bionetworks/crcsc) for CMS classification [2, 3] of our 101 CRC samples using k=4 clusters determined in Figure 2A. Among the 101 samples, 80 tumors were representative of each CMS; whereas, the remaining 21 unlabeled samples (non-consensus samples) did not have any consistent pattern within the four CMS groups. When we compared the CMS grouping with our subtypes, and found that, of the 101 cancers, 63 showed close correlation to one of the four subtypes (Table 2). Specifically, 10 of 21 group 2 samples were included in CMS1 (microsatellite instability immune and characterized as hypermutated, microsatellite unstable and strong immune activation), and all 10 that grouped in CMS1 were also classified in group 2. Both the group 2 and CMS1 samples were characterized by frequent MSI-H tumors. Similarly, 31 out of 42 samples from group 4 were classified as CMS2 (canonical and characterized by marked WNT and MYC signaling activation), while 31 out of 38 samples in CMS2 also were found in group 4. These group 4 and CMS2 types are characterized by frequent left-sided preponderance. We further observed that 12 out of 22 group 1 samples were classified as CMS3 (metabolic and characterized by evident metabolic dysregulation), and 12 out of 13 CMS3 cases belonged to group 1. In our study, 13 (13%) of CMS3 cases were characterized by high KRAS mutation rates. Finally, we found that 10 out of 16 samples belonging to group 3 were classified into CMS4 (mesenchymal and characterized by prominent transforming growth factor activation, stromal invasion and angiogenesis), while 10 out of 19 CMS4 samples also belonged to group 3. When we exclude the 21 non-consensus cases, a 79% (63 out of 80 cases) correlation was found between the CMS classification and our molecular classification. The distribution of the CMS groups is shown in Table 2.
Table 2: Correlation between 4 molecular groups and CMS subtypes
NMF network class |
Total |
|||||
Group 2 |
Group 4 |
Group 1 |
Group 3 |
|||
Predicted CMS class |
CMS1 |
10 (66.6%) |
0 (0%) |
0 (0%) |
0 (0%) |
10 |
CMS2 |
4 (26.7%) |
31 (79.5%) |
3 (18.8%) |
0 (0%) |
38 |
|
CMS3 |
1 (6.7%) |
0 (0%) |
12 (75%) |
0 (0%) |
13 |
|
CMS4 |
0 (0%) |
8 (20.5%) |
1 (6.2%) |
10 (100%) |
19 |
|
undetermined |
6 |
3 |
6 |
6 |
21 |
|
Total |
21 |
42 |
22 |
16 |
101 |
|
To evaluate how well NMF consensus clustering matched CMS classification, we further performed subtyping analysis by using the same set of samples used for NMF consensus clustering by another commonly used subtyping method that combines Euclidean distance, Ward’s minimum variance method, and weighted gene co-expression network analysis (WGCNA). This analysis showed that 101 CRCs were divided into four main groups (group A-D), and all groups well-matched only CMS2 and not the remaining CMS subtypes (Supplementary Table 1). With the highest concordance rates, 13 out of 38 samples of group A, 14 out of 26 samples of group B, and half of 10 samples of group C belonged to CMS2. In group D, 6 out of 27 samples belonged to CMS2 or CMS4, respectively. These results showed that NMF consensus clustering was a highly compatible classification method to CMS classification.
We further compared several clinicopathologic and molecular characteristics of our 101 CRCs according to the CMS molecular subtypes. The clinicopathologic characteristics of four CMS molecular subtypes and non-consensus subtypes are shown in Supplementary Table 2. As expected, similar clinicopathologic parameters were found to vary according to both our classification system and the CMS grouping. There are significant differences among the subtypes in tumor location (P<0.01), proportion of MSI-H tumors (P<0.001), presence of mucin (P<0.001), and incidence of KRAS mutation (P<0.05). Cases classified as CMS1 displayed a right-sided preponderance (>70%), exophytic growth pattern, normal preoperative CEA level, and high preponderance of MSI-H tumors. In contrast, CMS2 cases a showed left-sided preponderance (84.2%) and frequent (31.6%) increased preoperative CEA level. Additionally, >50% of cases in CMS3 showed extracellular mucin production and frequent (61.5%) KRAS mutation.
Patient survival according to molecular subtype
We performed a survival analysis on the 101 CRC patients according to the molecular subtypes. The mean follow-up time was 57.8 months (ranging from 15 to 115 months). With follow up, 13 patients (12.9%) relapsed, and six (5.9%) died from colon cancer-related causes. Groups 2 and 3 showed significantly better overall survival (OS) (P=0.019) than groups 1 and 4, which indicates that group 2 and 3 are associated with favorable prognosis (Figure 3A, 3B). We further performed survival analysis using a separate set of group 1, 2, and 3, and another set of group 2, 3, and 4, respectively. Groups 2 and 3 showed better disease-free survival (DFS) (P=0.039) and OS (P=0.027) than group 1, but not group 4 (Supplementary Figure 1). In consistent with these findings, the two subtypes from the CMS classification showing high concordance rates in overall survival were CMS1 and CMS4, which correspond to our groups 2 and 3, respectively (Figure 3C, 3D).
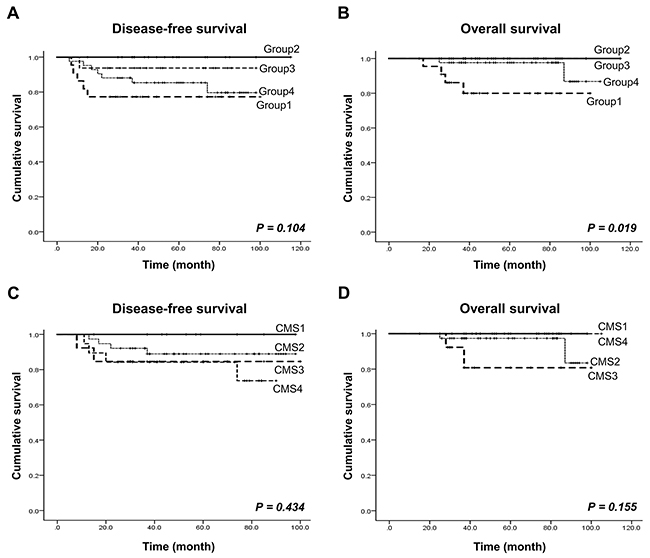
Figure 3: Patient survival rate analysis according to our CRC molecular subtype and the CMS. (A and B) Disease-free survival and overall survival according to our four molecular subtypes. (C and D) Disease-free survival and overall survival according to the four CMS subtypes.
Identification of differentially expressed genes in each molecular subtype
We further analyzed gene expression patterns, in order to identify gene subsets that are differentially expressed in the four groups, as compared to non-neoplasctic colon mucosa tissues and/or other groups. Differently expressed genes were identified in each group: 194 genes in group 1,736 genes in group 2,493 genes in group 3, and 634 genes in group 4. In addition, 275 genes, 372 genes, 558 genes, and 184 genes were differentially expressed in each respective group, as compared to the other groups (Figure 4A). We next selected genes that are characteristic of each group by choosing those that are differentially regulated as compared to both normal tissue and the other molecular groups. As a result, 292 genes were found as potential group markers (Figure 4A, 4B). We finally selected ten genes from this group genes that are overexpressed >1.5-fold in one group, as compared to both normal tissues and tumors in other groups. Among these genes, especially, DEFA5, DUOX2, KLK12, and ALDOB in group 1, CCDC58, MOCOS, and FAM81A in group 2, HOPX, TAGLN, GREM1, THBS4, COL3A1, PRRX1, RAB31, MYL9, CTSK, and SPARC in group 3, and DSC3 and CAB39L in group 4 were up-regulated (>2.0-fold) (Figure 4C, Table 3).
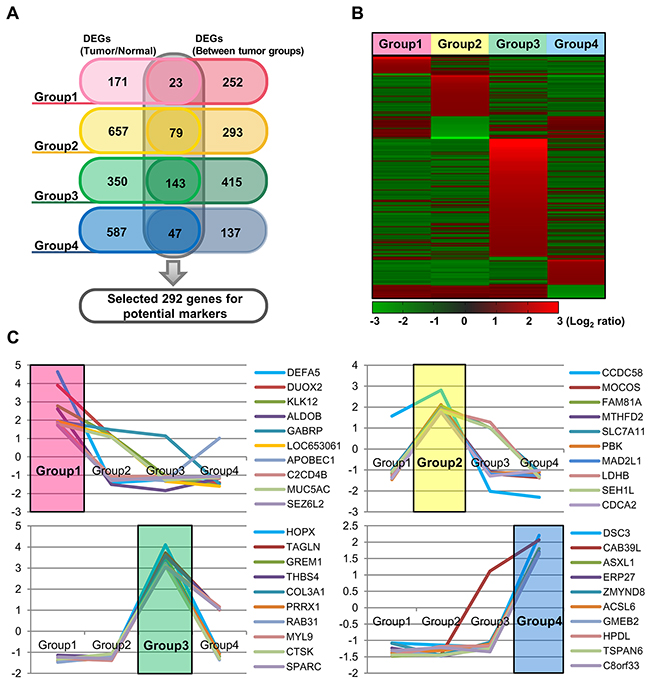
Figure 4: Identification of mRNAs differentially expressed in each of the four groups, as compared to non-neoplastic colon mucosa tissues and/or the other groups. (A) Venn diagram showing a total of 292 potential marker genes, with group specific upregulation. (B) Heatmap of the mRNA expression profiles of these 292 DEGs according to the four molecular groups. (C) The mRNA expression profiles of 10 selected genes from each group.
Table 3: Specific-upregulated genes in each molecular group
Gene cluster |
Gene symbola |
Description |
FC. T vs. N |
FC. Specific T group vs. other T groups |
|---|---|---|---|---|
Group 1 |
DEFA5 |
defensin, alpha 5, Paneth cell-specific |
4.56 |
4.65 |
DUOX2 |
dual oxidase 2 |
4.28 |
3.91 |
|
KLK12 |
kallikrein-related peptidase 12 |
3.19 |
2.77 |
|
ALDOB |
aldolase B |
5.37 |
2.61 |
|
GABRP |
gamma-aminobutyric acid (GABA) A receptor, pi |
1.84 |
1.95 |
|
LOC653061 |
similar to Golgin subfamily A member 8-like protein 1 |
2.62 |
1.95 |
|
APOBEC1 |
apolipoprotein B mRNA editing enzyme, catalytic polypeptide 1 |
3.31 |
1.88 |
|
C2CD4B |
family with sequence similarity 148, member B |
2.93 |
1.82 |
|
MUC5AC |
mucin 5AC, oligomeric mucus/gel-forming; similar to hCG1778310 |
2.27 |
1.79 |
|
SEZ6L2 |
seizure related 6 homolog (mouse)-like 2 |
2.35 |
1.73 |
|
Group 2 |
CCDC58 |
coiled-coil domain containing 58 |
6.19 |
2.81 |
MOCOS |
molybdenum cofactor sulfurase |
2.92 |
2.11 |
|
FAM81A |
family with sequence similarity 81, member A |
2.59 |
2.06 |
|
MTHFD2 |
methylenetetrahydrofolate dehydrogenase (NADP+ dependent)2, methenyltetrahydrofolate cyclohydrolase |
3.10 |
1.99 |
|
SLC7A11 |
solute carrier family 7, (cationic amino acid transporter, y+ system) member 11 |
2.52 |
1.93 |
|
PBK |
PDZ binding kinase |
2.78 |
1.91 |
|
MAD2L1 |
MAD2 mitotic arrest deficient-like 1 (yeast) |
3.49 |
1.90 |
|
LDHB |
lactate dehydrogenase B |
3.18 |
1.86 |
|
SEH1L |
SEH1-like (S. cerevisiae) |
2.14 |
1.83 |
|
CDCA2 |
cell division cycle associated 2 |
2.38 |
1.77 |
|
Group 3 |
HOPX |
HOP homeobox |
4.26 |
4.11 |
TAGLN |
Transgelin |
2.66 |
3.73 |
|
GREM1 |
gremlin 1 |
2.12 |
3.59 |
|
THBS4 |
thrombospondin 4 |
2.85 |
3.58 |
|
COL3A1 |
collagen, type III, alpha 1 |
5.33 |
3.34 |
|
PRRX1 |
paired related homeobox 1 |
4.29 |
3.23 |
|
RAB31 |
RAB31, member RAS oncogene family |
3.60 |
3.21 |
|
MYL9 |
myosin, light chain 9, regulatory |
2.38 |
3.13 |
|
CTSK |
cathepsin K |
2.59 |
3.11 |
|
SPARC |
secreted protein, acidic, cysteine-rich (osteonectin) |
2.35 |
3.05 |
|
Group 4 |
DSC3 |
desmocollin 3 |
2.66 |
2.21 |
CAB39L |
calcium binding protein 39-like |
2.22 |
2.07 |
|
ASXL1 |
additional sex combs like 1 (Drosophila) |
1.99 |
1.80 |
|
ERP27 |
endoplasmic reticulum protein 27 |
2.55 |
1.70 |
|
ZMYND8 |
zinc finger, MYND-type containing 8 |
1.90 |
1.69 |
|
ACSL6 |
acyl-CoA synthetase long-chain family member 6 |
1.94 |
1.67 |
|
GMEB2 |
glucocorticoid modulatory element binding protein 2 |
1.78 |
1.66 |
|
HPDL |
4-hydroxyphenylpyruvate dioxygenase-like |
2.79 |
1.66 |
|
TSPAN6 |
tetraspanin 6 |
2.11 |
1.64 |
|
C8orf33 |
chromosome 8 open reading frame 33 |
2.15 |
1.63 |
aSelected genes that show specific-upregulated expression in each molecular group. Those matching previously reported classifier genes are marked in bold.
We next performed survival analysis according to the expression of two randomly selected genes out of 10 genes that represented characteristic of each group. Although statistically insignificant in some genes, there was a trend where cases were distinctively divided into poor and good prognosis groups according to the expression of selected gene (Supplementary Figure 2). High expression of KLK12 and MUC5AC (group 1), and DSC3 (group 4) was associated with poor prognosis, while high expression of FAM81A, SEH1L, TAGLN and THBS4 (group 2 and 3), and TSPAN6 (group 4) was associated with good prognosis.
DISCUSSION
The identification of predictive biomarkers and the development of a molecular classification that can predict therapeutic responses of advanced CRCs are major goals in cancer research. A number of recent studies have elucidated several molecular CRC subtypes by gene expression profiling, and some of these have been reported to be associated with specific clinical outcomes [2, 4–8]. For example, Budinska et al. [4] divided CRCs into five subtypes, and demonstrated that one was associated with good outcomes (designated as lower crypt subtype) and another with poor outcomes (designated as mesenchymal subtype). Marisa et al. [5] outlined six CRC subtypes and found that one (designated as cancer stem cell and CIN normal subtype) was related to poor prognosis. Roepman et al. [7] proposed three subtypes, one of which (designated as the A subtype) was characterized by right-sided preponderance, was hypermutated with frequent MSI and BRAF mutations, and was associated with a good prognosis. De Sousa et al. [6] also divided CRCs into three molecular subtypes and found one (designated as CCS3 subtype) was related to poor differentiation and associated with poor prognosis. Sadanandam et al. [2] proposed five molecular subtypes, one of which (designated as stem-like subtype) was related to poor prognosis, and similarly, Schlicker et al. [8] identified five CRC subtypes, and found one (designated as 1.1 subtype) was related to poor prognosis and another (designated as 2.1 subtype) that was associated with better DFS. To comprehensively understand molecular CRC subtypes, we further matched these independently reported CRC subtypes to CMS subtypes. In Budinska et al.’s study [4], lower crypt subtype was associated with good outcomes, CIMP subtype was associated with worse survival after relapse, and mesenchymal subtype with worse relapse-free survival and overall survival. These three subtypes corresponded to CMS2, CMS1, and CMS4, respectively. Other subtypes such as cancer stem cell subtype (Marisa et al.) [5], C subtype (Roepman et al.) [7], CCS3 subtype (De Sousa et al.) [6], stem-like subtype (Sadanandam et al.) [2], and 1.1 subtype (Schlicker et al.) [8] were commonly related to worse relapse-free survival and overall survival, and these subtypes generally matched CMS4. These previously reported molecular subtypes were also associated with the characteristics of our groups. The KRAS-mutated subtype [5] is related to our group 1, whereas our group 2 is similar to the dMMR [5], A type [7] and CCS2 [6] subtypes, all of which are more commonly located in the right side of the colon and contain high MSI [9]. We further observed that our group 3 shares characteristics with the 1.3 subtype [8], which contains microsatellite stability (MSS) and activated transporter genes, and further, group 4 is associated with the B subtype [7], which is most commonly found in the left side of the colon.
The reported molecular classifications all have potential for both prognosis evaluation and for predicting the therapeutic responses of advanced CRCs. However, we believe that the previously reported molecular classification systems have several features limiting their clinical utility. Specifically, many of the published studies have a diverse clinical cohort, as well as non-uniform sources for clinical sample acquisition (e.g., RNA extraction from fresh-frozen samples or from formalin-fixed paraffin-embedded samples). Further, experimental methodological differences and distinct data processing algorithms may produce discrepant results. Therefore, in order to establish a collaborative subtyping for CRC and to resolve inconsistencies among the reported gene expression-based CRCs, four CMSs with distinguishing features were proposed by an international consortium [3]. By this CMS classification, 80 out of 101 cases analyzed in our study were classified into one of the four groups, whereas 21 cases were not categorized and thus placed in the non-consensus group. Here, we performed NMF consensus clustering with 1,764 DEGs in tumors compared to non-neoplastic tissues and identified four CRC molecular subtypes. We found close correlation between group 2 and CMS1 (microsatellite instability immune), group 4 and CMS2 (canonical), group 1 and CMS3 (metabolic), and group 3 and CMS4 (mesenchymal).
Although each of our molecular subtypes generally matched to a specific CMS, and they showed similarities to the CMS system, there are also some critical differences. Specifically, our molecular grouping method divided all 101 CRC cases into one of the four groups, whereas 21 cases were not categorized using the CMS system. Of the remaining 80 cases that were classified by the CMS, 79% were grouped in a correlating subtype. Therefore, 63% of the 101 cases were completely matched in both systems. Since we evaluated the predictive value of molecular classification using only stage III CRCs with FOLFOX adjuvant chemotherapy and performed microdissection of each fresh-frozen sample, we believe that our approach enabled the analysis of homogeneous tumor cell populations (>70% tumor cells); therefore, experimental errors from different tumor populations were minimalized. We rather suspect that the discrepant results might result from the diverse patient cohorts, sample preparation methods, and different technologies utilized for the analysis of gene expression platforms.
Our NMF consensus clustering-based molecular classification showed that patients in groups 2 and 3 exhibited a significant advantage in overall survival (P=0.019), as well as a trend toward better DFS (P=0.104). More specifically, survival analysis using groups 1, 2, and 3 revealed that patients in groups 2 and 3 showed better DFS (P=0.039) and OS (P=0.027) than group 1, but no significant difference in survival was observed when we analyzed groups 2, 3 and 4. Supporting these findings, a previous report showed that stages II and III CRC patients with good prognosis could be categorized into a subtype highly similar to group 2, with features such as MSI, BRAF mutations, and right-sided tumor location [5–7]. Moreover, the overall survival curve for our patients based on CMS subtype showed a worse outcome for CMS2 and CMS3, which correlate to groups 4 and 1, respectively, in our study. However, statistical significance was not found in the CMS classification, likely due to small number of cases that were classified. These findings suggest that our molecular classification can identify homogeneous subsets of stage III CRCs with either a good or bad prognosis after FOLFOX adjuvant chemotherapy. We note, however, that we could not conclude that the clinical results from the patients with good prognosis subtypes can predict responses to the FOLFOX regimen or the natural clinical disease course, as this was not a prospective study. To better predict responses to FOLFOX adjuvant therapy, a large cohort including CRC mucosa tissues without FOLFOX adjuvant chemotherapy should be included in future study.
We analyzed the molecular characteristics of each subtype by performing gene ontology analysis with the differentially expressed subtype-specific genes. This revealed that the expression of cell death and apoptosis genes were lower in group 1 tumors. It has previously been reported that the important functional consequence of CRCs with a KRAS mutation is lack of apoptosis, and 14 out of 22 CRCs in group 1 had a KRAS mutation [10, 11]. In group 2, increased expression of genes associated with p53 signaling and cell proliferation was noted, and six out of eight MSI-H CRCs were classified in this group. MSI-H tumors are known to have a more favorable prognosis than the MSS/MSI-L CRCs. Further, it has been reported that increased expression of p53 is associated with good survival outcome in the stage III CRCs with FOLFOX therapy [12]. Accordingly, the group 2 CRCs in our study showed the best survival after FOLFOX therapy. In group 3 CRCs, expression of genes associated with inhibition of epithelial-to-mesenchymal transition was increased, whereas genes associated with fatty acid synthesis and the TCA cycle were decreased. The association between decreased expression of metabolic genes and good prognosis had been reported in both CRC and hepatocellular carcinoma [13, 14], and agreement with this, CRC patients in group 3 showed a better prognosis than those in the other groups. In group 4 CRCs, decreased expression of genes associated with antigen processing and presentation and immune response was observed, and this has previously been associated with a poor prognosis in many cancers [15–21]. In agreement with this, the prognosis for group 4 CRCs was the worst of any of the groups in our study.
We further selected 10 potential biomarker genes from each group by identifying the genes that were differentially expressed both between the tumor groups and normal mucosa. We then compared these genes to those selected as a molecular classifier in a number of previously published papers [2, 4–8]. We found that >50% of our genes matched previously reported classifier genes (comprised of a total of 2032 genes from six different studies). In group 1, six genes [DEFA5 (4.56/4.65-fold), DUOX2 (4.28/3.91-fold), KLK12 (3.19/2.77-fold), GABRP (1.84/1.95-fold), APOBEC1 (3.31/1.88-fold), and MUC5AC (2.27/1.79-fold)] matched previously reported genes. Of these, DEFA5 had been shown to be a key factor in the formation of adenomas, and has been proposed as a prognostic and predictive potential molecular biomarker in CRCs [22]. In group 2, three genes [MOCOS (2.92/2.11-fold), SLC7A11 (2.52/1.93-fold) and PBK (2.78/1.91-fold)] matched previously reported genes. The over-expression of SLC7A11, a p53-associated gene, had been shown to have an important role in tumor growth suppression [23]. In group 3 CRCs, all 10 genes (HOPX, TAGLN, GREM1, THBS4, COL3A1, PRRX1, RAB31, MYL9, CTSK and SPARC) matched the previously reported molecular classifier [2, 4–8], and most of these genes were known to function as suppressors during EMT process. HOPX (4.26/4.11-fold) is a known colon stem cell marker and is associated with the suppression of tumor metastasis [24], and TAGLN (2.66/3.73-fold) was found as a novel tumor suppressor and its post-surgical high expression was reported to be associated with good prognosis in stage III CRCs [25]. GREM1 (2.12/3.59-fold) was reported to be closely associated with low lymphovascular invasion and good prognosis in locally advanced stage II and III CRCs [26]. In group 4, five genes genes [CAB39L (2.22/2.07-fold), ASXL1 (1.99/1.80-fold), ERP27 (2.55/1.70-fold), ACSL6 (1.94/1.67-fold), and TSPAN6 (2.11/1.64-fold)] matched previously reported classifier genes, and of these, TSPAN6 was the most frequently reported in the six previous papers. TSPAN6 has been associated with tumor cell migration [27, 28], and over-expression is linked to worsened survival in CRC patients. We further matched our potential biomarker genes to classifier genes provided from a recently reported study, which merged and evaluated 22 types of previously reported classifiers [29]. Overall, about 80 % of our potential biomarker genes overlapped with classifier genes reported by 22 different previous studies. These findings indicate that our genes may serve as clinically useful molecular biomarkers for tumor classification.
Collectively, these findings suggest that molecular classification using these molecular markers may be possible, and future prospective studies may further elucidate their prognostic and predictive values for assessing the response to FOLFOX adjuvant therapy in stage III CRCs.
MATERIALS AND METHODS
Patients and tumor tissues
A total of 101 CRCs and 35 matched non-neoplastic colon mucosal tissue samples were analyzed in this study. All the cancers were stage III (metastasis to regional lymph nodes but not to distant sites) and were treated with the FOLFOX regimen; none of the patients had received neo-adjuvant chemotherapy. The specimens were obtained from the archives of the Department of Pathology, Yonsei University, Seoul, Korea and from the Liver Cancer Specimen Bank of the National Research Resource Bank Program of the Korean Science and Engineering Foundation of the Ministry of Science and Technology. Information from the tumor registry and chart review data were obtained to determine demographics, tumor site, and follow up. The population contained 50 females and 51 males. The 36 tumors located proximal to the splenic flexure were classified as right-sided and the 65 distal to the splenic flexure as left-sided. Patient data were collected retrospectively. All patients had undergone curative colorectal resection between 2006 and 2012, and fresh snap-frozen samples were obtained immediately at the time of surgery. Tumor specimens were microdissected using a cryostat and fractionated to improve tumor content. Briefly, prior to cutting sections for RNA isolation, a slide was prepared for hematoxylin-eosin staining to allow the selection of samples with >70% tumor cells; samples with a tumor cell content <70% were further cut to enrich the tumor cell population. Through this process, were ensured that all carcinoma samples analyzed in this study were comprised of >70% tumor cells. Authorization for use of these tissues for research purposes was obtained from the Institutional Review Board of the Yonsei University of College of Medicine.
RNA preparation
Total RNA was extracted using TRIzol Reagent (Invitrogen Life Technologies, Carlsbad, CA, USA), according to the manufacturer’s protocol. After DNase digestion and other clean-up procedures, RNA samples were quantified, aliquoted, and stored at -80°C until use. For quality control, RNA purity and integrity were evaluated by denaturing gel electrophoresis and measurement of the A260/280 ratio, and all samples were analyzed using the 2100 Bioanalyzer (Agilent Technologies, Santa Clara, CA, USA). For all samples, the RNA integrity number scores were >9.5.
Gene expression analysis
For DNA microarray hybridization, RNA was pooled by mixing equal amounts of total RNA, and biotin-labeled cRNA targets were synthesized starting from 1.5 μg of total RNA. Double-stranded cDNA synthesis was performed using the Illumina® TotalPrep RNA Amplification Kit (Illumina, San Diego, CA, USA), while biotin-UTP-labeled antisense RNA was transcribed in vitro using the Ambion MEGAscript kit (Ambion Life Technologies, Carlsbad, CA, USA). All steps of the labeling procedure were performed according to the manufacturers’ protocols. Microarray experiments were conducted on the HumanHT-12 v4 Sentrix Expression BeadChip (Illumina), which contains 47,231 probes, representing 31,332 annotated genes. Hybridization of labeled cRNA to the BeadChip, washing, and scanning were performed according to the Illumina Bead Station 500× manual.
mRNA gene expression data preparation and statistical analysis
Raw data were extracted using the software provided by the manufacturer (Illumina Genome Studio v2011.1 [Gene Expression Module v1.9.0]), and expression intensities were normalized using quantile normalization techniques [30]. Based on these normalized intensities, genes differentially expressed in non-neoplastic colon mucosal tissues and in colon tumors were determined using the integrated statistical method previously reported [31]. Briefly, 1) two independent tests were performed: a Student’s t-test and the log2-median-ratio test; 2) adjusted P-values from each test were computed using an empirical distribution of the null hypothesis that the means of the genes are not different, which was obtained from random permutations of the samples; 3) the P-values from the two tests were combined to compute the overall P-values using Stouffer’s method [32], and 4) For unsupervised hierarchical clustering in Figure 1B, 4,823 DEGs were selected from the microarray raw data under the conditions of |fold change|>2 and P-value<0.05. For NMF consensus clustering analysis in Figure 2A, 1,764 DEGs were selected from the microarray raw data under the conditions of |fold change|>2 and P-value<0.01. For NMF consensus clustering analysis in Figure 2B, 1,538 DEGs were selected from DEGs among tumor groups that were divided by unsupervised hierarchical clustering under the conditions of |fold change|>2 and P-value<0.01. For gene expression analysis in Figure 2C and 2D, |fold change|>1.5 and P-value<0.01 were applied to obtain DEGs belonging to CRCassigner-30, which was a group of 30 genes with high scores calculated by PAM (nearest shrunken centroids–based method) [33] reported in a previous study [2]. Finally, functional enrichment analysis of the differentially expressed genes was performed using DAVID software [34], in order to identify GO biological processes and Kyoto Encyclopedia of Genes and Genomes (KEGG) pathways represented by the genes in individual clusters with statistical significance.
Molecular subtyping and comparison to published consensus molecular subtype
For molecular subtyping, we applied a hierarchical clustering and nonnegative matrix factorization (NMF) [35–37], using the gene expression profiles from CRC tissues. In brief, NMF consensus clustering method resorts to factor the gene-expression matrix A into the product of two matrices of positive entries, A ∼ WH. Matrix W has size N × k and Matrix H has size k × M. k is much smaller than M. The column of W defines a ‘metagene’, with entry wij the coefficient of gene i in metagene j. The columns of Matrix H represent metagene expression pattern of the corresponding sample, with each entry hij representing the expression level of metagene i in sample j. Given factorization of A ∼ WH, Matrix H can be used to determine the cluster membership: sample j is placed in cluster i if the hij is the largest entry in column j [35]. Differentially expressed genes were selected using complete linkage for hierarchical clustering based on the Pearson coefficient correlation algorithm, and these were utilized for NMF with MATLAB software. Molecular subtyping was performed with consensus clustering-based NMF, according to the optimal number of clusters, which was determined based on the cophenetic correlation coefficient (coph) values [37, 38] determined in our previous study (coph=0.8961). We performed a repeated NMF clustering analysis using the same set of samples with 1,764 DEGs under the same condition, and confirmed that the four groups divided by type 1 clustering were reproducible (93% matched). To subtype our samples by another method, we adopted Ward’s minimum variance method in combination with Euclidean distance and weighted gene co-expression network analysis (WGCNA) [39]. WGCNA was used to verify the quality of our microarray data, and Ward’s minimum variance method according to Euclidean distance was used to cluster 101 colorectal tumors. To compare our molecular subtypes with the previously reported CMSs, we used CMSclassifier [3], which includes the random forest classifier, as well as a ‘single-sample predictor’ (SSP) classifier. Further, the prognosis predicting values of our molecular subtypes and CMS subtypes were compared and analyzed by ‘CMSclassifier’.
KRAS and BRAF mutation analysis
KRAS mutation analysis was performed via pyrosequencing, using the CE-IVD Marked PyroMark KRAS Kit (QIAGEN, Hilden, Germany), according to the manufacture’s protocols (Therascreen KRAS Pyro Kit Handbook, version 1, July 2011). For each sample, 10 ng of genomic DNA was used for analysis of mutations in codons 12 and 13 and another 10 ng DNA was utilized to identify mutations in codon 61. Pyrosequencing was also employed for BRAF mutation analysis to detect the BRAF V600E mutation, as previously reported [40].
Immunohistochemistry
Paraffin-embedded tissue blocks were cut into 4-μm sections. Immunohistochemical analysis was performed using a Ventana XT automated stainer (Ventana Corporation, Tucson, AZ, USA) with antibodies against the following: MutL homolog 1 (MLH1, diluted 1:50, BD Biosciences, San Jose, CA, USA), MutS homolog 2 (MSH2, diluted 1:200, BD Biosciences), MutS homolog 6 (MSH6, diluted 1:300, Cell Signaling Technology, Beverly, MA, USA), and PMS1 homolog 2 (PMS2, diluted 1:40, Cell Marque, Rocklin, CA, USA).
Analysis of clinical and pathological parameters
All statistical analyses were performed using SPSS software, version 21.0.0.0 for Windows (SPSS Inc., Chicago, IL, USA). To analyze each clinicopathological parameter, the Kruskal-Wallis test, Mann-Whitney test, Fisher’s exact test, or the χ2-test were used, depending on the purpose; all P-values <0.05 were considered significant. Patient survival statistics were analyzed using the Kaplan-Meier method and log-rank test, and multivariate analyses were performed using the Cox regression model. Hazard ratios (HRs) and corresponding 95% confidence intervals (CIs) are presented.
Abbreviations
CRC, colorectal cancer; CMS, consensus molecular subtype; MSI, microsatellite instability; NMF, nonnegative matrix factorization; DEG, differentially expressed gene; DFS, disease-free survival
Author contributions
These three authors (YK, MP, and MJ) contributed equally to this study. YK designed the study, performed data analyses, interpreted the data, and helped to draft the manuscript. MP designed the study, performed data analyses, and interpreted the data. MJ and WKK performed data analyses, interpreted the data, and helped to draft the manuscript. SY, HJL, SH, TIK, and BM acquired the data. SK and SP performed data analyses, and interpreted the data. HK designed the study, performed data analyses, interpreted the data, helped to draft the manuscript, and supervised the study. All authors read and approved the final manuscript.
ACKNOWLEDGMENTS
This research was supported by a grant of the Korea Health Technology R&D Project through the Korea Health Industry Development Institute (KHIDI), funded by the Ministry of Health & Welfare, Republic of Korea (grant number: HI14C1324).
CONFLICTS OF INTEREST
The authors declare no conflict of interest.
Writing assistance
This manuscript was edited by Bioscience Writers, LLC (Houston, Texas, USA).
REFERENCES
1. Hoadley KA, Yau C, Wolf DM, Cherniack AD, Tamborero D, Ng S, Leiserson MD, Niu B, McLellan MD, Uzunangelov V, Zhang J, Kandoth C, Akbani R, et al. Multiplatform analysis of 12 cancer types reveals molecular classification within and across tissues of origin. Cell. 2014; 158:929-944.
2. Sadanandam A, Lyssiotis CA, Homicsko K, Collisson EA, Gibb WJ, Wullschleger S, Ostos LC, Lannon WA, Grotzinger C, Del Rio M, Lhermitte B, Olshen AB, Wiedenmann B, et al. A colorectal cancer classification system that associates cellular phenotype and responses to therapy. Nat Med. 2013; 19:619-625.
3. Guinney J, Dienstmann R, Wang X, de Reynies A, Schlicker A, Soneson C, Marisa L, Roepman P, Nyamundanda G, Angelino P, Bot BM, Morris JS, Simon IM, et al. The consensus molecular subtypes of colorectal cancer. Nat Med. 2015; 21:1350-1356.
4. Budinska E, Popovici V, Tejpar S, D’Ario G, Lapique N, Sikora KO, Di Narzo AF, Yan P, Hodgson JG, Weinrich S, Bosman F, Roth A, Delorenzi M. Gene expression patterns unveil a new level of molecular heterogeneity in colorectal cancer. J Pathol. 2013; 231:63-76.
5. Marisa L, de Reyniès A, Duval A, Selves J, Gaub MP, Vescovo L, Etienne-Grimaldi MC, Schiappa R, Guenot D, Ayadi M, Kirzin S, Chazal M, Fléjou JF, et al. Gene expression classification of colon cancer into molecular subtypes: characterization, validation, and prognostic value. PLoS Med. 2013; 10:e1001453.
6. De Sousa E Melo F, Wang X, Jansen M, Fessler E, Trinh A, de Rooij LP, de Jong JH, de Boer OJ, van Leersum R, Bijlsma MF, Rodermond H, van der Heijden M, van Noesel CJ, et al. Poor-prognosis colon cancer is defined by a molecularly distinct subtype and develops from serrated precursor lesions. Nat Med. 2013; 19:614-618.
7. Roepman P, Schlicker A, Tabernero J, Majewski I, Tian S, Moreno V, Snel MH, Chresta CM, Rosenberg R, Nitsche U, Macarulla T, Capella G, Salazar R, et al. Colorectal cancer intrinsic subtypes predict chemotherapy benefit, deficient mismatch repair and epithelial-to-mesenchymal transition. Int J Cancer. 2014; 134:552-562.
8. Schlicker A, Beran G, Chresta CM, McWalter G, Pritchard A, Weston S, Runswick S, Davenport S, Heathcote K, Castro DA, Orphanides G, French T, Wessels LF. Subtypes of primary colorectal tumors correlate with response to targeted treatment in colorectal cell lines. BMC Med Genomics. 2012; 5:66.
9. Kang J, Lee HW, Kim IK, Kim NK, Sohn SK, Lee KY. Clinical implications of microsatellite instability in T1 colorectal cancer. Yonsei Med J. 2015; 56:175-181.
10. Knickelbein K, Zhang L. Mutant KRAS as a critical determinant of the therapeutic response of colorectal cancer. Genes Dis. 2015; 2:4-12.
11. Downward J. Ras signalling and apoptosis. Curr Opin Genet Dev. 1998; 8:49-54.
12. Zaanan A, Cuilliere-Dartigues P, Guilloux A, Parc Y, Louvet C, de Gramont A, Tiret E, Dumont S, Gayet B, Validire P, Fléjou JF, Duval A, Praz F. Impact of p53 expression and microsatellite instability on stage III colon cancer disease-free survival in patients treated by 5-fluorouracil and leucovorin with or without oxaliplatin. Ann Oncol. 2010; 21:772-780.
13. Hoshida Y, Villanueva A, Kobayashi M, Peix J, Chiang DY, Camargo A, Gupta S, Moore J, Wrobel MJ, Lerner J, Reich M, Chan JA, Glickman JN, et al. Gene expression in fixed tissues and outcome in hepatocellular carcinoma. N Engl J Med. 2008; 359:1995-2004.
14. Slattery ML, Herrick JS, Mullany LE, Gertz J, Wolff RK. Improved survival among colon cancer patients with increased differentially expressed pathways. BMC Med. 2015; 13:75.
15. Facoetti A, Nano R, Zelini P, Morbini P, Benericetti E, Ceroni M, Campoli M, Ferrone S. Human leukocyte antigen and antigen processing machinery component defects in astrocytic tumors. Clin Cancer Res. 2005; 11:8304-8311.
16. Mehta AM, Jordanova ES, Kenter GG, Ferrone S, Fleuren GJ. Association of antigen processing machinery and HLA class I defects with clinicopathological outcome in cervical carcinoma. Cancer Immunol Immunother. 2008; 57:197-206.
17. Vermeulen CF, Jordanova ES, ter Haar NT, Kolkman-Uljee SM, de Miranda NF, Ferrone S, Peters AA, Fleuren GJ. Expression and genetic analysis of transporter associated with antigen processing in cervical carcinoma. Gynecol Oncol. 2007; 105:593-599.
18. Vitale M, Rezzani R, Rodella L, Zauli G, Grigolato P, Cadei M, Hicklin DJ, Ferrone S. HLA class I antigen and transporter associated with antigen processing (TAP1 and TAP2) down-regulation in high-grade primary breast carcinoma lesions. Cancer Res. 1998; 58:737-742.
19. Kamarashev J, Ferrone S, Seifert B, Böni R, Nestle FO, Burg G, Dummer R. TAP1 down-regulation in primary melanoma lesions: an independent marker of poor prognosis. Int J Cancer. 2001; 95:23-28.
20. Atkins D, Breuckmann A, Schmahl GE, Binner P, Ferrone S, Krummenauer F, Störkel S, Seliger B. MHC class I antigen processing pathway defects, ras mutations and disease stage in colorectal carcinoma. Int J Cancer. 2004; 109:265-273.
21. Kasajima A, Sers C, Sasano H, Johrens K, Stenzinger A, Noske A, Buckendahl AC, Darb-Esfahani S, Muller BM, Budczies J, Lehman A, Dietel M, Denkert C, Weichert W. Down-regulation of the antigen processing machinery is linked to a loss of inflammatory response in colorectal cancer. Hum Pathol. 2010; 41:1758-1769.
22. Nastase A, Pâslaru L, Niculescu AM, Ionescu M, Dumitraşcu T, Herlea V, Dima S, Gheorghe C, Lazar V, Popescu I. Prognostic and predictive potential molecular biomarkers in colon cancer. Chirurgia (Bucur). 2011; 106:177-185.
23. Jiang L, Kon N, Li T, Wang SJ, Su T, Hibshoosh H, Baer R, Gu W. Ferroptosis as a p53-mediated activity during tumour suppression. Nature. 2015; 520:57-62.
24. Yamashita K, Katoh H, Watanabe M. The homeobox only protein homeobox (HOPX) and colorectal cancer. Int J Mol Sci. 2013; 14:23231-23243.
25. Xu L, Gao Y, Chen Y, Xiao Y, He Q, Qiu H, Ge W. Quantitative proteomics reveals that distant recurrence-associated protein R-Ras and Transgelin predict post-surgical survival in patients with Stage III colorectal cancer. Oncotarget. 2016; 7:43868-43893.
26. Jang BG, Kim HS, Chang WY, Bae JM, Oh HJ, Wen X, Jeong S, Cho NY, Kim WH, Kang GH. Prognostic significance of stromal GREM1 expression in colorectal cancer. Hum Pathol. 2017; 62:56-65.
27. Maecker HT, Todd SC, Levy S. The tetraspanin superfamily: molecular facilitators. FASEB J. 1997; 11:428-442.
28. Hemler ME. Tetraspanin functions and associated microdomains. Nat Rev Mol Cell Biol. 2005; 6:801-811.
29. Sztupinszki Z, Győrffy B. Colon cancer subtypes: concordance, effect on survival and selection of the most representative preclinical models. Sci Rep. 2016; 6:37169.
30. Bolstad BM, Irizarry RA, Astrand M, Speed TP. A comparison of normalization methods for high density oligonucleotide array data based on variance and bias. Bioinformatics. 2003; 19:185-193.
31. Lee HJ, Suk JE, Patrick C, Bae EJ, Cho JH, Rho S, Hwang D, Masliah E, Lee SJ. Direct transfer of alpha-synuclein from neuron to astroglia causes inflammatory responses in synucleinopathies. J Biol Chem. 2010; 285:9262-9272.
32. Hwang D, Rust AG, Ramsey S, Smith JJ, Leslie DM, Weston AD, de Atauri P, Aitchison JD, Hood L, Siegel AF, Bolouri H. A data integration methodology for systems biology. Proc Natl Acad Sci U S A. 2005; 102:17296-17301.
33. Tibshirani R, Hastie T, Narasimhan B, Chu G. Diagnosis of multiple cancer types by shrunken centroids of gene expression. Proc Natl Acad Sci U S A. 2002; 99:6567-6572.
34. Huang W, Sherman BT, Lempicki RA. Systematic and integrative analysis of large gene lists using DAVID bioinformatics resources. Nat Protoc. 2009; 4:44-57.
35. Brunet JP, Tamayo P, Golub TR, Mesirov JP. Metagenes and molecular pattern discovery using matrix factorization. Proc Natl Acad Sci U S A. 2004; 101:4164-4169.
36. Gao Y, Church G. Improving molecular cancer class discovery through sparse non-negative matrix factorization. Bioinformatics. 2005; 21:3970-3975.
37. Kim H, Park H. Sparse non-negative matrix factorizations via alternating non-negativity-constrained least squares for microarray data analysis. Bioinformatics. 2007; 23:1495-1502.
38. Gaujoux R, Seoighe C. A flexible R package for nonnegative matrix factorization. BMC Bioinformatics. 2010; 11:367.
39. Langfelder P, Horvath S. WGCNA: an R package for weighted correlation network analysis. BMC Bioinformatics. 2008; 9:559.
40. Laurini JA, Aoun P, Iqbal J, Chan W, Greiner TC. Investigation of the BRAF V600E mutation by pyrosequencing in lymphoproliferative disorders. Am J Clin Pathol. 2012; 138:877-883.