
Introduction
Earlier studies [1-4] showed transcription factors (TFs) binding and histone modifications (HMs) were critical for gene expression, and the abnormities of TFs binding and HMs may affect the cell fate such as differentiation and apoptosis [5]. The ability to comprehend and predict their effects is vital to develop treatments for hundreds of human diseases, including leukemia [6], diabetes [7] and various cancers such as prostate cancer [8, 9], lung cancer [10] and breast cancer [11, 12], etc.
The significant regulations of mammalian gene expression are deemed to occur at the level of transcriptional initiation and elongation [13]. TFs can activate or block the initiation of gene transcription by binding to specific DNA sequences in enhancers or promoters [14, 15] or recruiting some chromatin-modifying enzymes to induce the changes of chromatin structure [16]. HMs are recognized to activate or inhibit transcription by either modulating the local chromatin structure to control TFs accessibility [17] or directly recruiting related enzymes [18].
In previous studies, by analyzing the relations of HMs and TF binding to gene expression, Cheng et al. [19] found that HMs or TFs binding in different positions show different predictive abilities, and they suggested HMs and TF binding may be redundant for predicting gene expression levels. Karlic et al. [20] noticed that different combinations of HMs are needed for predicting the expression levels of genes with different CpG content promoters. In this study, we investigate the relative contribution of each TF (HM) or combination of them to gene expression by constructing a support vector regression (SVR) model for the genome-wide 15 TFs binding data, 10 HMs profiles and DNase-I hypersensitivity data in three mammalian, and verify their universality in H1-HESc, Gm12878 and K562 cell lines. We further explore how TFs, HMs and gene expression interact with each other. At last, we research the effects of TFs and HMs on prediction for genes in independent biological processes.
Results and discussions
The “Optimal” TFs for predicting gene expression are cell-specific
TFs can bind to specific DNA elements and stimulate or suppress gene transcription. There are approximately 1700 to 1900 TFs in human, including 1391 manually curated sequence-specific TFs [5]. In this study, we download respectively available 57, 87 and 96 TFs for H1-hESc (human embryonic stem cells), Gm12878 (B-lymphoblastoid cell) and K562 (erythrocytic leukemia cells) which are immortal [21] and have the most completed data [22]. Then the top 15 TFs which are vital TFs for predicting gene expression levels are chosen by using stepwise regression analysis (the usage about stepwise regression analysis is detailed in Supplementary information), and regarded as the “optimal” TFs for each cell line (shown in Figure 1). We observe that different “optimal” TFs are needed for different cell lines, indicating TFs binding is a dynamical process that depends on tissues or cell lines. A likely explanation for these phenomena may be the essential difference among the three cell lines, necessitating the selection of alternative TFs [2].
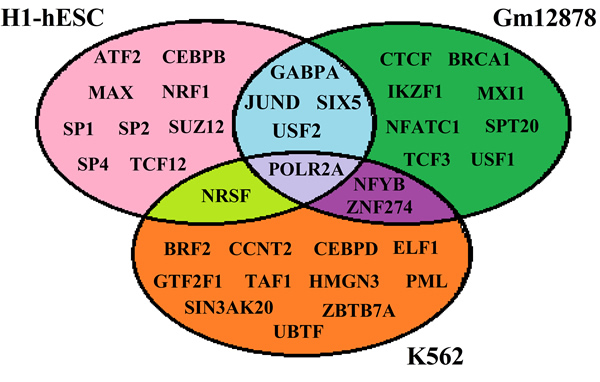
Figure 1: List of the TFs involved in the current study for H1, Gm12878 and K562.
TFs and HMs predict gene expression levels
The presences or absences of some TFs and HMs are correlated with gene expression levels [1, 16, 20, 23]. To better understand the relations between TFs (HMs) and gene expression levels, we construct log-linear model and non-linear SVR model for three immortalized human cell lines: H1-hESC, GM12878 and K562. The predictive power (R2) of the two models in 10-fold cross-validation are shown in Table 1 and Supplementary file Table S1.
The results show that TFs, HMs and DNase have stronger correlation with gene expression levels in SVR model than in log-linear model. It may be resulted from the non-linear relationships between TFs (HMs) and gene expression [19, 24]. Therefore, SVR model is applied in the remainder of this work, despite a remarkable increase in required CPU time.
Different HMs and TFs are required for predicting gene expression levels
In order to check whether all HMs (TFs) are equally important for predicting gene expression, we construct SVR models for all possible combinations of 10 HMs and DNase or 15 TFs, which results in 2047 HMs+DNase combination modes and 32767 TFs combination modes. The detailed information and statistical results are depicted in Supplementary tables 1-6 and Figure 2. The distributions of Pearson correlation coefficient (PCC) for these 2047 HMs+DNase combination modes in the H1-hESc, GM12878 and K562 are respectively shown in Figure 2A, 2C and 2E). The distributions of PCC for these 32767 TFs combination modes in the H1-hESc, GM12878 and K562 are shown in Figure 2B, 2D and 2F). The maximum PCC for combination modes of different amounts of HMs or different amounts of TFs is connected by a black curve. It is found that the predictive powers will basically reach summit in the maximum combination of four HMs or four TFs. The combination modes of maximum prediction accuracy for the four factors (i.e. four HMs or four TFs) are described in Table 2. These results show that all HMs+DNase or TFs are not equally important and there are statistical redundancies within HMs (TFs).
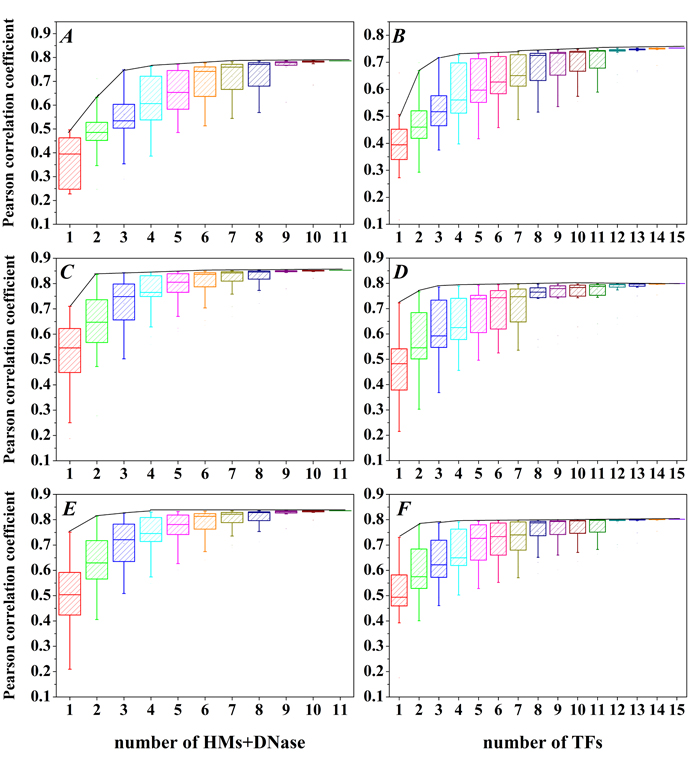
Figure 2: The PCC distributions for all combination of 15 TFs or 10 HMs and DNase. A., B. H1, C., D. Gm12878 and E., F. K562 cell line. X-axis represents the combination of c kinds of HMs and DNase (choose c out of 10 HMs and DNase, c = 1,2,…,11) or d kinds of TFs (choose d out of 15 TFs, d = 1,2,…,15), and the black curves represent the maximum PCC for the combination mode of c HMs and DNase or the combination mode of d TFs.
In addition, to further identify which HMs contribute more to predicting gene expression, we focus on the combinations modes of 4 kinds of HMs. We study all four-HMs modes whose PCC reach at least 95% of the all-HMs mode (PCCall_H1 = 0.786, PCCall_Gm12878 = 0.852 and PCCall_K562 = 0.836). There are finally 58, 116 and 117 combination modes, respectively, for H1-hESc, Gm12878 and K562, which is an enough large number to evaluate the over-representation analysis. By investigating the appearance times of each HM in these combination modes, we find the following results (see Figure 3):
Firstly, H3K36me3 appears in all these modes for the three cell lines, and it may be vital for gene expression. The better predictive results (PCCH3K36me3_H1 = 0.496, PCCH3K36me3_Gm12878 = 0.698 and PCCH3K36me3_K562 = 0.750) for gene expression levels are obtained by using single H3K36me3 information parameter. Our results are consistent with previous work, Hahn et al. showed H3K36me3 is a intragenic mark of active genes, and it is associated with two categories of genes [25]. Nanty et al. noticed that H3K36me3 has bimodalities in gene-body, which would influence DNA methylation levels and help shape gene-body CpG density profiles [26].
Secondly, for the H1-hESc, each of H3K9ac, H3K27me3 and H3K4me3 appears in nearly half of the 58 combination modes (53.45%, 43.10% and 43.10%, respectively), while other HMs appear in at most 29.31% of 58 modes (shown in Figure 3A). Thus, H3K9ac, H3K27me3 and H3K4me3 are more reliable information parameters than other HMs in H1-hESc, which consist with previous study [23]. Furthermore, we check the times that H3K9ac, H3K27me3, H3K4me3 and H3K36me3 appear together (shown in Figure 3B). We notice that H3K4me3 and H3K9ac appear simultaneously only seven times in the 58 modes, it may be that the information they represented are not simultaneously needed in 58 modes because their information redundancy, which is supported by the high correlation (PCC = 0.905). H3K4me3 and H3K27me3 (H3K27me3 and H3K9ac) occur together eight times in the 58 modes, and the correlation between H3K4me3 and H3K27me3 (H3K27me3 and H3K9ac) is PCC = 0.507 (PCC = 0.502), suggesting that they are partially redundant. However, we find H3K36me3 combines with one of H3K4me3, H3K27me3 and H3K9ac respectively appear in 23, 25 and 31 times, showing that the information they provide may be non-redundant. In fact, the correlations respectively are PCC = 0.097, PCC = 0.203 and PCC = 0.202.
Thirdly, for the Gm12878 and K562 cell lines, even though other HMs except H3K36me3 appear in similar level (about 30%, see Figure 3C and 3D), the combination of H3K36me3 and H3K79me2 can effectively increase the predictive power. We find the predictive accuracy of this combination in the four-HMs modes reaches at least 97.59% of the all-HMs mode.
Similarly, we focus on those four-TFs modes whose PCC reach at least 95% of the all-TFs mode (PCCall_H1 = 0.753, PCCall_Gm12878 = 0.799, PCCall_K562 = 0.802), 85, 172 and 345 modes are lastly remained for H1-hESc, Gm12878 and K562, respectively. We obtain that POLR2A is ubiquitous in all studied modes for the three cell lines and it can faithfully model gene expression levels (PCCPOLR2A_H1 = 0.661, PCCPOLR2A_Gm12878 = 0.677 and PCCPOLR2A_K562 = 0.730). Previous researches had shown the importance of this mark which is linked to the synthesis of messenger RNA [27, 28]. For the K562 cell line, we also find the combination of POLR2A and ZBTB7A in the four-TFs modes reaches at least 97.58% of the all-TF mode. At last, to verify whether the above inferences depend on four-factors modes, we implement same analysis for five-factors and six-factors modes and analogous consequences are found.
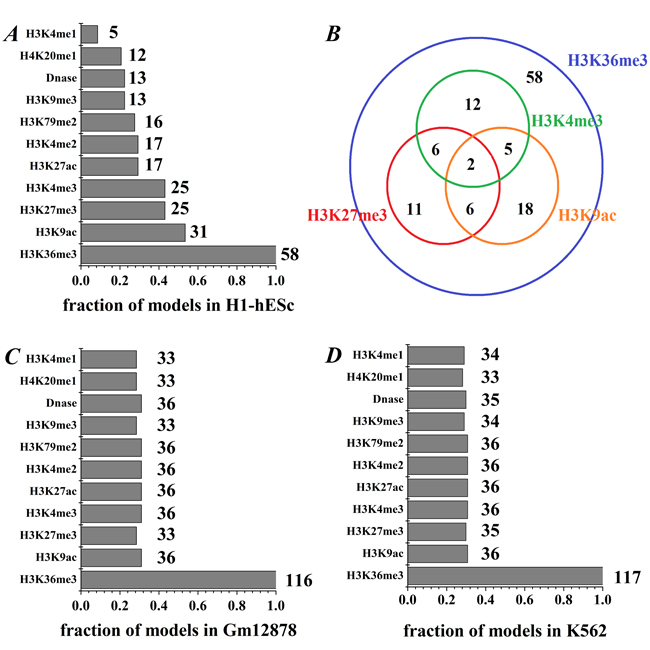
Figure 3: The appearance frequency of each HM in the studied modes. A. The frequency of each HM in H1 cell line, where the integer represents the occurrence times in the studied modes. B. Venn diagram shows that the co-occurrence times of the four important HMs. C. and D. The frequency of each HM in Gm12878 and K562.
TFs and HMs provide similar effect on predicting genome-wide gene expression
As shown in Table 1, TFs and HMs model both obtain high predictive power, and TF+HM+DNase model only get similar predictive accuracy with them, indicating TFs binding and HMs may offer similar effects on genome-wide gene expression. To quantify this phenomenon, the PCC between the predictive values of TFs model and the predictive values of HMs model is respectively calculated for the three cell lines. Strong correlations (PCCH1 = 0.827, PCCK562 = 0.908, and PCCGm12878 = 0.895 respectively) support that TFs and HMs offer similar effects on genome-wide gene expression and show the statistical redundancies also exist between TFs and HMs. Although TF+HM+DNase model does not obtain obviously improved predictive ability, it tends to more stable than TFs or HMs model (i.e. smaller RMSE between R2 and CV-R2 than TFs or HMs model).
Table 1: Prediction accuracy of log-linear and SVR model.
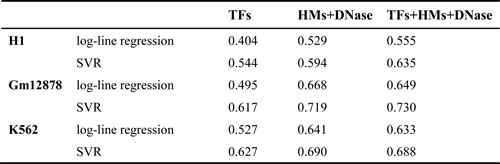
The CV-R2 is the average R2 for the 10 fold cross-validation.
Regulation mechanism leads to statistical redundancy
To investigate the fundamental source of statistical redundancies among factors, the PCC between and within TFs and HMs are calculated for the three cell lines (see Figure 4). High correlations among these factors indicate the statistical redundancies maybe come from the regulation mechanism (i.e. two factors have similar regulatory functions). To verify the above supposition, the target genes of TFs or HMs are predicted by using the software BETA [29]. Then, the co-regulated and solo-regulated targets for TFs (HMs) whose PCC > 0.85 within TFs (HMs) and the co-regulated and solo-regulated targets for TF and HM whose PCC > 0.70 between TF and HM in H1-hESc cell lines are counted. The results present that the co-regulated genes are far more than solo-regulated genes for those factors (Figure 5 and Supplementary Figure S1, similar work is done for Gm12878 and K562 (not shown)), which effectively support our inferences. It is worth noting that some factors with similar regulatory functions have been demonstrated, for instance, CEBPB and SP1 which have strong correlation both can activate the expression of the insulin receptor gene [30]. Enrichments of H3K4me2 or H3K4me3 at TSS are positively correlated to the extents of gene activities [31], etc.
Table 2: The combination modes of the maximum prediction accuracy for four factors.
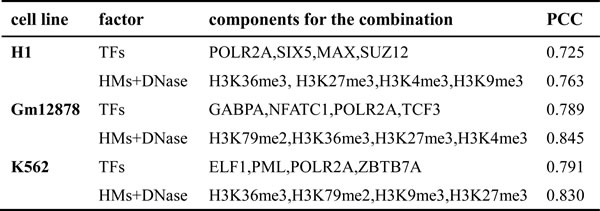
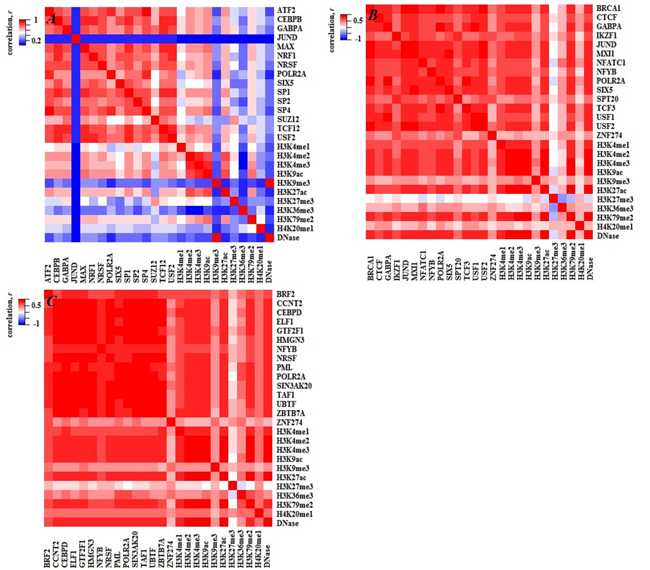
Figure 4: Heatmaps of PCC both within TFs (HMs) and between TFs and HMs for the three cell lines. A., B. and C. represent H1, Gm12878 and K562 cell lines, respectively.
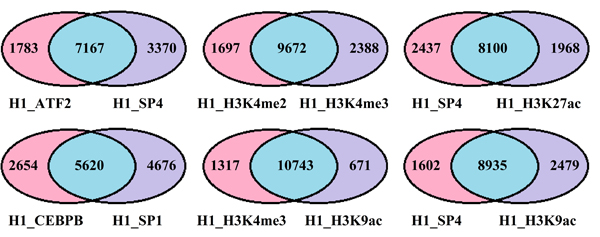
Figure 5: Venn diagram shows the number of the co-regulated and solo-regulated genes within and between TFs and HMs. The blue depicts the co-regulated target genes, the pink and purple represent solo-regulated genes by factors attach to the charts, respectively.
Construction of TFs, HMs and gene expression interaction network
For further investigating how TFs, HMs interact with each other and the effects of TFs and HMs on gene expression, the interaction networks among TFs, HMs and gene expression are constructed, where Partial correlation coefficient is used to estimate inherent relationship between each paired factors and they are calculated as the edges of the networks. The entire process is done by R package ‘GeneNet_1.2.13’. Finally, 60 most significant edges are selected out for visualization (Figure 6 and Supplementary Figure S2).
For the three cell lines, we notice that H3K36me3 and POLR2A have direct correlations with gene expression levels and both promote the expression of genes, which maybe an interpretation why H3K36me3 and POLR2A are important in the section 2.3. Moreover, we find there is a higher positive correlation between H3K4me1 and H3K4me2 (between H3K4me2 and H3K4me3) in three cell lines. But the higher positive correlation between ATF2 and SP4 (between USF1 and USF2) is cell line specific. Besides, based on the interactive networks, we know that the gene expressions not only are affected by TFs and HMs, but also influenced by the interactions among factors (detailed in the legend of Figure 6). In order to check the robustness of the networks, we implement 50 times simulations by randomly removing 200 genes and same networks are found.
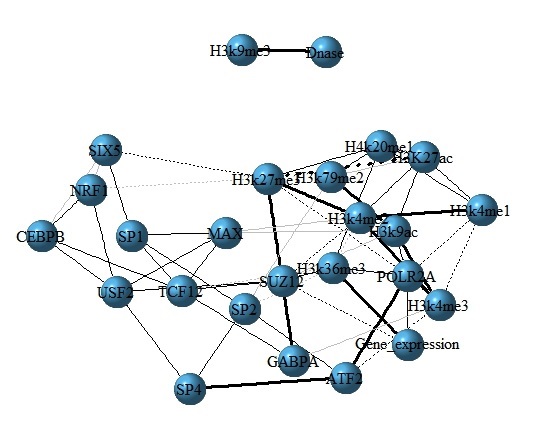
Figure 6: The interaction network among TFs, HMs and gene expression for H1 cell line. In the network, nodes represent TFs, HMs and gene expression. Edges show the partial correlation coefficient between each paired factors, where the dash lines represent negative correlations and solid lines represent positive correlations. Bolder the line is, the stronger correlation it represents.
The effects of TFs and HMs on prediction are different for genes in independent biological processes
In section 2.4, we find that TFs and HMs model offer similar predictive power for genome-wide gene expression. In order to further investigate the effects of TFs and HMs on prediction for genes in independent biological processes, we focus on the Gene Ontology biological processes [32, 33] for the high expression genes in the three cell lines (based on RPKM values, the top fifteen percent of all genes are selected as high expressed genes [3, 23]). Firstly, biological processes containing less than 30 genes are discarded, 1104, 1136 and 1070 sets of genes are remained, respectively, for H1-hESc, Gm12878 and K562 cell line. In order to ensure the effectiveness of statistics, the 604, 741 and 398 sets of genes for H1-hESc, Gm12878 and K562 cell line are lastly remained when TFs or HMs model’s Benjamini-Hochberg-corrected P-value [34] is fewer than 0.05..
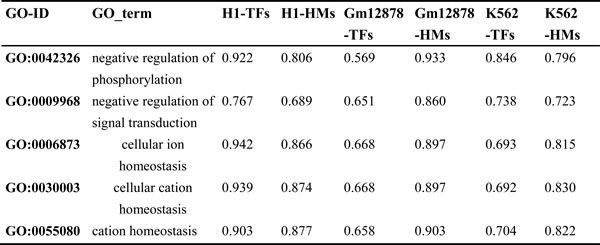
To quantify the effects of TFs and HMs on prediction for genes in independent biological processes, the ratio of PCC of TFs model to PCC of HMs model for these biological processes is calculated (see Supplementary tables 7-9 and Table 3). Of the 604, 741 and 398 biological processes for the three cell lines, it is found that 21, 89 and 24 processes show that the effect of HMs on prediction is superior to the effect of TFs (the ratio ranges from 0.59 to 0.90); 254, 235 and 65 processes show that the effect of TFs on prediction is superior to the effect of HMs (the ratio ranges from 1.10 to 2.01); but TFs and HMs offer similar effect on prediction in others 329, 418 and 309 processes (the ratio ranges from 0.90 to 1.10). In addition, we also notice that this phenomenon exists in same biology processes but in different cell lines (shown in Table 4). In conclusion, even though TFs and HMs offer similar effect on expression levels of genome-wide genes, the effects of TFs and HMs on predictive abilities are different for genes in some independent biological processes.
Table 3: List of three random GO-ID for each ratio range in the three cell lines.
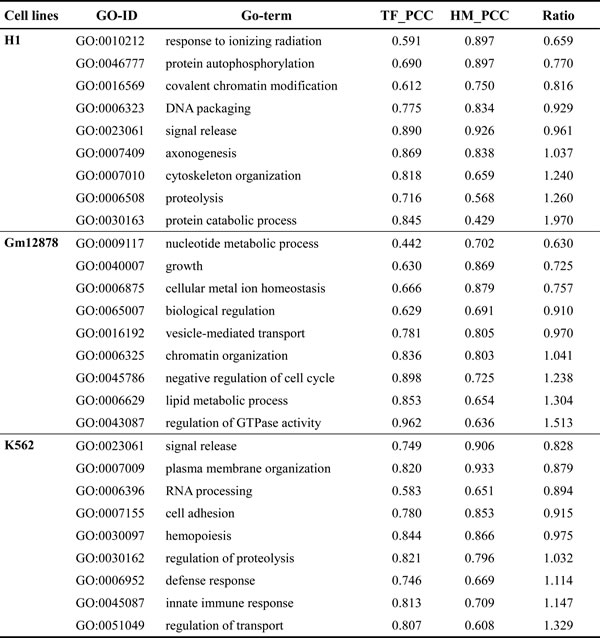
Table 4: List of five random GO-ID where TFs and HMs model show distinct PCC for the same biological process in the different cell lines.
Discussion
The next-generation sequencing technology [35] provides large numbers of data that enable a more intensive research the interaction among TFs, HMs and DNA to be possible. Through a series of analyses and researches, the following interesting results can be put forward: (1) The selected TFs obtain better predictive than previous studies. Budden et al. [2] investigated the relation between core TFs and gene expression in Gm12878 by using similar method, their predictive accuracy was only CV-R2 = 0.390. But the predictive accuracy is CV-R2 = 0.617 in our study, this conclusion indicates that TFs studied in our paper may contain more information than those core TFs or can functionally substitute for some core TFs. The compared results are shown in Table 5. (2) Based on SVR model, the relationships between HMs and gene expression are investigated in Gm12878, and better results are obtained. For instance, McLeay et al. [36] studied the effects of 7 HMs and DNase on gene expression by a log-linear regression model, their predictive accuracy is CV-R2 = 0.412, but the predictive power in our study is CV-R2 = 0.719, which further imply a non-linear relations between HMs and gene expression. Dong et al. [24] constructed a two-step model to predict genes expression levels, they only use the chromatin feature density of ‘bestbin’ as predictor which ignores the information in other bins. Comparing with their accuracy PCC = 0.82, we achieve PCC = 0.85. The compared results are shown in Table 5. (3) In section 2.3 and 2.6, we and others observe that POLR2A, H3K4me3 and H3K27me3 can activate or inhibit gene expression [27, 28, 36-38], these not only show the obtained conclusions are accurate, but also indicate our model and methods may be reasonable.
Though improvements have been acquired, there are still some insufficiencies. In statistical prediction, the jackknife test is deemed the least arbitrary which had been elegantly demonstrated by Eqs. (28-30) in [39]. Hence, this method had been widely used by researchers to test the quality of information parameters (see, e.g., [40-46]). However, to reduce the computational time, the 10-fold cross validation is adopted in this paper as done by many researchers who use SVM as the prediction engine.
As future works, we will make our efforts to adopt more precise test method, and provide a publicly accessible and user-friendly web-server as presented in a series of recent publications [47-51] to effectively enhance their impacts [52]. Meanwhile, more precise and faster sequence analysis tools [53, 54] will be fully utilized in follow-on work.
Table 5: The predictive results compare with other studies.
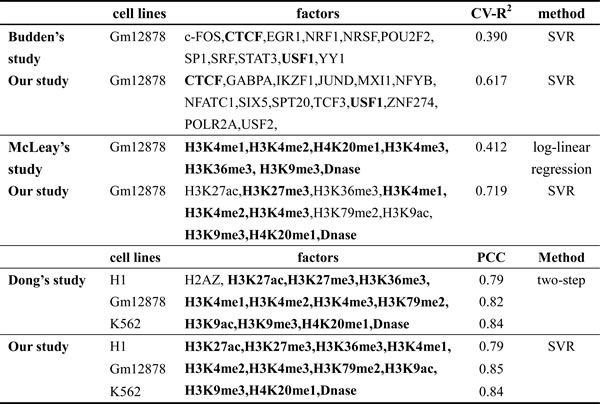
The bold represents co-factors in the comparison.
Materials and methods
Available data and implementation
The RefSeq genes of the human genome (hg19) come from the UCSC database (http://genome.ucsc.edu/cgi-bin/hgTables), which contains transcription start site (TSS). Genes starting with NM are chosen out (i.e. the mature messenger RNA). In order to prevent the possibility that some genes may be the alternative transcripts of the same gene, only one of the genes which have the same TSS is retained. At last, a set of 19120 genes is left for remainder analysis.
All the TFs binding data, HMs profiles and DNase-I hypersensitivity data for H1-hESc, K562 and Gm12878cell lines are downloaded from the UCSC database (detail in Figure 1, Supplementary file Table S2 and Supplementary file Table S3). Because the DNase-I hypersensitivity data for the three cell lines are in hg18 coordinate, the UCSC liftOver tool [55] is used to convert the hg18 data into hg19. For visualization, the raw data is converted to bed format by using BEDtools software [56].
The expression data of the H1-hESc, Gm12878 and K562 are measured by applying the RNA-seq techniques. The mapped RNA-seq reads reported in this paper are depicted in the Gene Expression Omnibus database (GSM915329 (H1-hESc), GSM958730 (Gm12878) and GSM958731 (K562)). The expression levels of all genes are calculated according to the reads per kilobase of exon model per million mapped reads and represented as RPKM value [57].
Transcription factors binding signal
The DNA regions flanking the TSS (-10~10kb) of all RefSeq genes are separated into 100 bins, each of 200 bps in size. Based on our previous study [3], signals of TFs binding are normalized by using the following Eq. (1),
![]() (1)
(1)
in which Nkij represents normalized signal, nkij is the total tags that k-th TF locates in the j-th bin of the i-th gene, 109 is used to eliminate the difference of magnitude with RPKM. 200 is the length of the j-th bin, and nktag is the total tags of the k-th TF. This results in a 19120×100 matrix N (matrix element is Nkij (i = 1, 2,…,19120; j = 1,2,…,100; k = 1,2,…,15) for the k-th TF.
HMs and DNase binding signal
Similarly, the DNA regions flanking the TSS (-2~2kb) of all RefSeq genes are divided into 20 bins, with each consisting of 200 bps. Then, the signals of HMs and DNase binding are normalized by using the following Eq. (2),
![]() (2)
(2)
where Hlim represents the normalized signal, hlim is the total tags that l-th HM or DNase locates in the m-th bin of the i-th gene, and hltag is the total tags of the l-th HM or DNase. This results in a 19120×20 matrix H (matrix element is Hlim (m = 1,2,…,20; l = 1,2,…,11) for the l-th HM or DNase.
Calculation of TFs association strength (TFAS)
For the i-th gene and the k-th TF, TFAS is calculated by the following Eq. (3)
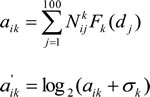 (3)
(3)
where Nkij is computed by Eq.(1), Fk is the normalized Gaussian kernel density function, where the bandwidth is calculated by the rule of thumb [58]. dj is a relative distance between the midpoint of the j-th bin and the corresponding gene’s TSS, the σk is a pseudocount (the detailed information is displayed in supplementary information). For 19120 genes and 15 TFs, the TFAS profiles are denoted by the 19120×15 matrix a (the matrix element is![]() ).
).
Calculation of HMs or DNase association strength (HMAS)
For the i-th gene and the l-th HM or DNase, the HMAS is calculated by using the following Eq. (4)
 (4)
(4)
where Hlim is computed by Eq.(2), the σi is a pseudocount, the HMAS profiles are denoted by the 19120×11 matrix b (the matrix element is![]() ).
).
Log-linear regression model and non-linear SVR model
Combining with the TFASs, HMASs and multivariate linear regression, the log-linear regression model is derived by the following Eq. (5)
![]() (5)
(5)
in which Li is the RPKM value of the i-th gene, σ is a pseudocount, υ is the intercept, αk and βl are the regression coefficients.
Based on the support vector machines, a SVR model is constructed by using the Eq. (6)
![]() (6)
(6)
in which μ is the intercept, K(Xi, X) is the kernel function and γi is the Lagrange multiplier. Matrix X is the matrix a (calculated by Eq.(3)) and/or the matrix b (calculated by Eq.(4)), Xi is the i-th row elements of matrix X. The entire process is done by libSVM software [59].
Abbreviations
TF, transcription factor; HM, histone modification; SVR, support vector regression; PCC, Pearson correlation coefficient; TSS, transcription start site; RPKM, reads per kilobase of exon model per million mapped reads; TFAS, Transcription factors association strength; HMAS, histone modifications or DNase association strength;.
Acknowledgments
The authors thank Ph.D. Li-Rong Zhang for illumination discussions. This work is supported by a grant from the National Natural Science Foundation of China (Nos. 31460234, 11647310).
Conflicts of interest
The authors declare no conflict of interest.
References
1. Ouyang ZQ, Zhou Q, Wong WH. ChIP-Seq of transcription factors predicts absolute and differential gene expression in embryonic stem cells. Proc Natl Acad Sci U S A. 2009; 106: 21521-6. doi: 10.1073/pnas.0904863106.
2. Budden DM, Hurley DG, Cursons J, Markham JF, Davis MJ, Crampin EJ. Predicting expression: the complementary power of histone modification and transcription factor binding data. Epigenetics Chromatin. 2014; 7: 36. doi: 10.1186/1756-8935-7-36.
3. Zhang LQ, Li QZ, Su WX, Jin W. Predicting gene expression level by the transcription factor binding signals in human embryonic stem cells. Biosystems. 2016; 150: 92-8. doi: 10.1016/j.biosystems.2016.08.011.
4. Budden DM, Hurley DG, Crampin EJ. Predictive modelling of gene expression from transcriptional regulatory elements. Brief Bioinform. 2015; 16: 616-28. doi: 10.1093/bib/bbu034.
5. Vaquerizas JM, Kummerfeld SK, Teichmann SA, Luscombe NM. A census of human transcription factors: function, expression and evolution. Nat Rev Genet. 2009; 10: 252-63. doi: 10.1038/nrg2538.
6. Lokody I. Histone methyltransferase mutations promote leukaemia. Nat Rev Cancer. 2014; 14: 214-5. doi: 10.1038/nrc3705.
7. Gray SG, De Meyts P. Role of histone and transcription factor acetylation in diabetes pathogenesis. Diabetes Metab Res Rev. 2005; 21: 416-33. doi: 10.1002/dmrr.559.
8. Shi Y. Histone lysine demethylases: emerging roles in development, physiology and disease. Nat Rev Genet. 2007; 8: 829-33. doi: 10.1038/nrg2218.
9. Chen Z, Wang LG, Wang QB, Li W. Histone modifications and chromatin organization in prostate cancer. Epigenomics. 2010; 2: 551-60. doi: 10.2217/epi.10.31.
10. Tania M, Khan MA, Fu JJ. Epithelial to mesenchymal transition inducing transcription factors and metastatic cancer. Tumour Biol. 2014; 35: 7335-42. doi: 10.1007/s13277-014-2163-y.
11. Wang ZT, Chen ZJ, Jiang GM, Wu YM, Liu T, Yi YM, Zeng J, Du J, Wang HS. Histone deacetylase inhibitors suppress mutant p53 transcription via HDAC8/YY1 signals in triple negative breast cancer cells. Cell Signal. 2016; 28: 506-15. doi: 10.1016/j.cellsig.2016.02.006.
12. Yarosh W, Barrientos T, Esmailpour T, Lin LM, Carpenter PM, Osann K, Anton-Culver H, Huang T. TBX3 is overexpressed in breast cancer and represses p14 ARF by interacting with histone deacetylases. Cancer Res. 2008; 68: 693-9. doi: 10.1158/0008-5472.CAN-07-5012.
13. Maston GA, Evans SK, Green MR. Transcriptional regulatory elements in the human genome. Annu Rev Genomics Hum Genet. 2006;7:29-59.
14. Shlyueva D, Stampfel G, Stark A. Transcriptional enhancers: from properties to genome-wide predictions. Nat Rev Genet. 2014; 15: 272-86. doi: 10.1038/nrg3682.
15. Yip KY, Cheng C, Bhardwaj N, Brown JB, Leng J, Kundaje A, Rozowsky J, Birney E, Bickel P, Snyder M, Gerstein M. Classification of human genomic regions based on experimentally determined binding sites of more than 100 transcription-related factors. Genome Biol. 2012; 13: R48. doi: 10.1186/gb-2012-13-9-r48.
16. Zhang SH, Tian D, Tran NH, Choi KP, Zhang LX. Profiling the transcription factor regulatory networks of human cell types. Nucleic Acids Res. 2014; 42: 12380-7. doi: 10.1093/nar/gku923.
17. Berger SL. The complex language of chromatin regulation during transcription. Nature. 2007; 447: 407-12. doi: 10.1038/nature05915.
18. Jayani RS, Ramanujam PL, Galande S. Studying histone modifications and their genomic functions by employing chromatin immunoprecipitation and immunoblotting. Methods Cell Biol. 2010;98:35-56. doi: 10.1016/S0091-679X(10)98002-3.
19. Cheng C, Gerstein M. Modeling the relative relationship of transcription factor binding and histone modifications to gene expression levels in mouse embryonic stem cells. Nucleic Acids Res. 2012; 40: 553-68. doi: 10.1093/nar/gkr752.
20. Karlic R, Chung HR, Lasserre J, Vlahovicek K, Vingron M. Histone modification levels are predictive for gene expression. Proc Natl Acad Sci U S A. 2010; 107: 2926-31. doi: 10.1073/pnas.0909344107.
21. Wang J, Lin XQ, Wang S, Wang CF, Wang Q, Duan XK, Lu P, Wang Q, Wang CY, Liu XS, Huang JY. PHF8 and REST/NRSF co-occupy gene promoters to regulate proximal gene expression. Sci Rep. 2014; 4: 5008. doi: 10.1038/srep05008.
22. Cheng C, Alexander R, Min R, Leng J, Yip KY, Rozowsky J, Yan KK, Dong X, Djebali S, Ruan Y, Davis CA, Carninci P, Lassman T, et al. Understanding transcriptional regulation by integrative analysis of transcription factor binding data. Genome Res. 2012; 22: 1658-67. doi: 10.1101/gr.136838.111.
23. Su WX, Li QZ, Zuo YC, Zhang LQ. Association analysis between the distributions of histone modifications and gene expression in the human embryonic stem cell. Gene. 2016; 575: 90-100. doi: 10.1016/j.gene.2015.08.041.
24. Dong X, Greven MC, Kundaje A, Djebali S, Brown JB, Cheng C, Gingeras TR, Gerstein M, Guigo R, Birney E, Weng ZP. Modeling gene expression using chromatin features in various cellular contexts. Genome Biol. 2012; 13: R53. doi: 10.1186/gb-2012-13-9-r53.
25. Hahn MA, Wu X, Li AX, Hahn T, Pfeifer GP. Relationship between gene body DNA methylation and intragenic H3K9me3 and H3K36me3 chromatin marks. PLoS One. 2011; 6: e18844. doi: 10.1371/journal.pone.0018844.
26. Nanty L, Carbajosa G, Heap GA, Ratnieks F, van Heel DA, Down TA, Rakyan VK. Comparative methylomics reveals gene-body H3K36me3 in Drosophila predicts DNA methylation and CpG landscapes in other invertebrates. Genome Res. 2011; 21: 1841-50. doi: 10.1101/gr.121640.111.
27. Zhao DY, Gish G, Braunschweig U, Li Y, Ni Z, Schmitges FW, Zhong GQ, Liu K, Li WG, Moffat J, Vedadi M, Min J, Pawson TJ, et al. SMN and symmetric arginine dimethylation of RNA polymerase II C-terminal domain control termination. Nature. 2016; 529: 48-53. doi: 10.1038/nature16469.
28. Mita K, Tsuji H, Morimyo M, Takahashi E, Nenoi M, Ichimura S, Yamauchi M, Hongo E, Hayashi A. The human gene encoding the largest subunit of RNA polymerase II. Gene. 1995; 159: 285-6. doi: 10.1016/0378-1119(95)00081-g.
29. Wang S, Sun HF, Ma J, Zang CZ, Wang CF, Wang J, Tang QZ, Meyer CA, Zhang Y, Liu XS. Target analysis by integration of transcriptome and ChIP-seq data with BETA. Nat Protoc. 2013; 8: 2502-15. doi: 10.1038/nprot.2013.150.
30. Foti D, Iuliano R, Chiefari E, Brunetti A. A nucleoprotein complex containing Sp1, C/EBP beta, and HMGI-Y controls human insulin receptor gene transcription. Mol Cell Biol. 2003; 23: 2720-32. doi: 10.1128/mcb.23.8.2720.2732.2003.
31. Ernst J, Kellis M. ChromHMM: automating chromatin-state discovery and characterization. Nat Methods. 2012; 9: 215-6. doi: 10.1038/nmeth.1906.
32. Lin WZ, Fang JA, Xiao X, Chou KC. iLoc-Animal: a multi-label learning classifier for predicting subcellular localization of animal proteins. Mol Biosyst. 2013; 9: 634-44. doi: 10.1039/c3mb25466f.
33. Wu ZC, Xiao X, Chou KC. iLoc-Plant: a multi-label classifier for predicting the subcellular localization of plant proteins with both single and multiple sites. Mol Biosyst. 2011; 7: 3287-97. doi: 10.1039/c1mb05232b.
34. Benjamini Y, Hochberg Y. Controlling the False Discovery Rate - a Practical And Powerful Approach To Multiple Testing. Journal Of the Royal Statistical Society Series B-Methodological. 1995; 57: 289-300.
35. Cai L, Yuan W, Zhang Z, He L, Chou KC. In-depth comparison of somatic point mutation callers based on different tumor next-generation sequencing depth data. Sci Rep. 2016; 6: 36540. doi: 10.1038/srep36540.
36. McLeay RC, Lesluyes T, Cuellar Partida G, Bailey TL. Genome-wide in silico prediction of gene expression. Bioinformatics. 2012; 28: 2789-96. doi: 10.1093/bioinformatics/bts529.
37. Rigbolt KT, Prokhorova TA, Akimov V, Henningsen J, Johansen PT, Kratchmarova I, Kassem M, Mann M, Olsen JV, Blagoev B. System-wide temporal characterization of the proteome and phosphoproteome of human embryonic stem cell differentiation. Sci Signal. 2011; 4: rs3. doi: 10.1126/scisignal.2001570.
38. Benayoun BA, Pollina EA, Ucar D, Mahmoudi S, Karra K, Wong ED, Devarajan K, Daugherty AC, Kundaje AB, Mancini E, Hitz BC, Gupta R, Rando TA, et al. H3K4me3 breadth is linked to cell identity and transcriptional consistency. Cell. 2014; 158: 673-88. doi: 10.1016/j.cell.2014.06.027.
39. Chou KC. Some remarks on protein attribute prediction and pseudo amino acid composition. J Theor Biol. 2011; 273: 236-47. doi: 10.1016/j.jtbi.2010.12.024.
40. Liu Z, Xiao X, Qiu WR, Chou KC. iDNA-Methyl: identifying DNA methylation sites via pseudo trinucleotide composition. Anal Biochem. 2015; 474: 69-77. doi: 10.1016/j.ab.2014.12.009.
41. Dehzangi A, Heffernan R, Sharma A, Lyons J, Paliwal K, Sattar A. Gram-positive and Gram-negative protein subcellular localization by incorporating evolutionary-based descriptors into Chous general PseAAC. J Theor Biol. 2015; 364: 284-94. doi: 10.1016/j.jtbi.2014.09.029.
42. Khan M, Hayat M, Khan SA, Iqbal N. Unb-DPC: Identify mycobacterial membrane protein types by incorporating un-biased dipeptide composition into Chou’s general PseAAC. J Theor Biol. 2017; 415: 13-9. doi: 10.1016/j.jtbi.2016.12.004.
43. Jia J, Liu Z, Xiao X, Liu B, Chou KC. iPPI-Esml: An ensemble classifier for identifying the interactions of proteins by incorporating their physicochemical properties and wavelet transforms into PseAAC. J Theor Biol. 2015; 377: 47-56. doi: 10.1016/j.jtbi.2015.04.011.
44. Rahimi M, Bakhtiarizadeh MR, Mohammadi-Sangcheshmeh A. OOgenesis_Pred: A sequence-based method for predicting oogenesis proteins by six different modes of Chou’s pseudo amino acid composition. J Theor Biol. 2017; 414: 128-36. doi: 10.1016/j.jtbi.2016.11.028.
45. Behbahani M, Mohabatkar H, Nosrati M. Analysis and comparison of lignin peroxidases between fungi and bacteria using three different modes of Chou’s general pseudo amino acid composition. J Theor Biol. 2016; 411: 1-5. doi: 10.1016/j.jtbi.2016.09.001.
46. Chen J, Long R, Wang XL, Liu B, Chou KC. dRHP-PseRA: detecting remote homology proteins using profile-based pseudo protein sequence and rank aggregation. Sci Rep. 2016; 6: 32333. doi: 10.1038/srep32333.
47. Chen W, Ding H, Feng P, Lin H, Chou KC. iACP: a sequence-based tool for identifying anticancer peptides. Oncotarget. 2016; 7: 16895-909. doi: 10.18632/oncotarget.7815.
48. Jia JH, Liu Z, Xiao X, Liu B, Chou KC. iCar-PseCp: identify carbonylation sites in proteins by Monte Carlo sampling and incorporating sequence coupled effects into general PseAAC. Oncotarget. 2016; 7: 34558-70. doi: 10.18632/oncotarget.9148.
49. Qiu WR, Sun BQ, Xiao X, Xu ZC, Chou KC. iHyd-PseCp: Identify hydroxyproline and hydroxylysine in proteins by incorporating sequence-coupled effects into general PseAAC. Oncotarget. 2016; 7: 44310-21. doi: 10.18632/oncotarget.10027.
50. Xiao X, Ye HX, Liu Z, Jia JH, Chou KC. iROS-gPseKNC: Predicting replication origin sites in DNA by incorporating dinucleotide position-specific propensity into general pseudo nucleotide composition. Oncotarget. 2016; 7: 34180-9. doi: 10.18632/oncotarget.9057.
51. Zhang CJ, Tang H, Li WC, Lin H, Chen W, Chou KC. iOri-Human: identify human origin of replication by incorporating dinucleotide physicochemical properties into pseudo nucleotide composition. Oncotarget. 2016; 7: 69783-93. doi: 10.18632/oncotarget.11975.
52. Chou KC. Impacts of bioinformatics to medicinal chemistry. Med Chem. 2015; 11: 218-34.
53. Chen W, Lin H, Chou KC. Pseudo nucleotide composition or PseKNC: an effective formulation for analyzing genomic sequences. Mol Biosyst. 2015; 11: 2620-34. doi: 10.1039/c5mb00155b.
54. Liu B, Liu FL, Fang LY, Wang XL, Chou KC. repDNA: a Python package to generate various modes of feature vectors for DNA sequences by incorporating user-defined physicochemical properties and sequence-order effects. Bioinformatics. 2015; 31: 1307-9. doi: 10.1093/bioinformatics/btu820.
55. Rhead B, Karolchik D, Kuhn RM, Hinrichs AS, Zweig AS, Fujita PA, Diekhans M, Smith KE, Rosenbloom KR, Raney BJ, Pohl A, Pheasant M, Meyer LR, et al. The UCSC Genome Browser database: update 2010. Nucleic Acids Res. 2010; 38: D613-9. doi: 10.1093/nar/gkp939.
56. Quinlan AR, Hall IM. BEDTools: a flexible suite of utilities for comparing genomic features. Bioinformatics. 2010; 26: 841-2. doi: 10.1093/bioinformatics/btq033.
57. Mortazavi A, Williams BA, McCue K, Schaeffer L, Wold B. Mapping and quantifying mammalian transcriptomes by RNA-Seq. Nat Methods. 2008; 5: 621-8. doi: 10.1038/nmeth.1226.
58. Silverman BW. Density Estimation for Statistics and Data Analysis. Monographs on Statistics and Applied Probability. 1986.
59. Chang CC, Lin CJ. LIBSVM: A Library for Support Vector Machines. Acm Transactions on Intelligent Systems And Technology. 2011; 2: 27. doi: 10.1145/1961189.1961199.