
INTRODUCTION
Wilms’ tumor, also known as nephroblastoma, is the most common renal malignancy in children [1, 2]. The incidence of Wilms’ tumor is about 1 in 10,000 children of Western descent < 15 years of age [3]. Wilms’ tumor is less prevalent in China than in Western countries, with an incidence of ~3.3 per million [4]. Dramatic progress has been made in the treatment of children with Wilms’ tumor, with overall survival rates exceeding 90% in 2009, compared with about 30% in the 1930s [5, 6]. This success has mainly been due to multidisciplinary therapy and multi-institutional clinical trials [7, 8]. However, about 25% of affected children cannot be cured by current treatments, and approximately 50% of these children will die of Wilms’ tumor despite aggressive re-treatment [9, 10].
Wilms’ tumor appears to arise from nephrogenic rests, lesions that form when mesenchymal tissue fails to differentiate to nephrons [11]. Although there have been major advances in understanding the pathogenesis of Wilms’ tumor, the molecular mechanisms responsible for this differentiation failure are not completely understood. Chromosomal abnormalities are known to promote the formation of Wilms’ tumor by stimulating the uncontrolled growth of these undifferentiated cells [12, 13]. While a substantial proportion of Wilms’ tumor cases are sporadic and unilateral, 1–2% are hereditary [14–16]. Thus, genetic factors may also be involved in the predisposition to and aggressiveness of Wilms’ tumor [17, 18].
The Wilms’ tumor gene was the first identified suppressor of Wilms’ tumor development [19]. Thereafter, several susceptibility genes were found predispose individuals to Wilms’ tumor, such as FWT1 [20], FWT2 [21], BRCA2 [22], TP53 [23, 24], BARD1 [25] and CTR9 [26]. The LIM domain only 1 (LMO1) gene is located at 11p15, and encodes a cysteine-rich two-LIM-domain transcriptional regulator. LMO1, along with three paralogues (LMO2, LMO3 and LMO4), is a member of the LMO gene superfamily. LMO1 is abundantly expressed in the nervous system and has been implicated in its development [27]. Overexpression of LMO1 was initially found in patients with T-cell acute lymphoblastic leukemia [28]. Although numerous subsequent studies have demonstrated the association of this critical gene with neuroblastoma risk [29–31], none have investigated the associations between LMO1 single nucleotide polymorphisms (SNPs) and Wilms’ tumor risk.
Four polymorphisms in LMO1 (rs110419 A>G, rs4758051 G>A, rs10840002 A>G and rs204938 A>G) were found to be associated with the risk of several cancers in a genome-wide association study (GWAS) [29, 32]. We speculated that these polymorphisms might also contribute to the risk of Wilms’ tumor. Thus, we examined the associations between these LMO1 polymorphisms and Wilms’ tumor risk in Southern Chinese children.
RESULTS
Population characteristics
In total, 145 Wilms’ tumor patients and 531 cancer-free controls were included in our analysis. Their demographic characteristics are presented in Supplementary Table 1. The mean age was 26.17 ± 21.48 months for the Wilms’ tumor patients and 29.73 ± 24.86 months for controls. The distributions of age (P = 0.725) and gender (P = 0.956) did not differ significantly between the cases and controls. Regarding the clinical stages of the cases, 4 (2.76%), 49 (33.79%), 50 (34.48%), 33 (22.76%), and 9 (6.21%) cases were classified into stages I-IV and ‘not available’, respectively, in accordance with National Wilms Tumor Study-5 criteria [33].
Associations between LMO1 gene polymorphisms and Wilms’ tumor risk
We then genotyped the Wilms’ tumor patients and cancer-free controls for four LMO1 gene polymorphisms (rs110419 A>G, rs4758051 G>A, rs10840002 A>G and rs204938 A>G). The LMO1 genotype frequencies and their associations with Wilms’ tumor risk are listed in Table 1. The observed genotype frequencies among the controls were all in agreement with Hardy-Weinberg equilibrium. Among the four polymorphisms, only rs1140419 A>G was associated with Wilms’ tumor risk – the risk was lower for children with the AG genotype than for those with the AA genotype (adjusted odds ratio [OR] = 0.62, 95% confidence interval [CI] = 0.41–0.94, P = 0.024). We further examined the joint effect of these risk genotypes on Wilms’ tumor susceptibility. The risk for developing Wilms’ tumor was significantly greater in individuals carrying one to four risk genotypes (nucleotide alterations) than in those with no risk genotypes (adjusted OR = 1.84, 95% CI = 1.25–2.69, P = 0.002).
Table 1: Associations between LMO1 gene polymorphisms and Wilms’ tumor susceptibility
Genotype |
Cases |
Controls |
Pa |
Crude OR |
P |
Adjusted OR |
Pb |
|---|---|---|---|---|---|---|---|
rs110419 (HWE = 0.248) |
|||||||
AA |
55 (38.46) |
159 (29.94) |
1.00 |
1.00 |
|||
AG |
59 (41.26) |
275 (51.79) |
0.62 (0.41–0.94) |
0.024 |
0.62 (0.41–0.94) |
0.024 |
|
GG |
29 (20.28) |
97 (18.27) |
0.86 (0.52–1.45) |
0.579 |
0.87 (0.52–1.46) |
0.605 |
|
Additive |
0.070 |
0.87 (0.67–1.14) |
0.323 |
0.88 (0.67–1.15) |
0.335 |
||
Dominant |
88 (61.54) |
372 (70.06) |
0.055 |
0.68 (0.47–1.01) |
0.053 |
0.68 (0.47–1.01) |
0.053 |
Recessive |
114 (81.73) |
434 (81.73) |
0.587 |
1.14 (0.72–1.81) |
0.584 |
1.15 (0.72–1.83) |
0.554 |
rs4758051 (HWE = 0.199) |
|||||||
GG |
52 (36.36) |
194 (36.53) |
1.00 |
1.00 |
|||
AG |
64 (44.76) |
242 (45.57) |
0.99 (0.65–1.49) |
0.949 |
0.98 (0.65–1.49) |
0.936 |
|
AA |
27 (18.88) |
95 (17.89) |
1.06 (0.63–1.79) |
0.827 |
1.05 (0.62–1.77) |
0.863 |
|
Additive |
0.962 |
1.02 (0.79–1.32) |
0.863 |
1.02 (0.79–1.32) |
0.898 |
||
Dominant |
91 (63.64) |
337 (63.47) |
0.970 |
1.01 (0.69–1.48) |
0.970 |
1.00 (0.68–1.47) |
0.995 |
Recessive |
116 (81.12) |
436 (82.11) |
0.786 |
1.07 (0.67–1.72) |
0.785 |
1.06 (0.66–1.70) |
0.818 |
rs10840002 (HWE = 0.070) |
|||||||
AA |
46 (32.17) |
182 (34.27) |
1.00 |
1.00 |
|||
AG |
62 (43.36) |
240 (45.20) |
1.02 (0.67–1.57) |
0.920 |
1.02 (0.67–1.57) |
0.929 |
|
GG |
35 (24.48) |
109 (20.53) |
1.27 (0.77–2.09) |
0.348 |
1.26 (0.77–2.08) |
0.362 |
|
Additive |
0.597 |
1.12 (0.87–1.44) |
0.381 |
1.12 (0.87–1.44) |
0.395 |
||
Dominant |
97 (67.83) |
349 (65.73) |
0.635 |
1.10 (0.74–1.63) |
0.637 |
1.10 (0.74–1.63) |
0.650 |
Recessive |
108 (75.52) |
422 (79.47) |
0.312 |
1.26 (0.81–1.94) |
0.307 |
1.25 (0.81–1.93) |
0.319 |
rs204938 (HWE = 0.153) |
|||||||
AA |
94 (65.73) |
354 (66.67) |
1.00 |
1.00 |
|||
AG |
42 (29.37) |
165 (31.07) |
0.96 (0.64–1.44) |
0.839 |
0.96 (0.64–1.44) |
0.830 |
|
GG |
7 (4.90) |
12 (2.26) |
2.20 (0.84–5.73) |
0.108 |
2.20 (0.84–5.75) |
0.109 |
|
Additive |
0.280 |
1.13 (0.81–1.58) |
0.481 |
1.13 (0.80–1.58) |
0.487 |
||
Dominant |
49 (34.27) |
177 (33.33) |
0.834 |
1.04 (0.71–1.54) |
0.833 |
1.04 (0.70–1.54) |
0.842 |
Recessive |
136 (95.10) |
519 (97.74) |
0.114 |
2.23 (0.86–5.76) |
0.099 |
2.23 (0.86–5.78) |
0.099 |
Combined effect of risk genotypes |
|||||||
0 |
51 (35.66) |
268 (50.47) |
1.00 |
1.00 |
|||
1–4 |
92 (64.34) |
263 (49.53) |
0.002 |
1.84 (1.25–2.69) |
0.002 |
1.84 (1.25–2.69) |
0.002 |
OR: odds ratio; CI: confidence interval; HWE: Hardy–Weinberg equilibrium.
aχ2 test for genotype distributions between Wilms’ tumor patients and controls.
bAdjusted for age and gender.
Stratification analysis
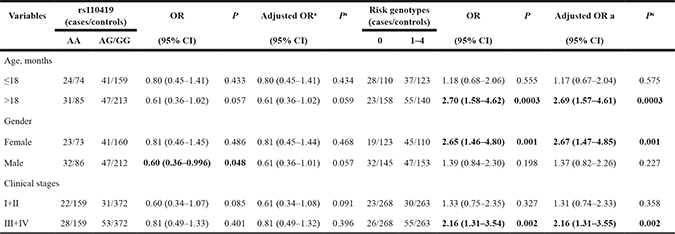
We further evaluated the relationship between the LMO1 risk genotypes and Wilms’ tumor susceptibility in subjects stratified by age, gender, and clinical stage (Table 2). The stratification analysis indicated that the rs110419 AG/GG genotype was more likely to reduce Wilms’ tumor risk in males (crude OR = 0.60, 95% CI = 0.36–0.996, P = 0.048), but this association disappeared after adjustment for age and gender (adjusted OR = 0.61, 95% CI = 0.36–1.01, P = 0.057). No significant associations between rs110419 A>G and Wilms’ tumor risk were observed in the age or clinical-stage subgroups. The stratification analysis also indicated that the association of one to four risk genotypes with increased Wilms’ tumor risk was limited to the subjects who were >18 months old (adjusted OR = 2.69, 95% CI = 1.57–4.61, P = 0.0003), female (adjusted OR = 2.67, 95% CI = 1.47–4.85, P = 0.001), and in clinical stages III+IV (adjusted OR = 2.16, 95% CI = 1.31–3.55, P = 0.002).
Table 2: Stratification analysis of the associations between risk genotypes and Wilms’ tumor susceptibility
aAdjusted for age and gender.
OR, odds ratio. CI, confidence interval.
Haplotype analysis and false-positive report probability (FPRP) analysis
The inferred haplotypes for the LMO1 gene (in the order of rs110419, rs4758051, rs10840002 and rs204938) and their associations with Wilms’ tumor risk are shown in Table 3. Wilms’ tumor risk was greater in GGAG haplotype carriers (OR = 3.23, 95% CI = 1.26–8.26, P = 0.014) than in GGAA haplotype carriers. Likewise, the GGGA haplotype was also associated with greater Wilms’ tumor risk than GGAA (OR = 3.46, 95% CI = 1.46–8.18, P = 0.005).
Table 3: The frequencies of inferred LMO1 gene haplotypes based on observed genotypes, and their associations with Wilms’ tumor susceptibility
Haplotypesa |
Cases |
Controls |
Crude OR |
P |
Adjusted ORb |
Pb |
|---|---|---|---|---|---|---|
GGAA |
53 (18.53) |
276 (25.99) |
1.00 |
1.00 |
||
GGAG |
8 (2.80) |
12 (1.13) |
3.23 (1.26–8.26) |
0.014 |
3.23 (1.26–8.28) |
0.015 |
GGGA |
10 (3.50) |
14 (1.32) |
3.46 (1.46–8.18) |
0.005 |
3.53 (1.49–8.35) |
0.004 |
GAAA |
2 (0.70) |
0 (0.00) |
/ |
/ |
/ |
/ |
GAGA |
39 (13.64) |
149 (14.03) |
1.27 (0.81–1.99) |
0.306 |
1.28 (0.81–2.01) |
0.293 |
GAGG |
5 (1.75) |
18 (1.69) |
1.35 (0.48–3.77) |
0.573 |
1.35 (0.48–3.79) |
0.570 |
AGAA |
73 (25.52) |
253 (23.82) |
1.40 (0.95–2.06) |
0.090 |
1.41 (0.96–2.07) |
0.083 |
AGAG |
18 (6.29) |
60 (5.65) |
1.45 (0.80–2.64) |
0.222 |
1.45 (0.80–2.65) |
0.223 |
AGGA |
5 (1.75) |
8 (0.75) |
3.03 (0.96–9.59) |
0.060 |
2.96 (0.93–9.43) |
0.066 |
AGGG |
1 (0.35) |
7 (0.66) |
0.69 (0.08–5.73) |
0.733 |
0.72 (0.09–6.00) |
0.762 |
AAAA |
0 (0.00) |
3 (0.28) |
/ |
/ |
/ |
/ |
AAGA |
48 (16.78) |
170 (16.01) |
1.37 (0.89–2.10) |
0.153 |
1.36 (0.88–2.09) |
0.164 |
AAGG |
24 (8.39) |
92 (8.66) |
1.26 (0.74–2.15) |
0.390 |
1.26 (0.74–2.15) |
0.395 |
aThe haplotype order is rs110419, rs4758051, rs10840002, rs204938.
bObtained from logistic regression models adjusted for age and gender.
OR, odds ratio. CI, confidence interval.
In the FPRP analysis (Table 4), due to the small sample size, nearly all of the significant findings disappeared at a prior probability level of 0.1 and an FPRP threshold of 0.2, except for the increased Wilms’ tumor risk in carriers of one to four risk genotypes (FPRP = 0.099).
Table 4: False-positive report probability values for the significant findings
Genotype |
Crude OR |
Pa |
Statistical |
Prior probability |
||||
|---|---|---|---|---|---|---|---|---|
0.25 |
0.1 |
0.01 |
0.001 |
0.0001 |
||||
LMO1 rs110419 A>G |
||||||||
AG vs. AA |
0.62 (0.41–0.94) |
0.024 |
0.441 |
0.140 |
0.329 |
0.844 |
0.982 |
0.998 |
AG/GG vs. AA |
||||||||
Males |
0.60 (0.36–0.996) |
0.048 |
0.328 |
0.305 |
0.568 |
0.935 |
0.993 |
0.999 |
Risk genotypes |
||||||||
1–4 vs. 0 |
1.84 (1.25–2.69) |
0.002 |
0.165 |
0.035 |
0.099 |
0.546 |
0.924 |
0.992 |
>18 months |
2.70 (1.58–4.62) |
0.0003 |
0.008 |
0.107 |
0.264 |
0.798 |
0.976 |
0.998 |
Females |
2.65 (1.46–4.80) |
0.001 |
0.015 |
0.164 |
0.371 |
0.867 |
0.985 |
0.998 |
Stage III+IV |
2.16 (1.31–3.54) |
0.002 |
0.038 |
0.138 |
0.324 |
0.841 |
0.982 |
0.998 |
Haplotypes |
||||||||
GGAG vs. GGAA |
3.23 (1.26–8.26) |
0.014 |
0.065 |
0.400 |
0.667 |
0.957 |
0.996 |
1.000 |
GGGA vs. GGAA |
3.46 (1.46–8.18) |
0.005 |
0.036 |
0.284 |
0.543 |
0.929 |
0.992 |
0.999 |
aA χ2 test was used to calculate the genotype frequency distributions.
bStatistical power was calculated from the number of observations in the subgroup and the ORs and P values in this table.
OR, odds ratio. CI, confidence interval.
DISCUSSION
In the present hospital-based case-control study of 145 children with Wilms’ tumor and 531 cancer-free controls, we investigated the associations of four GWAS-identified LMO1 gene polymorphisms with Wilms’ tumor susceptibility. We discovered that rs110419 A>G was associated with Wilms’ tumor susceptibility in a Southern Chinese population. To the best of our knowledge, this is the first report of an association between a LMO1 gene polymorphism and Wilms’ tumor susceptibility in Chinese children.
There is overwhelming evidence that LMO1 is a critical determinant of cancer susceptibility. In a GWAS conducted among individuals of European descent, Wang et al. discovered that four genetic variants of LMO1 (rs110419 A>G, rs4758051 G>A, rs10840002 A>G and rs204938 A>G) contributed to the tumorigenesis of neuroblastoma [29]. Subsequently, this relationship was confirmed in four other epidemiological studies among people of different ethnicities [30, 32, 34, 35]. Beuten et al. identified an association between another genetic variant (rs442264 A>G) in the LMO1 gene and acute lymphoblastic leukemia susceptibility in a population of Caucasian children (163 cases and 251 controls) [36]. Recently, Oldridge et al. found that the rs2168101 G>T polymorphism in LMO1 predisposed individuals to neuroblastoma. The authors also performed biological function studies to elucidate the oncogenic role of this polymorphism in tumor cells [37].
Despite the growing body of research demonstrating the associations of LMO1 gene variants with cancer susceptibility, until now, no study had investigated the relationship between LMO1 polymorphisms and Wilms’ tumor risk. Here, we performed an epidemiologic study on the associations between four LMO1 gene polymorphisms and Wilms’ tumor risk in 145 affected children and 531 healthy children. We found that the rs110419 AG genotype reduced Wilms’ tumor risk in the overall analysis, while we did not detect significant associations between the other three polymorphisms and Wilms’ tumor risk. However, we found that the predisposition to Wilms’ tumor was significantly greater in children with one to four risk genotypes than in those with no risk genotypes. This relationship was significant in children who were > 18 months old, female, and in clinical stages III+IV, but not in their counterpart subgroups. The above conflicting results may be ascribed to the following: 1) the relatively small sample size, 2) the relatively weak impact of LMO1 SNPs, and 3) the influence of environmental factors on Wilms’ tumor susceptibility.
Our study was the first to investigate the associations of LMO1 gene polymorphisms with Wilms’ tumor risk in a Chinese population. However, several limitations should be considered in the interpretation of our results. Firstly, only 145 patients and 531 controls were included in this analysis. This relatively small sample size inevitably reduced the statistical power, especially for the stratification and FPRP analyses. Secondly, the inherent selection bias could not be completely eliminated, since our study was a hospital-based study with subjects restricted to South China. Thirdly, due to the nature of retrospective studies, some valuable information could not be collected, such as parental exposures and dietary intakes, which diminished the precision of the results. Finally, these four SNPs were identified in a GWAS on neuroblastoma, while the present study dealt with Wilms’ tumor. A GWAS regarding LMO1 gene SNPs and Wilms’ tumor remains to be performed.
In conclusion, we determined that the rs110419 AG polymorphism in LMO1 may reduce the susceptibility to Wilms’ tumor in a Southern Chinese population. Well-designed studies with larger sample sizes in different ethnicities should be performed in the future. Furthermore, other LMO1 gene variants and gene-environment interactions should be investigated to provide essential insights into the etiology of Wilms’ tumor.
MATERIALS AND METHODS
Study subjects
Details on the recruited control subjects were reported previously [38–42]. For the present study, 145 patients with newly diagnosed and histologically confirmed Wilms’ tumor were recruited from the Department of Pediatric Urology, Guangzhou Women and Children’s Medical Center between March 2001 and June 2016, while 531 cancer-free children undergoing routine physical examinations in the same hospital were randomly selected as controls. All the subjects were genetically unrelated ethnic Han Chinese from South China [24, 25, 43]. The response rate was approximately 90% for Wilms’ tumor patients and 95% for cancer-free controls. The current study was approved by the Institutional Review Board of Guangzhou Women and Children’s Medical Center. Written informed consent was obtained from each participant’s parents or legal guardians.
Genotyping
About 2 mL of peripheral blood was collected from each subject for genotyping. Four LMO1 gene SNPs (rs110419 A>G, rs4758051 G>A, rs10840002 A>G and rs204938 A>G) identified in a GWAS on neuroblastoma were chosen for genotyping [29]. Genomic DNA was isolated from peripheral blood leukocytes with a TIANamp Blood DNA Kit (TianGen Biotech, Beijing, China) [38, 40]. A 7900 Sequence Detection System (Applied Biosystems, Foster City, CA) and Taqman real-time PCR were used to genotype the LMO1 SNPs, as described thoroughly elsewhere [44, 45]. To obtain convincing results, we performed the genotyping blindly, not knowing whether each subject was a case or control. We also randomly selected 10% of the samples for repeated genotyping, and the genotype concordance was 100%.
Statistical analysis
Hardy-Weinberg equilibrium was calculated with a goodness-of-fit χ2 test for the genotype frequencies in controls. A two-sided χ2 test was used to evaluate the differences in demographic variables and genotype frequencies between cases and controls. To estimate the associations between LMO1 polymorphisms and Wilms’ tumor susceptibility, we calculated ORs and 95% CIs using unconditional logistic regression with adjustment for age and gender. We also assessed the associations of the various haplotypes with Wilms’ tumor susceptibility [46]. FPRP analysis was performed as described previously [47, 48]. P < 0.05 was considered statistically significant. All statistical analyses were performed with SAS software (Version 9.4; SAS Institute, Cary, NC).
ACKNOWLEDGMENTS AND FUNDING
This study was supported by grants from the State Clinical Key Specialty Construction Project (Pediatric Surgery) 2013 (No: GJLCZD1301), and the Clinical Medicine Research and Transformation Center of Brain Injury in Premature Infant in Guangzhou (No: 520101–2150092). We thank Yanlu Tong, Hezhen Wang, and Hongjiao Chen for their assistance in DNA extraction and medical history collection.
CONFLICTS OF INTEREST
The authors declare no competing financial interests.
REFERENCES
1. Chu A, Heck JE, Ribeiro KB, Brennan P, Boffetta P, Buffler P, Hung RJ. Wilms’ tumour: a systematic review of risk factors and meta-analysis. Paediatr Perinat Epidemiol. 2010; 24:449–469.
2. Brok J, Treger TD, Gooskens SL, van den Heuvel-Eibrink MM, Pritchard-Jones K. Biology and treatment of renal tumours in childhood. Eur J Cancer. 2016; 68:179–195.
3. Breslow NE, Olson J, Moksness J, Beckwith JB, Grundy P. Familial Wilms’ tumor: a descriptive study. Med Pediatr Oncol. 1996; 27:398–403.
4. Bao PP, Li K, Wu CX, Huang ZZ, Wang CF, Xiang YM, Peng P, Gong YM, Xiao XM, Zheng Y. [Recent incidences and trends of childhood malignant solid tumors in Shanghai, 2002–2010]. [Article in Chinese]. Zhonghua Er Ke Za Zhi. 2013; 51:288–294.
5. Farber S. Chemotherapy in the treatment of leukemia and Wilms’ tumor. JAMA. 1966; 198:826–836.
6. Davidoff AM. Wilms’ tumor. Curr Opin Pediatr. 2009; 21:357–364.
7. Sonn G, Shortliffe LM. Management of Wilms tumor: current standard of care. Nat Clin Pract Urol. 2008; 5:551–560.
8. Pritchard-Jones K, Pieters R, Reaman GH, Hjorth L, Downie P, Calaminus G, Naafs-Wilstra MC, Steliarova-Foucher E. Sustaining innovation and improvement in the treatment of childhood cancer: lessons from high-income countries. Lancet Oncol. 2013; 14:e95-e103.
9. Malogolowkin M, Cotton CA, Green DM, Breslow NE, Perlman E, Miser J, Ritchey ML, Thomas PR, Grundy PE, D’Angio GJ, Beckwith JB, Shamberger RC, Haase GM, et al. Treatment of Wilms tumor relapsing after initial treatment with vincristine, actinomycin D, and doxorubicin. A report from the National Wilms Tumor Study Group. Pediatr Blood Cancer. 2008; 50:236–241.
10. Dome JS, Liu T, Krasin M, Lott L, Shearer P, Daw NC, Billups CA, Wilimas JA. Improved survival for patients with recurrent Wilms tumor: the experience at St. Jude Children’s Research Hospital. J Pediatr Hematol Oncol. 2002; 24:192–198.
11. Charlton J, Williams RD, Sebire NJ, Popov S, Vujanic G, Chagtai T, Alcaide-German M, Morris T, Butcher LM, Guilhamon P, Beck S, Pritchard-Jones K. Comparative methylome analysis identifies new tumour subtypes and biomarkers for transformation of nephrogenic rests into Wilms tumour. Genome Med. 2015; 7:11.
12. Hohenstein P, Pritchard-Jones K, Charlton J. The yin and yang of kidney development and Wilms’ tumors. Genes Dev. 2015; 29:467–482.
13. Spreafico F, Ciceri S, Gamba B, Torri F, Terenziani M, Collini P, Macciardi F, Radice P, Perotti D. Chromosomal anomalies at 1q, 3, 16q, and mutations of SIX1 and DROSHA genes underlie Wilms tumor recurrences. Oncotarget. 2016; 7:8908–8915. doi: 10.18632/oncotarget.6950.
14. Scott RH, Stiller CA, Walker L, Rahman N. Syndromes and constitutional chromosomal abnormalities associated with Wilms tumour. J Med Genet. 2006; 43:705–715.
15. Huff V. Wilms tumor genetics. Am J Med Genet. 1998; 79:260–267.
16. Pritchard-Jones K, Moroz V, Vujanic G, Powis M, Walker J, Messahel B, Hobson R, Levitt G, Kelsey A, Mitchell C, Children’s Cancer and Leukaemia Group (CCLG) Renal Tumours Group. Treatment and outcome of Wilms’ tumour patients: an analysis of all cases registered in the UKW3 trial. Ann Oncol. 2012; 23:2457–2463.
17. Scott RH, Douglas J, Baskcomb L, Huxter N, Barker K, Hanks S, Craft A, Gerrard M, Kohler JA, Levitt GA, Picton S, Pizer B, Ronghe MD, et al. Constitutional 11p15 abnormalities, including heritable imprinting center mutations, cause nonsyndromic Wilms tumor. Nat Genet. 2008; 40:1329–1334.
18. Deng C, Dai R, Li X, Liu F. Genetic variation frequencies in Wilms’ tumor: A meta-analysis and systematic review. Cancer Sci. 2016; 107:690–699.
19. Call KM, Glaser T, Ito CY, Buckler AJ, Pelletier J, Haber DA, Rose EA, Kral A, Yeger H, Lewis WH. Isolation and characterization of a zinc finger polypeptide gene at the human chromosome 11 Wilms’ tumor locus. Cell. 1990; 60:509–520.
20. Rahman N, Arbour L, Tonin P, Renshaw J, Pelletier J, Baruchel S, Pritchard-Jones K, Stratton MR, Narod SA. Evidence for a familial Wilms’ tumour gene (FWT1) on chromosome 17q12-q21. Nat Genet. 1996; 13:461–463.
21. Rapley EA, Barfoot R, Bonaiti-Pellie C, Chompret A, Foulkes W, Perusinghe N, Reeve A, Royer-Pokora B, Schumacher V, Shelling A, Skeen J, de Tourreil S, Weirich A, et al. Evidence for susceptibility genes to familial Wilms tumour in addition to WT1, FWT1 and FWT2. Br J Cancer. 2000; 83:177–183.
22. Reid S, Renwick A, Seal S, Baskcomb L, Barfoot R, Jayatilake H, Pritchard-Jones K, Stratton MR, Ridolfi-Luthy A, Rahman N, Breast Cancer Susceptibility Collaboration (UK), Familial Wilms Tumour Collaboration. Biallelic BRCA2 mutations are associated with multiple malignancies in childhood including familial Wilms tumour. J Med Genet. 2005; 42:147–151.
23. Maschietto M, Williams RD, Chagtai T, Popov SD, Sebire NJ, Vujanic G, Perlman E, Anderson JR, Grundy P, Dome JS, Pritchard-Jones K. TP53 mutational status is a potential marker for risk stratification in Wilms tumour with diffuse anaplasia. PLoS One. 2014; 9:e109924.
24. Fu W, Zhuo ZJ, Jia W, Zhu J, Zhu SB, Lin ZF, Wang FH, Xia H, He J, Liu GC. Association between TP53 gene Arg72Pro polymorphism and Wilms’ tumor risk in a Chinese population. Onco Targets Ther. 2017; 10:1149–1154.
25. Fu W, Zhu J, Xiong SW, Jia W, Zhao Z, Zhu SB, Hu JH, Wang FH, Xia H, He J, Liu GC. BARD1 Gene Polymorphisms Confer Nephroblastoma Susceptibility. EBioMedicine. 2017; 16:101–105.
26. Hanks S, Perdeaux ER, Seal S, Ruark E, Mahamdallie SS, Murray A, Ramsay E, Del Vecchio Duarte S, Zachariou A, de Souza B, Warren-Perry M, Elliott A, Davidson A, et al. Germline mutations in the PAF1 complex gene CTR9 predispose to Wilms tumour. Nat Commun. 2014; 5:4398.
27. Greenberg JM, Boehm T, Sofroniew MV, Keynes RJ, Barton SC, Norris ML, Surani MA, Spillantini MG, Rabbitts TH. Segmental and developmental regulation of a presumptive T-cell oncogene in the central nervous system. Nature. 1990; 344:158–160.
28. Boehm T, Foroni L, Kaneko Y, Perutz MF, Rabbitts TH. The rhombotin family of cysteine-rich LIM-domain oncogenes: distinct members are involved in T-cell translocations to human chromosomes 11p15 and 11p13. Proc Natl Acad Sci USA. 1991; 88:4367–4371.
29. Wang K, Diskin SJ, Zhang H, Attiyeh EF, Winter C, Hou C, Schnepp RW, Diamond M, Bosse K, Mayes PA, Glessner J, Kim C, Frackelton E, et al. Integrative genomics identifies LMO1 as a neuroblastoma oncogene. Nature. 2011; 469:216–220.
30. He J, Zhong W, Zeng J, Zhu J, Zhang R, Wang F, Yang T, Zou Y, Xia H. LMO1 gene polymorphisms contribute to decreased neuroblastoma susceptibility in a Southern Chinese population. Oncotarget. 2016; 7:22770–22778. doi: 10.18632/oncotarget.8178.
31. Nguyen le B, Diskin SJ, Capasso M, Wang K, Diamond MA, Glessner J, Kim C, Attiyeh EF, Mosse YP, Cole K, Iolascon A, Devoto M, Hakonarson H, et al. Phenotype restricted genome-wide association study using a gene-centric approach identifies three low-risk neuroblastoma susceptibility Loci. PLoS Genet. 2011; 7:e1002026.
32. Capasso M, Diskin SJ, Totaro F, Longo L, De Mariano M, Russo R, Cimmino F, Hakonarson H, Tonini GP, Devoto M, Maris JM, Iolascon A. Replication of GWAS-identified neuroblastoma risk loci strengthens the role of BARD1 and affirms the cumulative effect of genetic variations on disease susceptibility. Carcinogenesis. 2013; 34:605–611.
33. Beckwith JB. National Wilms Tumor Study: an update for pathologists. Pediatr Dev Pathol. 1998; 1:79–84.
34. Latorre V, Diskin SJ, Diamond MA, Zhang H, Hakonarson H, Maris JM, Devoto M. Replication of neuroblastoma SNP association at the BARD1 locus in African-Americans. Cancer Epidemiol Biomarkers Prev. 2012; 21:658–663.
35. Kepp O, Semeraro M, Bravo-San Pedro JM, Bloy N, Buque A, Huang X, Zhou H, Senovilla L, Kroemer G, Galluzzi L. eIF2alpha phosphorylation as a biomarker of immunogenic cell death. Semin Cancer Biol. 2015; 33:86–92.
36. Beuten J, Gelfond JA, Piwkham D, Pollock BH, Winick NJ, Collier AB 3rd, Tomlinson GE. Candidate gene association analysis of acute lymphoblastic leukemia identifies new susceptibility locus at 11p15 (LMO1). Carcinogenesis. 2011; 32:1349–1353.
37. Oldridge DA, Wood AC, Weichert-Leahey N, Crimmins I, Sussman R, Winter C, McDaniel LD, Diamond M, Hart LS, Zhu S, Durbin AD, Abraham BJ, Anders L, et al. Genetic predisposition to neuroblastoma mediated by a LMO1 super-enhancer polymorphism. Nature. 2015; 528:418–421.
38. Zhang R, Zou Y, Zhu J, Zeng X, Yang T, Wang F, He J, Xia H. The Association between GWAS-identified BARD1 Gene SNPs and Neuroblastoma Susceptibility in a Southern Chinese Population. Int J Med Sci. 2016; 13:133–138.
39. Zheng J, Zhang R, Zhu J, Wang F, Yang T, He J, Xia H. Lack of Associations between XPC Gene Polymorphisms and Neuroblastoma Susceptibility in a Chinese Population. Biomed Res Int. 2016; 2016:2932049.
40. He J, Wang F, Zhu J, Zhang R, Yang T, Zou Y, Xia H. Association of potentially functional variants in the XPG gene with neuroblastoma risk in a Chinese population. J Cell Mol Med. 2016; 20:1481–1490.
41. He J, Yang T, Zhang R, Zhu J, Wang F, Zou Y, Xia H. Potentially functional polymorphisms in the LIN28B gene contribute to neuroblastoma susceptibility in Chinese children. J Cell Mol Med. 2016; 20:1534–1541.
42. He J, Wang F, Zhu J, Zhang Z, Zou Y, Zhang R, Yang T, Xia H. The TP53 gene rs1042522 C>G polymorphism and neuroblastoma risk in Chinese children. Aging (Albany NY). 2017; 9:852–859. doi: 10.18632/aging.101196.
43. Fu W, Liu GC, Zhao Z, Zhu J, Jia W, Zhu SB, Hu JH, Wang FH, He J, Xia H. The correlation between LIN28B gene potentially functional variants and Wilms tumor susceptibility in Chinese children. J Clin Lab Anal. 2017. doi: 10.1002/jcla.22200.
44. He J, Qiu LX, Wang MY, Hua RX, Zhang RX, Yu HP, Wang YN, Sun MH, Zhou XY, Yang YJ, Wang JC, Jin L, Wei QY, Li J. Polymorphisms in the XPG gene and risk of gastric cancer in Chinese populations. Hum Genet. 2012; 131:1235–1244.
45. Hua RX, Zhu J, Jiang DH, Zhang SD, Zhang JB, Xue WQ, Li XZ, Zhang PF, He J, Jia WH. Association of XPC Gene Polymorphisms with Colorectal Cancer Risk in a Southern Chinese Population: A Case-Control Study and Meta-Analysis. Genes (Basel). 2016; 7:E73.
46. Hua RX, Zhuo ZJ, Zhu J, Jiang DH, Xue WQ, Zhang SD, Zhang JB, Li XZ, Zhang PF, Jia WH, Shen GP, He J. Association between genetic variants in the XPG gene and gastric cancer risk in a Southern Chinese population. Aging (Albany NY). 2016; 8:3311–3320. doi: 10.18632/aging.101119.
47. He J, Wang MY, Qiu LX, Zhu ML, Shi TY, Zhou XY, Sun MH, Yang YJ, Wang JC, Jin L, Wang YN, Li J, Yu HP, Wei QY. Genetic variations of mTORC1 genes and risk of gastric cancer in an Eastern Chinese population. Mol Carcinog. 2013; 52:E70–79.
48. Fu W, Zhuo ZJ, Chen YC, Zhu J, Zhao Z, Jia W, Hu JH, Fu K, Zhu SB, He J, Liu GC. NFKB1 -94insertion/deletion ATTG polymorphism and cancer risk: Evidence from 50 case-control studies. Oncotarget. 2017; 8:9806–9822. doi: 10.18632/oncotarget.14190.