
INTRODUCTION
Enchondromas are the most common primary benign osseous neoplasms of mature hyaline cartilage that occur within the medullary cavity of bone, and enchondromas account for 12 to 24 percent of all benign bone tumors and 3 to 10 percent of all bone tumors [1, 2]. Enchondromas occur predominantly in hands, typically in the middle and distal part of the metacarpals, and in the proximal part of the phalanges [3, 4]. Enchondromas can occur as solitary lesions or as multiple lesions (Ollier disease, Maffucci syndrome) [5, 6]. Multiple enchondromas can lead to malignant transformation more often (25-30%) than solitary enchondromas [7, 8]. The prevalence of Ollier’s disease is estimated to be approximately 1 per 100, 000 people per year, and the incidence of malignant transformation has been estimated at 20-50% [9, 10]. Chondrosarcomas are the second most common type of malignant bone tumors after osteosarcomas [11]. Metastasis often takes place in high-grade chondrosarcomas and results in a poor survival rate [12]. Moreover, enchondromas and low-grade chondrosarcomas are usually histologically similar, so it is often impossible to distinguish them in clinics [13]. Therefore, finding out the molecular mechanism or biomarkers is necessary to help us understand the development of enchondromas and diagnose and treat enchondromas. Furthermore, targeting of key genes and pathways has been considered a promising approach in the diagnosis and treatment of cancer [14]. However, the molecular mechanism of enchondromas is unclear. Thus, identifying characteristic alerted genes and mechanisms associated with enchondromas is important for the inhibition of malignant transformation and the development of more effective therapies. Microarray techniques combined with bioinformatics analysis can determine the differential expression levels of genes accurately and provide an efficient method for large-scale gene expression studies [15]. Thus, analysis of gene expression profiling can provide a better understanding of molecular mechanisms and help to better diagnose or predict treatment response of patients with enchondroma.
In this study, by comparing the gene expression of enchondromas with normal growth plate and articular cartilage in the GEO database, we identified DEGs and performed Gene Ontology (GO) and Kyoto Encyclopedia of Genes and Genomes (KEGG) enrichment pathway analyses. In combination with protein–protein interaction (PPI) information, we not only identified relevant genes and pathways but also revealed existing molecular mechanisms. In conclusion, our analysis can improve our understanding of enchondroma and identify the key genes and pathways associated with diagnosis, prognosis, and treatment of enchondroma.
RESULTS
Identification of DEGs
The gene expression profile GSE22855 was downloaded from the GEO database, and the GEO2R method was used to identify DEGs in enchondroma samples compared with control samples. We used P < 0.05, logFC (fold control) > 1.0 or logFC < -1.0 as the criteria, and 635 genes were identified as DEGs. Among these, 225 genes (35.43%) were up-regulated, and the remaining 410 genes (64.57%) were down-regulated. Subsequently, we created the heatmap using the top 50 up-regulated and down-regulated DEGs (Figure 1).
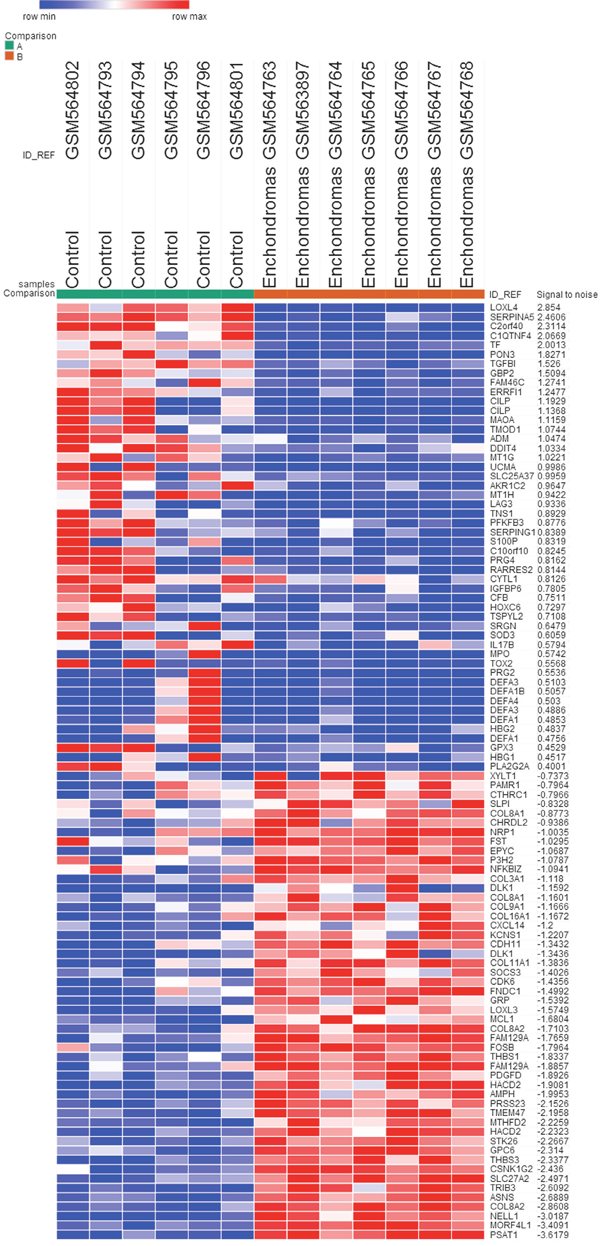
Figure 1: The heat map of the DEGs (top 50 up-regulated and down-regulated genes). Enchondromas samples versus control samples. Changes in genes expression (P < 0.05, logFC > 1.0 or logFC < -1.0) are illustrated by a heat map. Blue indicates a relatively low expression and red indicates a relatively high expression.
GO term enrichment analysis
Then, the online software DAVID was used to functionally categorize these 635 significant DEGs. GO analysis revealed that the up-regulated DEGs were significantly enriched in BP, including defense response to fungus, response to fungus, and defense response to Gram-positive bacterium (Table 1); the down-regulated DEGs were significantly enriched in BP, including extracellular matrix organization, extracellular structure organization, and collagen metabolic process (Table 1). For MF, the up-regulated DEGs were enriched in sulfur compound binding, glycosaminoglycan binding and heparin binding, and the down-regulated DEGs were enriched in extracellular matrix structural constituent, structural molecule activity, and growth factor binding (Table 1). In addition, GO CC analysis also showed that the up-regulated DEGs were significantly enriched in the extracellular space, extracellular region part, and extracellular region, and down-regulated DEGs were enriched in the extracellular region part, extracellular region and extracellular matrix (Table 1).
Table 1: Gene ontology analysis of DEGs
Expression |
Category |
GO-ID |
Term |
Gene count |
% |
P value |
|---|---|---|---|---|---|---|
Up-regulated |
BP |
GO:0050832 |
Defense response to fungus |
11 |
5.6 |
9.20E-12 |
|
BP |
GO:0009620 |
Response to fungus |
11 |
5.6 |
3.00E-10 |
|
BP |
GO:0050830 |
Defense response to Gram-positive bacterium |
12 |
6.1 |
3.00E-09 |
|
BP |
GO:0042742 |
Defense response to bacterium |
18 |
9.1 |
7.00E-09 |
|
BP |
GO:0009617 |
Response to bacterium |
25 |
12.7 |
2.30E-08 |
|
MF |
GO:1901681 |
Sulfur compound binding |
16 |
8.1 |
4.30E-08 |
|
MF |
GO:0005539 |
Glycosaminoglycan binding |
15 |
7.6 |
6.20E-08 |
|
MF |
GO:0008201 |
Heparin binding |
13 |
6.6 |
1.80E-07 |
|
MF |
GO:0050786 |
RAGE receptor binding |
4 |
2 |
1.90E-04 |
|
MF |
GO:0016209 |
Antioxidant activity |
7 |
3.6 |
1.90E-04 |
|
CC |
GO:0005615 |
Extracellular space |
56 |
28.4 |
1.10E-15 |
|
CC |
GO:0044421 |
Extracellular region part |
89 |
45.2 |
4.00E-12 |
|
CC |
GO:0005576 |
Extracellular region |
96 |
48.7 |
9.00E-11 |
|
CC |
GO:0070062 |
Extracellular exosome |
68 |
34.5 |
1.10E-09 |
|
CC |
GO:1903561 |
Extracellular vesicle |
68 |
34.5 |
1.40E-09 |
Down-regulated |
BP |
GO:0030198 |
Extracellular matrix organization |
37 |
11.6 |
3.00E-18 |
|
BP |
GO:0043062 |
Extracellular structure organization |
37 |
11.6 |
3.30E-18 |
|
BP |
GO:0032963 |
Collagen metabolic process |
20 |
6.3 |
1.30E-13 |
|
BP |
GO:0044259 |
Multicellular organismal macromolecule metabolic process |
20 |
6.3 |
2.80E-13 |
|
BP |
GO:0044259 |
Multicellular organism metabolic process |
20 |
6.3 |
3.90E-12 |
|
MF |
GO:0005201 |
Extracellular matrix structural constituent |
16 |
5 |
1.20E-11 |
|
MF |
GO:0005198 |
Structural molecule activity |
43 |
13.5 |
9.00E-11 |
|
MF |
GO:0019838 |
Growth factor binding |
16 |
5 |
7.90E-09 |
|
MF |
GO:0030020 |
Extracellular matrix structural constituent conferring tensile strength |
6 |
1.9 |
9.90E-09 |
|
MF |
GO:0005102 |
Receptor binding |
49 |
15.4 |
2.00E-05 |
|
CC |
GO:0044421 |
Extracellular region part |
159 |
50 |
1.10E-25 |
|
CC |
GO:0044421 |
Extracellular region |
171 |
53.8 |
3.10E-23 |
|
CC |
GO:0031012 |
Extracellular matrix |
53 |
16.7 |
3.40E-22 |
|
CC |
GO:0005578 |
Proteinaceous extracellular matrix |
43 |
13.5 |
8.60E-21 |
|
CC |
GO:0005788 |
Endoplasmic reticulum lumen |
29 |
9.1 |
2.50E-16 |
Abbreviations: BP, Biological process; MF, Molecular function; CC, Cellular component.
KEGG pathway analysis
The result of KEGG analysis revealed that DEGs were enriched in ECM-receptor interaction, protein digestion and absorption, focal adhesion, PI3K-Akt signaling pathway and ribosomes, and the key genes involved in these pathways are summarized in Table 2.
Table 2: KEGG pathway analysis of DEGs
Pathway-ID |
Name |
Gene count |
% |
P value |
Genes |
|---|---|---|---|---|---|
4512 |
ECM-receptor interaction |
18 |
3.5 |
3.60E-09 |
CHAD, COL1A1, COL1A2, COL2A1, COL3A1, COL4A1, COL4A2, COL6A3, COL11A1, COL11A2, ITGB5, LAMB2, TNC, THBS1, THBS2, THBS3, THBS4, VWF |
4974 |
Protein digestion and absorption |
16 |
3.1 |
2.10E-07 |
FXYD2, COL1A1, COL1A2, COL2A1, COL3A1, COL4A1, COL4A2, COL9A1, COL9A2, COL9A3, COL6A3, COL11A1, COL11A2, COL12A1, PRCP, SLC7A8 |
4510 |
Focal adhesion |
23 |
4.5 |
1.60E-06 |
JUN, CAV1, CAV2, CHAD, COL1A1, COL1A2, COL2A1, COL3A1, COL4A1, COL4A2, COL6A3, COL11A1, COL11A2, CCND3, ITGB5, LAMB2, PDGFD, TNC, THBS1, THBS2, THBS3, THBS4, VWF |
4151 |
PI3K-Akt signaling pathway |
27 |
5.2 |
1.00E-04 |
MCL1, DDIT4, ATF4, CHAD, COL1A1, COL1A2, COL2A1, COL3A1, COL4A1, COL4A2, COL6A3, COL11A1, COL11A2, CCND3, CDK6, ITGB5, IFNA8, LAMB2, PCK2, PDGFD, RPS6, TNC, THBS1, THBS2, THBS3, THBS4, VWF |
3010 |
Ribosome |
15 |
2.9 |
2.00E-04 |
RPL13, RPL14, RPL21, RPL23, RPL37A, RPL5, RPL7, RPL7A, RPS15, RPS15A, RPS2, RPS28, RPS3A, RPS6, RPLP1 |
PPI Network of DEGs and core genes in the PPI network
Based on the information in the STRING database, the PPI network contained 393 nodes and 1534 edges. The nodes indicated the DEGs, and the edges indicated the interactions between the DEGs. The top 10 high-degree hub nodes included glyceraldehyde-3-phosphate dehydrogenase (GAPDH), Jun proto-oncogene (JUN), matrix metallopeptidase 9 (MMP9), Fos proto-oncogene (FOS), collagen type I alpha 1 chain (COL1A1), early growth response 1 (EGR1), collagen type II alpha 1 chain (COL2A1), thrombospondin 1 (THBS1), forkhead box O1 (FOXO1) and collagen type I alpha 2 chain (COL1A2). Among these genes, GAPDH showed the highest node degree, which was 87. The core genes and their corresponding degree are shown in Table 3. Then, we used MCODE to screen the modules of the PPI network (Figure 2), and we performed an enrichment analysis of the genes involved in the top two significant modules. The results showed that the DEGs in modules 1 and 2 were principally related to ribosomes, protein digestion and absorption, ECM-receptor interaction, focal adhesion, amoebiasis and PI3K-Akt signaling pathway (Table 4).
Table 3: The core genes and their corresponding degree
Gene |
Degree |
Gene |
Degree |
Gene |
Degree |
Gene |
Degree |
|---|---|---|---|---|---|---|---|
GAPDH |
87 |
EGR1 |
35 |
RUNX2 |
31 |
RPS2 |
26 |
JUN |
61 |
COL2A1 |
35 |
CTGF |
29 |
RPL5 |
26 |
MMP9 |
56 |
THBS1 |
32 |
RPS6 |
28 |
RPS15 |
26 |
FOS |
52 |
FOXO1 |
32 |
COL3A1 |
28 |
HSPA8 |
26 |
COL1A1 |
41 |
COL1A2 |
31 |
VWF |
27 |
COL4A1 |
26 |
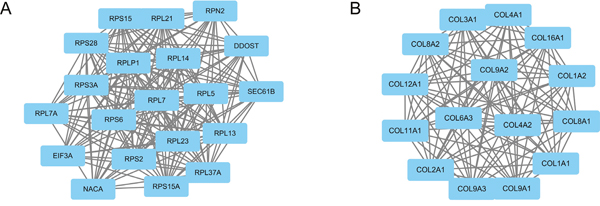
Figure 2: Top two modules from the PPI network. The squares represent the DEGs in modules, and the lines show the interaction between the DEGs. The top two modules indicate that they may play a more important role in the PPI network. (A) module 1. (B) module 2.
Table 4: The enriched pathways of modules
Modules |
Enriched pathways |
P value |
False discovery rate |
Nodes |
|---|---|---|---|---|
1 |
Ribosome |
1.90E-21 |
1.64E-27 |
RPL13, RPL14, RPL21, RPL23, RPL37A, RPL5, RPL7, RPL7A, RPS15, RPS15A, RPS2, RPS28, RPS3A, RPS6, RPLP1 |
2 |
Protein digestion and absorption |
7.50E-22 |
1.31E-24 |
COL1A1, COL1A2, COL2A1, COL3A1, COL4A1, COL4A2, COL9A1, COL9A2, COL9A3, COL6A3, COL11A1, COL12A1 |
|
ECM-receptor interaction |
1.20E-11 |
5.71E-14 |
COL1A1, COL1A2, COL2A1, COL3A1, COL4A1, COL4A2, COL6A3, COL11A1 |
|
Focal adhesion |
5.60E-09 |
3.42E-11 |
COL1A1, COL1A2, COL2A1, COL3A1, COL4A1, COL4A2, COL6A3, COL11A1 |
|
Amoebiasis |
4.90E-09 |
3.42E-11 |
COL1A1, COL1A2, COL2A1, COL3A1, COL4A1, COL4A2, COL11A1 |
|
PI3K-Akt signaling pathway |
3.20E-07 |
1.63E-09 |
COL1A1, COL1A2, COL2A1, COL3A1, COL4A1, COL4A2, COL6A3, COL11A1 |
DISCUSSION
Enchondromas are benign cartilaginous neoplasms that commonly occur in medullary bone [1]. These tumors can occur at any age, and they are found most commonly in children and adolescents with no significant sex differences [16]. Additionally enchondromas can undergo malignant transformation into chondrosarcoma [17, 18]. However, because they are clinically silent, enchondromas remain undetected in patients, and few studies address the molecular mechanism of enchondromas [19]. In the current study, the gene expression profile of GSE22855 was downloaded and a bioinformatic analysis was performed. The analysis results showed that there were 635 differentially expressed genes in the enchondroma samples compared with the control samples. Furthermore, GO, KEGG pathway and PPI analyses were performed to obtain a better understanding of this tumor, which was easily ignored.
The results of GO analyses showed that the significant ontology categories of up-regulated DEGs included defense response to fungus, sulfur compound binding and heparin binding. A previous study showed that garlic can detoxify carcinogens by stimulation of sulfur compound binding [20]. Moreover, up-regulation of genes associated with glycosaminoglycan binding was also found in ovarian cancer [21]. A recent study suggested that blocking heparan sulfate (HS) interaction with the heparin-binding domains of fibroblast growth factor receptors (FGFRs) could inhibit cancer cell growth [22]. Furthermore, down-regulated DEGs were mainly related to extracellular matrix organization, the extracellular matrix structural constituent and the collagen metabolic process. Elevation of genes associated with extracellular matrix organization could also be found in well-differentiated squamous cell carcinoma and colorectal cancer [23, 24]. Another analysis of secretome profiles on cancer-associated fibroblasts showed that up-regulated proteins were involved mainly in extracellular matrix organization and disassembly and collagen metabolism [25]. Therefore, GO analysis can help identify the possible biological processes, molecular functions and cellular components involved in the occurrence and development of enchondromas.
Moreover, the KEGG pathways revealed that DEGs were enriched in ECM-receptor interaction, protein digestion and absorption, focal adhesion, the PI3K-Akt signaling pathway and ribosomes. As a member of the basic helix-loop-helix (bHLH) family which plays a key role in tumorigenesis, Twist2 could promote proliferation and invasion of kidney cancer cell via regulating the ECM-Receptor-Interaction pathway [26]. The protein digestion and absorption pathway has been reported to be associated with pancreatic neuroendocrine tumors and breast cancer [27, 28]. Focal adhesion has been verified as taking part in cell migration in various tumor cells [29–31]. The phosphatidylinositol-3 kinases/Akt (PI3K/Akt) signaling pathway is activated in many human tumors, and it was proved to be a promising anticancer target [32]. Thus, deep understanding of the pathways can help us to elucidate the crucial mechanism of enchondromas.
Furthermore, we analyzed the PPI network and found that GAPDH, JUN, MMP9, FOS, COL1A1, EGR1, COL2A1, THBS1, FOXO1 and COL1A2 were the top 10 core genes, which may be potential therapeutic targets for enchondromas. GAPDH showed the highest node degree among these genes. GAPDH is deregulated in various cancer cells, and it is a new therapeutic target associated with tumor progression [33]. Therefore, experimental studies on GAPDH are essential to understand its role in the molecular mechanisms of enchondromas. C-jun was an important oncogene that could provide signals for cell survival; it was highly overexpressed in various invasive cancers, and repression of c-jun was beneficial to inhibiting the development and progression of cancer [34, 35]. MMP9 has been shown to be involved in the migration and invasion of various tumors, including breast cancer, transitional cell carcinoma, and non-small cell lung cancer [36–39]. A recent study revealed that epigenetic down-regulation of COL1A1 mRNA expression might have a role as a prognostic biomarker of hepatocellular carcinoma [40]. Expression profiles of COL2A1 and COL1A2 were independent predictors of survival in ovarian cancer and head and neck cancer respectively [41, 42]. EGR1 isn’t only a tumor suppressor gene (TSG) but also a gene with oncogenic activities [43], so understanding how it changes in enchondromas helps us to elucidate the crucial mechanism of tumorigenesis. As a tumor-specific ECM protein, THBS1 could promote migration of cancer cells and cause activation of integrin signaling in oral squamous cell carcinoma [44]. FOXO1 was a key effector of PI3K/Akt signaling and functions as tumor suppressors [45]. Therefore, the analysis of these core genes is useful for understanding the molecular mechanisms and identifying therapeutic targets of enchondromas.
Moreover, two main modules were got from the module analysis of the PPI network, and enrichment analysis showed that the modules were involved in ribosomes, protein digestion and absorption, ECM-receptor interaction, focal adhesion, amoebiasis and the PI3K-Akt signaling pathway. These results agreed with those of the KEGG analysis, and these related pathways represented promising candidates for therapeutic intervention and prognostic evaluation.
Somatic mutations in isocitrate dehydrogenase 1 (IDH1) and isocitrate dehydrogenase 2 (IDH2) have been detected in secondary glioblastomas, gliomas and acute myeloid leukemia (AML) [46–48]. IDH1 and IDH2 mutations are identified as the first common genetic abnormalities in conventional central and periosteal cartilaginous tumors, including enchondromas [49]. IDH1 mutations usually result in substitutions at R132, whereas IDH2 mutations affect R172, R132 and R140 [49, 50]. Moreover, the mutations occur in the early stages of tumorigenesis and can cause the accumulation of D-2-hydroxglutarateare [51]. The overall frequency of IDH1/IDH2 mutations was approximately 56% in conventional central and periosteal cartilaginous neoplasms [49]. Furthermore, a previous study showed that DNA hypermethylation was a consequence of IDH1/IDH2 mutations in AML and could result in reduced haemopoietic cellular differentiation and loss of markers related to proliferation [52]. Previous studies have demonstrated both positive and negative correlations between intragenic DNA methylation and gene expression, and abnormal DNA methylation was considered a common mechanism in the pathogenesis of several types of tumors [53–56]. Therefore, the researches on the impact of DNA methylation on gene expression in enchondromas are quite necessary. In our analysis, IDH1 and IDH2 were also identified as DEGs, and the results of these previous studies provided support for the result of our analysis. Furthermore, it is essential to explore the significant mutations and aberrant DNA methylation that occur in enchondromas, as they appear to be helpful for understanding the genetic alterations and molecular mechanisms of enchondromas.
SNP arrays are a useful research tool in molecular biology that can provide an analysis of DNA copy number alterations (CNA) and loss of heterozygosity (LOH); it can also detect genetic alterations in tumors [57, 58]. A previous study used the SNP array in combination with an expression array and aimed to obtain a comprehensive registry of genetic aberrations; the results demonstrated that CNA and LOH are rare and non-recurrent in enchondromas [59]. This study mainly studied genetic alterations including CAN and LOH, while our study mainly studied the global changes in gene expression and attempted to explore the molecular mechanisms underlying enchondromas. Furthermore, another study performed immunohistochemical analysis and quantitative real-time polymerase chain reaction (PCR) to reach a better understanding of the molecular mechanisms underlying malignant transformation of enchondromas; the result demonstrated that parathyroid hormone related peptide (PTHrP) signaling is active in enchondromas, and the PTH type 1 receptor (PTHR1) and B-cell lymphoma-2 (Bcl-2) were associated with tumor progression [7]. Another article performed a genome-wide cDNA expression analysis and found that Ollier’s disease and solitary enchondromas revealed similar expression profiles; JunB may be of diagnostic relevance to grade I chondrosarcomas [60]. This result was also supported by our study that JunB was also a DEG in our study. In addition, the increase in glycolysis-associated genes and decrease in oxidative phosphorylation-related genes was found in high-grade chondrosarcoma and these genes were considered to be associated with chondrosarcoma progression [60]. Compared with previous studies, the present study found several novel genes, such as GAPDH, MMP9, FOS, COL1A1 and EGR1, which might be potentially associated with enchondromas. We also discovered potential PPIs between these genes, and if the roles of these genes in enchondromas are confirmed, the genes could potentially be utilized in the molecular diagnosis or treatment selection of enchondromas.
This study had several limitations. First, the sample sizes for the expression profiling were not large, so further studies with larger sample sizes are needed to verify the results. Second, it is acknowledged that predicting key genes merely by means of bioinformatics is not sufficient, and further molecular biological experiments are needed to confirm these results. Therefore, we hope that these data can be incorporated into future experiments; the results can give us a better understanding of the molecular mechanisms and provide novel biomarkers for the molecular therapy of enchondromas. Despite these limitations, we believe that this analysis represents a valuable resource and may be meaningful for further diagnosis and therapy for this disease.
CONCLUSION
In conclusion, the present study identified 635 DEGs, which may be involved in the occurrence and development of enchondromas via comprehensive bioinformatics analysis. GO term, KEGG pathway and PPI network analyses provided a set of related genes and pathways to help elucidate the molecular mechanisms of enchondromas. Further experimental studies are needed to confirm these results and should help determine potential targets for diagnosis, prognosis, and treatment of enchondroma.
MATERIALS AND METHODS
Gene expression microarray data
In current study, the gene expression profiles of GSE22855 were downloaded from Gene Expression Omnibus (GEO, http://www.ncbi.nlm.nih.gov/geo/). GSE22855 was based on Illumina Inc GPL6884 platform (Illumina HumanWG-6 v3.0 expression beadchip). The GSE22855 dataset contained 13 samples, including 7 enchondromas samples and 6 control samples.
Identification of DEGs
The raw data files used for the analysis included TXT files (Illumina platform). The analysis was carried out using GEO2R, which can perform comparisons on original submitter-supplied processed data tables using the GEOquery and limma R packages from the Bioconductor project. The DEGs between the enchondromas samples and control samples were selected (P value < 0.05), and overlapped genes with statistical significance were identified.
GO enrichment and KEGG pathway analysis of the DEGs
After identifying the DEGs, we submitted the DEGs list to the online software Database for Annotation, Visualization and Integrated Discovery (DAVID, https://david.ncifcrf.gov/) to identify overrepresented GO categories and pathway categories. GO analysis can provide quantitative and statistical output files to determine the biological meaning in a large list of genes and categorize gene product functions, including biological process (BP), molecular function (MF) and cellular component (CC) [61, 62]. KEGG (http://www.genome.jp/) is a knowledge base for systematic analysis of gene functions, linking genomic information with higher-level systemic functions [63, 64]. Finally, the enriched functions of DEGs were selected via GO and KEGG pathway analysis, and P < 0.05 was considered statistically significant.
Construction of the PPI network of DEGs
To further investigate the molecular mechanism of enchondromas in development and progression, we used the Search Tool for the Retrieval of Interacting Genes (STRING) database (http://www.string-db.org/) to evaluate the interactive relationships among DEGs. We first submitted the DEGs list to STRING, and then, we selected the experimentally validated interactions with a combined score > 0.4. Subsequently, the PPI networks were analyzed using Cytoscape software. Then, the plug-in Molecular Complex Detection (MCODE) was applied to screen the modules of the PPI network in Cytoscape. Furthermore, the enrichment analyses were performed for DEGs in the corresponding modules. P < 0.05 was considered statistically significant.
Authors contributions
Study concept and design: ZJS; Literature search: HXZ, LL, YK and LL; Data analysis: ZJS, BP, ZJW and XY; Drafting of the manuscript: ZJS; Critical revision of the manuscript: SQF. All authors reviewed the manuscript.
CONFLICTS OF INTEREST
The authors have no conflicts of interest to disclose.
FUNDING
This work was supported by the National Natural Science Foundation of China (81501899), the State Key Program of the National Natural Science Foundation of China (81330042), the International Cooperation Program of National Natural Science Foundation of China (81620108018), the Special Program for Sino-Russian Joint Research Sponsored by the Ministry of Science and Technology, China (2014DFR31210), the Key Program Sponsored by the Tianjin Science and Technology Committee, China (13RCGFSY19000, 14ZCZDSY00044), the Science Foundation of Tianjin Medical University for Young Scholar (2014KYQ01) and the Tianjin Medical University General Hospital Funding (ZYYFY2014037).
REFERENCES
1. Walden MJ, Murphey MD, Vidal JA. Incidental enchondromas of the knee. AJR Am J Roentgenol. 2008; 190:1611–15.
2. Fletcher CD, Bridge JA, Hogendoorn PC, Mertens F. World Health Organization classification of tumours of soft tissue and bone. 4th ed. Lyon: IARC Press; 2013.
3. Bierry G, Kerr DA, Nielsen GP, Rosenberg AE, Huang AJ, Torriani M, Bredella MA. Enchondromas in children: imaging appearance with pathological correlation. Skeletal Radiol. 2012; 41:1223–29.
4. Gaulke R. The distribution of solitary enchondromata at the hand. J Hand Surg [Br]. 2002; 27:444–45.
5. Figl M, Leixnering M. Retrospective review of outcome after surgical treatment of enchondromas in the hand. Arch Orthop Trauma Surg. 2009; 129:729–34.
6. Verdegaal SH, Bovée JV, Pansuriya TC, Grimer RJ, Ozger H, Jutte PC, San Julian M, Biau DJ, van der Geest IC, Leithner A, Streitbürger A, Klenke FM, Gouin FG, et al. Incidence, predictive factors, and prognosis of chondrosarcoma in patients with Ollier disease and Maffucci syndrome: an international multicenter study of 161 patients. Oncologist. 2011; 16:1771–79.
7. Rozeman LB, Hameetman L, Cleton-Jansen AM, Taminiau AH, Hogendoorn PC, Bovée JV. Absence of IHH and retention of PTHrP signalling in enchondromas and central chondrosarcomas. J Pathol. 2005; 205:476–82.
8. Fletcher CD, Unni KK, Mertens F. World Health Organization classification of tumours. Pathology and genetics of tumours of soft tissue and bone. Lyon: IARC Press; 2002.
9. Goto T, Motoi T, Komiya K, Motoi N, Okuma T, Okazaki H, Takatori Y, Tange T, Nakamura K. Chondrosarcoma of the hand secondary to multiple enchondromatosis; report of two cases. Arch Orthop Trauma Surg. 2003; 123:42–47.
10. Silve C, Jüppner H. Ollier disease. Orphanet J Rare Dis. 2006; 1:37.
11. Larsson SE, Lorentzon R. The geographic variation of the incidence of malignant primary bone tumors in Sweden. J Bone Joint Surg Am. 1974; 56:592–600.
12. Angelini A, Guerra G, Mavrogenis AF, Pala E, Picci P, Ruggieri P. Clinical outcome of central conventional chondrosarcoma. J Surg Oncol. 2012; 106:929–37.
13. Logie CI, Walker EA, Forsberg JA, Potter BK, Murphey MD. Chondrosarcoma: A Diagnostic Imager’s Guide to Decision Making and Patient Management. Semin Musculoskelet Radiol. 2013; 17:101–15.
14. Chen JC, Fong YC, Tang CH. Novel strategies for the treatment of chondrosarcomas: targeting integrins. BioMed research international. 2013; 2013:396839.
15. Wolf M, El-Rifai W, Tarkkanen M, Kononen J, Serra M, Eriksen EF, Elomaa I, Kallioniemi A, Kallioniemi OP, Knuutila S. Novel findings in gene expression detected in human osteosarcoma by cDNA microarray. Cancer Genet Cytogenet. 2000; 123:128–32.
16. Baena-Ocampo LC, Ramirez-Perez E, Linares-Gonzalez LM, Delgado-Chavez R. Epidemiology of bone tumors in Mexico City: retrospective clinicopathologic study of 566 patients at a referral institution. Ann Diagn Pathol. 2009; 13:16–21.
17. Liu J, Hudkins PG, Swee RG, Unni KK. Bone sarcomas associated with Ollier’s disease. Cancer. 1987; 59:1376–85.
18. Schwartz HS, Zimmerman NB, Simon MA, Wroble RR, Millar EA, Bonfiglio M. The malignant potential of enchondromatosis. J Bone Joint Surg Am. 1987; 69:269–74.
19. Hong ED, Carrino JA, Weber KL, Fayad LM. Prevalence of shoulder enchondromas on routine MR imaging. Clin Imaging. 2011; 35:378–84.
20. Lamm DL, Riggs DR. Enhanced immunocompetence by garlic: role in bladder cancer and other malignancies. J Nutr. 2001; 131:1067S–70S.
21. Fang F, Zuo Q, Pilrose J, Wang Y, Shen C, Li M, Wulfridge P, Matei D, Nephew KP. Decitabine reactivated pathways in platinum resistant ovarian cancer. Oncotarget. 2014; 5:3579–89. doi: 10.18632/oncotarget.1961
22. Ling L, Tan SK, Goh TH, Cheung E, Nurcombe V, van Wijnen AJ, Cool SM. Targeting the heparin-binding domain of fibroblast growth factor receptor 1 as a potential cancer therapy. Mol Cancer. 2015; 14:136.
23. Liang B, Li C, Zhao J. Identification of key pathways and genes in colorectal cancer using bioinformatics analysis. Med Oncol. 2016; 33:111.
24. Sinha S, Su S, Workentine M, Agabalyan N, Cheng M, Gabriel V, Biernaskie J. Transcriptional Analysis Reveals Evidence of Chronically Impeded ECM Turnover and Epithelium-to-Mesenchyme Transition in Scar Tissue Giving Rise to Marjolin’s Ulcer. J Burn Care Res. 2017; 38:e14-e22.
25. Bagordakis E, Sawazaki-Calone I, Macedo CC, Carnielli CM, de Oliveira CE, Rodrigues PC, Rangel AL, Dos Santos JN, Risteli J, Graner E, Salo T, Paes Leme AF, Coletta RD. Secretome profiling of oral squamous cell carcinoma-associated fibroblasts reveals organization and disassembly of extracellular matrix and collagen metabolic process signatures. Tumour biology. 2016; 37:9045-9057.
26. Zhang HJ, Tao J, Sheng L, Hu X, Rong RM, Xu M, Zhu TY. Twist2 promotes kidney cancer cell proliferation and invasion via regulating ITGA6 and CD44 expression in the ECM-Receptor-Interaction pathway. Biomedicine & pharmacotherapy. 2016; 81:453-459.
27. Akkiprik M, Peker İ, Özmen T, Amuran GG, Güllüoğlu BM, Kaya H, Özer A. Identification of Differentially Expressed IGFBP5-Related Genes in Breast Cancer Tumor Tissues Using cDNA Microarray Experiments. Genes (Basel). 2015; 6:1201–14.
28. Wang DD, Liu ZW, Han MM, Zhu ZM, Tu YL, Dou CQ, Jin X, Cai SW, Du N. Microarray based analysis of gene expression patterns in pancreatic neuroendocrine tumors. Eur Rev Med Pharmacol Sci. 2015; 19:3367–74.
29. Jeganathan N, Predescu D, Zhang J, Sha F, Bardita C, Patel M, Wood S, Borgia JA, Balk RA, Predescu S. Rac1-mediated cytoskeleton rearrangements induced by intersectin-1s deficiency promotes lung cancer cell proliferation, migration and metastasis. Mol Cancer. 2016; 15:59.
30. Kong J, Du J, Wang Y, Yang M, Gao J, Wei X, Fang W, Zhan J, Zhang H. Focal adhesion molecule Kindlin-1 mediates activation of TGF-β signaling by interacting with TGF-βRI, SARA and Smad3 in colorectal cancer cells. Oncotarget. 2016; 7:76224–37. doi: 10.18632/oncotarget.12779.
31. Mendoza P, Ortiz R, Díaz J, Quest AF, Leyton L, Stupack D, Torres VA. Rab5 activation promotes focal adhesion disassembly, migration and invasiveness in tumor cells. J Cell Sci. 2013; 126:3835–47.
32. Warfel NA, Kraft AS. PIM kinase (and Akt) biology and signaling in tumors. Pharmacol Ther. 2015; 151:41–49.
33. Zhang JY, Zhang F, Hong CQ, Giuliano AE, Cui XJ, Zhou GJ, Zhang GJ, Cui YK. Critical protein GAPDH and its regulatory mechanisms in cancer cells. Cancer Biol Med. 2015; 12:10–22.
34. Chow RK, Sin ST, Liu M, Li Y, Chan TH, Song Y, Chen L, Kwong DL, Guan XY. AKR7A3 suppresses tumorigenicity and chemoresistance in hepatocellular carcinoma through attenuation of ERK, c-Jun and NF-κB signaling pathways. Oncotarget. 18 Oct 2016. doi: 10.18632/oncotarget.12726. [Epub ahead of print].
35. Peng Y, Zhang P, Huang X, Yan Q, Wu M, Xie R, Wu Y, Zhang M, Nan Q, Zhao J, Li A, Xiong J, Ren Y, et al. Direct regulation of FOXK1 by C-jun promotes proliferation, invasion and metastasis in gastric cancer cells. Cell Death Dis. 2016; 7:e2480.
36. Bai L, Lin G, Sun L, Liu Y, Huang X, Cao C, Guo Y, Xie C. Upregulation of SIRT6 predicts poor prognosis and promotes metastasis of non-small cell lung cancer via the ERK1/2/MMP9 pathway. Oncotarget. 2016; 7:40377–86. doi: 10.18632/oncotarget.9750.
37. Liu Y, Lv H, Wu X, Zhou J, Shi Y, Wen J. Demethylation of Repressor Element-1 Silencing Transcription (REST) suppresses the malignant phenotype of breast cancer via MMP9. Oncol Res. 2016.
38. Wang Q, Yu W, Huang T, Zhu Y, Huang C. RUNX2 promotes hepatocellular carcinoma cell migration and invasion by upregulating MMP9 expression. Oncol Rep. 2016; 36:2777–84.
39. Wu WB, Wang W, Du YH, Li H, Xia SJ, Liu HT. MicroRNA-3713 regulates bladder cell invasion via MMP9. Sci Rep. 2016; 6:32374.
40. Hayashi M, Nomoto S, Hishida M, Inokawa Y, Kanda M, Okamura Y, Nishikawa Y, Tanaka C, Kobayashi D, Yamada S, Nakayama G, Fujii T, Sugimoto H, et al. Identification of the collagen type 1 α 1 gene (COL1A1) as a candidate survival-related factor associated with hepatocellular carcinoma. BMC Cancer. 2014; 14:108.
41. Ganapathi MK, Jones WD, Sehouli J, Michener CM, Braicu IE, Norris EJ, Biscotti CV, Vaziri SA, Ganapathi RN. Expression profile of COL2A1 and the pseudogene SLC6A10P predicts tumor recurrence in high-grade serous ovarian cancer. Int J Cancer. 2016; 138:679–88.
42. Misawa K, Kanazawa T, Misawa Y, Imai A, Endo S, Hakamada K, Mineta H. Hypermethylation of collagen α2 (I) gene (COL1A2) is an independent predictor of survival in head and neck cancer. Cancer Biomark. 2011-2012; 10:135–44.
43. Choi EJ, Yoo NJ, Kim MS, An CH, Lee SH. Putative Tumor Suppressor Genes EGR1 and BRSK1 Are Mutated in Gastric and Colorectal Cancers. Oncology. 2016; 91:289–94.
44. Pal SK, Nguyen CT, Morita KI, Miki Y, Kayamori K, Yamaguchi A, Sakamoto K. THBS1 is induced by TGFB1 in the cancer stroma and promotes invasion of oral squamous cell carcinoma. Journal of oral pathology & medicine. 2016; 45:730-739.
45. Lian R, Lu B, Jiao L, Li S, Wang H, Miao W, Yu W. MiR-132 plays an oncogenic role in laryngeal squamous cell carcinoma by targeting FOXO1 and activating the PI3K/AKT pathway. Eur J Pharmacol. 2016; 792:1–6.
46. Abbas S, Lugthart S, Kavelaars FG, Schelen A, Koenders JE, Zeilemaker A, van Putten WJ, Rijneveld AW, Löwenberg B, Valk PJ. Acquired mutations in the genes encoding IDH1 and IDH2 both are recurrent aberrations in acute myeloid leukemia: prevalence and prognostic value. Blood. 2010; 116:2122–26.
47. Green A, Beer P. Somatic mutations of IDH1 and IDH2 in the leukemic transformation of myeloproliferative neoplasms. N Engl J Med. 2010; 362:369–70.
48. van den Bent MJ, Dubbink HJ, Marie Y, Brandes AA, Taphoorn MJ, Wesseling P, Frenay M, Tijssen CC, Lacombe D, Idbaih A, van Marion R, Kros JM, Dinjens WN, et al. IDH1 and IDH2 mutations are prognostic but not predictive for outcome in anaplastic oligodendroglial tumors: a report of the European Organization for Research and Treatment of Cancer Brain Tumor Group. Clin Cancer Res. 2010; 16:1597-1604.
49. Amary MF, Bacsi K, Maggiani F, Damato S, Halai D, Berisha F, Pollock R, O’Donnell P, Grigoriadis A, Diss T, Eskandarpour M, Presneau N, Hogendoorn PC, et al. IDH1 and IDH2 mutations are frequent events in central chondrosarcoma and central and periosteal chondromas but not in other mesenchymal tumours. J Pathol. 2011; 224:334–43.
50. Yen KE, Bittinger MA, Su SM, Fantin VR. Cancer-associated IDH mutations: biomarker and therapeutic opportunities. Oncogene. 2010; 29:6409–17.
51. Dang L, Jin S, Su SM. IDH mutations in glioma and acute myeloid leukemia. Trends Mol Med. 2010; 16:387–97.
52. Figueroa ME, Abdel-Wahab O, Lu C, Ward PS, Patel J, Shih A, Li Y, Bhagwat N, Vasanthakumar A, Fernandez HF, Tallman MS, Sun Z, Wolniak K, et al. Leukemic IDH1 and IDH2 mutations result in a hypermethylation phenotype, disrupt TET2 function, and impair hematopoietic differentiation. Cancer Cell. 2010; 18:553–67.
53. Baylin SB. DNA methylation and gene silencing in cancer. Nat Clin Pract Oncol. 2005; 2:S4–11.
54. Portela A, Esteller M. Epigenetic modifications and human disease. Nat Biotechnol. 2010; 28:1057–68.
55. Yang X, Han H, De Carvalho DD, Lay FD, Jones PA, Liang G. Gene body methylation can alter gene expression and is a therapeutic target in cancer. Cancer Cell. 2014; 26:577–90.
56. Zhang BG, Hu L, Zang MD, Wang HX, Zhao W, Li JF, Su LP, Shao Z, Zhao X, Zhu ZG, Yan M, Liu B. Helicobacter pylori CagA induces tumor suppressor gene hypermethylation by upregulating DNMT1 via AKT-NFκB pathway in gastric cancer development. Oncotarget. 2016; 7:9788–800. doi: 10.18632/oncotarget.7125.
57. Bignell GR, Huang J, Greshock J, Watt S, Butler A, West S, Grigorova M, Jones KW, Wei W, Stratton MR, Futreal PA, Weber B, Shapero MH, Wooster R. High-resolution analysis of DNA copy number using oligonucleotide microarrays. Genome Res. 2004; 14:287–95.
58. Lindblad-Toh K, Tanenbaum DM, Daly MJ, Winchester E, Lui WO, Villapakkam A, Stanton SE, Larsson C, Hudson TJ, Johnson BE, Lander ES, Meyerson M. Loss-of-heterozygosity analysis of small-cell lung carcinomas using single-nucleotide polymorphism arrays. Nat Biotechnol. 2000; 18:1001–05.
59. Pansuriya TC, Oosting J, Krenács T, Taminiau AH, Verdegaal SH, Sangiorgi L, Sciot R, Hogendoorn PC, Szuhai K, Bovée JV. Genome-wide analysis of Ollier disease: is it all in the genes? Orphanet J Rare Dis. 2011; 6:2.
60. Rozeman LB, Hameetman L, van Wezel T, Taminiau AH, Cleton-Jansen AM, Hogendoorn PC, Bovée JV. cDNA expression profiling of chondrosarcomas: ollier disease resembles solitary tumours and alteration in genes coding for components of energy metabolism occurs with increasing grade. J Pathol. 2005; 207:61–71.
61. Ashburner M, Ball CA, Blake JA, Botstein D, Butler H, Cherry JM, Davis AP, Dolinski K, Dwight SS, Eppig JT, Harris MA, Hill DP, Issel-Tarver L, The Gene Ontology Consortium, et al. Gene ontology: tool for the unification of biology. Nat Genet. 2000; 25:25–29.
62. Feng W, Wang G, Zeeberg BR, Guo K, Fojo AT, Kane DW, Reinhold WC, Lababidi S, Weinstein JN, Wang MD. Development of gene ontology tool for biological interpretation of genomic and proteomic data. AMIA Annu Symp Proc. 2003; 2003: 839.
63. Altermann E, Klaenhammer TR. PathwayVoyager: pathway mapping using the Kyoto Encyclopedia of Genes and Genomes (KEGG) database. BMC Genomics. 2005; 6:60.
64. Kanehisa M, Goto S. KEGG: kyoto encyclopedia of genes and genomes. Nucleic Acids Res. 2000; 28:27–30.