
Introduction
In order to develop within immunocompetent hosts, it is imperative that tumors evolve several immune escape strategies, such as mutations causing antigen loss or alteration of the antigen processing and presentation machinery [1, 2]. Other mechanisms that lead to immune evasion have also been identified in lymphoma; they include the impairment of immune cell infiltration through endothelial defects, the inhibition of immune activation by the secretion of suppressive mediators such as TGF-β and IL-10 [3], the local recruitment of immunosuppressive cells such as regulatory T cells (Tregs) [4], tumor-associated macrophages (TAMs) [5] and myeloid-derived suppressor cells (MDSC) [6, 7], and the impairment of functional anti-tumor responses through the up-regulation of immune checkpoint gene expression [8-11]. One of the most commonly dysregulated checkpoints involves the interaction of the programmed death-1 receptor (PD-1, CD279) at the surface of T lymphocytes with its ligand programmed death-ligand-1 (PD-L1) or PD-L2, which are found at the surface of macrophages and some tumor cells. This interaction delivers inhibitory signals that ultimately cause apoptosis, anergy or functional exhaustion of the T cells involved. Recently, we and others reported the over-expression of PD-L1 in non-Hodgkin lymphoma tumor cells and the increased expression of PD-1 in tumor-infiltrating lymphocytes (TILs) [9, 10, 12, 13]. Thus, treatment with immune checkpoint inhibitors targeting PD-1/PD-L1, either alone or in combination with other immune checkpoint inhibitors, can restore T cell effector function [14] and has emerged as a promising strategy for hematological malignancy therapy, particularly in patients with refractory Hodgkin lymphoma [15, 16], relapsed follicular lymphoma (FL) [17], and other aggressive non-Hodgkin lymphoma (NHL) [18, 19].
Here, we review the literature on PD-1 and PD-L1 protein expression levels in NHL and the mechanisms of their up-regulation, as well as the prognostic relevance of these proteins in NHL patients.
The biology of the PD-1/PD-L1/2 axis
The main physiological role of PD-1 is in limiting autoimmunity in an inflammatory context (e.g. in response to infection) by restricting the activity of T cells in peripheral tissues [20, 21]. PD-1/PD-L1 interactions usually occur predominantly in peripheral tissues, however in some cancers, for example lymphoma developing in lymphoid organs, PD-1 engagement can reduce the anti-tumor response of effector T cells. At the intracellular level, signaling downstream of the PD-1/PD-L1/2 interaction reduces the duration of the synaptic contact [22], by down-regulating TCR signaling through a pathway thought to involve the SHP2 phosphatase [23] and thereby impairing the immunological synapse formed between effector T cells and antigen presenting cells. PD-1 is expressed by T cells, B cells and natural killer (NK) cell effectors, and has been described as an exhaustion marker in cancer and chronic viral infections [24-27]. PD-L1 (CD274) is physiologically expressed at the surface of B cells, T cells and macrophages, whereas PD-L2 (CD273) is mainly expressed by antigen-presenting cells and epithelial tissues [20]. In many solid cancers, PD-1 is upregulated by a large proportion of TILs, whereas its ligands PD-L1 and PD-L2 are expressed by a variety of tumor cells [28-30] and cause a reduction in anti-tumor immunity.
In lymphoma, PD-1 is frequently upregulated in tumor cells themselves. For example, its expression is regularly reported in peripheral T cell lymphoma (PTCL) derived from follicular helper T cells (TFH) such as angioimmunoblastic T cell lymphoma, follicular T cell lymphoma and nodal peripheral T cell lymphoma with TFH phenotype. Likewise, some neoplastic B cells (prolymphocytes/paraimmunoblasts) in chronic lymphocytic leukemia (CLL) frequently up-regulate PD-1 [28-31]. Its ligands, PD-L1 (B7-H1, CD274) and PD-L2 (B7H3, CD273), are also often expressed by the tumor cells in some B cell or T cell lymphoma (Table 1). The proliferation-reducing effect of PD-L1 blockade in different lymphoma cell lines suggests a key role for PD-1/PD-L1 expression in NHL lymphomagenesis [32]. Intracellular PD-1 signaling in effector T cells, which is activated upon binding to PD-L1 or PD-L2, reduces T cell activation signaling and inhibits efficient antitumor immune function [33]. In the microenvironment of NHL tumors, PD-1 and PD-L1 can be expressed on effector T and myeloid cells, respectively [33, 34], and participate in NHL immune escape strategies. Several mechanisms collectively referred to as intrinsic and adaptive immune resistance can account for the overexpression of PD-L1 and PD-L2 by malignant lymphoid cells. These mechanisms, schematically depicted in Figure 1, are not mutually exclusive and may co-exist in the same tumor [35-43].
Table 1: Summary of studies assessing PD-1/PD-L1 protein expression in NHL and its impact on NHL patient outcome.
PD-L1 protein expression in NHL |
||||||
NHL subtype |
Study (number of cases) |
Technical approach (Antibody source / clone) |
Scoring methodology -- Cut offs |
Frequency of PD-L1 protein expression |
Outcome |
|
Tumor cells |
ME cells |
|||||
DLBCL |
Kiyasu J. & al.,[54] Blood 2015 (n=1121) |
PD-L1 IHC FFPE (Abcam / EPR1161) |
PD-L1+ if >30% cells showed positive staining |
mPD-L1+ if in >20% of the ME (tissue area) |
10.5% of DLBCL had PD-L1+ tumor cells 15.3% of DLBCL had mPD-L1+ ME cells |
PD-L1+ DLBCL had lower OS than PD-L1- DLBCL (50% vs 75% at 2 years, p=0.0009) (maintained in multivariate analysis with Adj. p=0.0323) No significant difference in OS between mPD-L1+ and mPD-L1- DLBCL (p=0.31) |
Chen B. & al.,[13] CCR 2013 (n=66 DLBCL NOS and 9 DLBCL EBV+) |
PD-L1 IHC FFPE (Sino Bio / 15) |
PD-L1+ if >5% cells had a 2+ or 3+ level of staining intensity |
mPD-L1+ if >20% of the ME (tissue area) had a 2+ or 3+ level of staining intensity |
11% of DLBCL NOS had PD-L1+ tumor cells 14% of DLBCL NOS had mPD-L1+ ME cells 100% of EBV+ DLBCL had PD-L1+ tumor cells 100% of EBV+ DLBCL had mPD-L1+ ME cells |
NA |
|
Laurent C. & al.,[10] Oncoimmunol. 2015 (n=27) |
PD-L1 IHC FFPE (Ventana / SP142) |
PD-L1+ if >10% cells had a 2+ or 3+ level of staining intensity |
mPD-L1+ if >10% cells had a 2+ or 3+ level of staining intensity |
41% of DLBCL had PD-L1+ tumor cells 26% of DLBCL had mPD-L1+ ME cells |
NA |
|
Vranic S. & al.,[86] PLOS one 2016 (n=49) |
PD-L1 IHC FFPE (Ventana / SP142) PD-L1 IHC FFPE (Ventana / SP263) |
PD-L1+ if >5% cells had a 2+ or 3+ level of staining intensity |
NA |
50% of rDLBCL had PD-L1+ (SP142) tumor cells 57% of rDLBCL had PD-L1+ (SP263) tumor cells |
NA |
|
Kwon D. & al.,[59] Histopathology 2016 (n=126) |
PD-L1 IHC FFPE (Cell signaling / E1L3N) |
PD-L1+ if >10% cells had a 1, 2 or 3 level of staining intensity |
NA |
61.1% of DLBCL had PD-L1+ (ABC>GCB) tumor cells |
No significant difference between PD-L1+ and PD-L1- DLBCL (p=0.238) (univariate analysis) |
|
Menter T. & al.,[68] Hum Pathol 2016 (n=260) |
PD-L1 IHC FFPE (Cell signaling / E1L3N) |
PD-L1+ if >5% cells showed positive staining |
NA |
31% of DLBCL had PD-L1+ tumor cells |
NA (done for HL) |
|
FL |
Carreras J. & al.,[78] JCO 2009 (n=5) |
PD-L1 Flow cytometry (Pharmingen / MIH1) |
If cells showed greater PD-L1+ staining relative to the isotype control |
NA |
FL tumor cells were PD-L1- |
NA (done for PD-1) |
Laurent C. & al.,[10] Oncoimmunol. 2015 (n=27) |
PD-L1 IHC FFPE (Ventana / SP142) |
PD-L1+ if >10% cells had a 2+ or 3+ level of staining intensity |
mPD-L1+ if >10% cells had a 2+ or 3+ level of staining intensity |
FL tumor cells were PD-L1- 10% of FL had mPD-L1+ ME cells |
NA |
|
Menter T. & al.,[68] Hum Pathol 2016 (n=59) |
IHC FFPE (Cell Signaling / E1L3N) |
PD-L1+ if >5% cells showed positive staining |
NA |
6% of grade 1-2 FL and 11% of grade 3 FL were PD-L1+ (weak expression) |
NA (done for HL) |
|
Ramsay AG. & al.,[83] Blood 2012 (n=59) |
PD-L1 IHC FFPE (Abcam / polyclonal) |
NA |
NA |
Intrafollicular FL cells were PD-L1+ |
Increased PD-L1 expression in the FL poor-prognosis group (survival < 5 yrs) vs in the FL good-prognosis group (survival > 15 yrs) (univariate analysis) |
|
PMBL |
Andorsky D. & al.,[12] CCR 2011 (n=3) |
PD-L1 IHC frozen (eBioscience / MIH1) |
NA |
NA |
100% of PMBL are PD-L1+ (undefined cell type) |
NA |
Chen B. & al.,[13] CCR 2013 (n=21) |
PD-L1 IHC FFPE (Sino Bio / 15) |
PD-L1+ if >5% cells had a 2+ or 3+ level of staining intensity |
mPD-L1+ if >20% ME (tissue area) had a 2+ or 3+ level of staining intensity |
71% of PMBL had PD-L1+ tumor cells 90% of PMBL had PD-L1+ ME cells |
NA |
|
Vranic S. & al.,[86] PLOS one 2016 (n=3) |
PD-L1 IHC FFPE (Ventana / SP142) PD-L1 IHC FFPE (Ventana / SP263) |
PD-L1+ if >5% cells had a 2+ or 3+ level of staining intensity |
NA |
100% of rPMBL had PD-L1+ (SP142) tumor cells 100% of rPMBL had PD-L1+ (SP263) tumor cells |
NA |
|
PL |
Laurent C. & al.,[58] Haematologica 2015 (n=40) |
PD-L1 IHC FFPE (Ventana / SP142) |
PD-L1+ if >5% cells had a 2+ or 3+ level of staining intensity |
PD-L1+ if >10% cells had a 2+ or 3+ level of staining intensity |
2.5% of PL had PD-L1+ tumor cells 60% of PL had PD-L1+ ME cells 78% of EBV+ PL had PD-L1+ tumor cells |
NA (done for EBV) |
CLL |
Xerri L. & al.,[56] Hum Pathol 2008 (n=11) |
PD-L1 flow cytometry (mice immunization / PD-L1.3. 1) |
PD-L1+ if >1% cells had a 1+, 2+ or 3+ level of staining intensity |
NA |
0% of CLL had PD-L1+ tumor cells (blood) |
NA |
Brusa D. & al.,[84] Haematologica 2014 (n=20) |
PD-L1 IHC FFPE (Novus biologicals / polyclonal) |
% of PD-L1+ areas in proliferative centers (PC) |
NA |
10% of CLL cells had PD-L1+ PC vs 5% outside PC |
NA |
|
Ramsay AG. & al.,[83] Blood 2012 (n=35 for clinics, n=71 for IHC) |
PD-L1 IHC FFPE (Abcam / polyclonal) Flow cytometry (eBioscience / MIH1) |
NA |
NA |
Increased expression of PD-L1 in CD20+ B cells from CLL lymph nodes and blood (vs healthy donors). |
Increased PD-L1 expression in the CLL poor-prognosis group (survival < 5 yrs) vs in the CLL good-prognosis group (survival > 15 yrs). (univariate analysis) |
|
Menter T. & al.,[68] Hum Pathol 2016 (n=37) |
PD-L1 IHC FFPE (Cell signaling / E1L3N) |
PD-L1+ if >5% cells showed positive staining |
NA |
3% of CLL had PD-L1+ tumor cells |
NA (done for HL) |
|
T-NHL |
Wilcox R.A. & al.,[85] Blood 2009 (n=54 PTCL; n=20 AITL; n=8 CTCL) |
PD-L1 IHC FFPE (NA / 5H1) PD-L1 IHC FFPE (NA / 5H2) PD-L1 IHC FFPE (NA / 5H3) |
PD-L1+ if >30% cells showed positive staining |
NA |
17% of PTCL had PD-L1+ tumor cells 5% of AITL had PD-L1+ tumor cells 27% of CTCL had PD-L1+ tumor cells |
NA |
Andorsky D. & al.,[12] CCR 2011 (n=5) |
PD-L1 Flow cytometry frozen (eBioscience / MIH1) |
NA |
NA |
80% of ALCL are PD-L1+ (undefined cell type) |
NA |
|
Brown J.A. & al.,[87] JI 2003 (n=11) |
PD-L1 IHC FFPE (mice immunization / Ab29E.2A3) |
If cells showed greater PD-L1+ staining relative to the isotype control |
NA |
64% of PTCL are PD-L1+ (undefined cell type) |
NA |
|
Miyoshi H. & al.,[92] Blood 2016 (n=135) |
PD-L1 IHC FFPE (Abcam / EPR1161) |
PD-L1+ if >50% cells showed positive staining |
mPD-L1+ if > 10 cells PD-1+ / HPF |
7% of ATLL had PD-L1+ tumor cells 59% of ATLL had PD-L1+ ME cells |
PD-L1+ ATLL (expressed on tumor cells) have a worse OS compared to PD-L1- ATLL (40% vs 10% at 2 yrs, p=0.0085). PD-L1+ ATLL (on ME cells) have a better OS compared to PD-L1- ATLL (48% vs 20% at 2 yrs, p=0.0029) (maintained in multivariate analysis with Adj p=0.0322 and Adj p=0.0014, respectively) |
|
Vranic S. & al.,[86] PLOS one 2016 (n=11) |
PD-L1 IHC FFPE (Ventana / SP142) PD-L1 IHC FFPE (Ventana / SP263) |
PD-L1+ if >5% cells had a 2+ or 3+ level of staining intensity |
NA |
28% of rPTCL had PD-L1+ (SP142) tumor cells 28% of rPTCL had PD-L1+ (SP263) tumor cells |
NA |
|
PD-1 protein expression in NHL |
||||||
DLBCL |
Ko Y. & al.,[60] Korean J Pathol 2011 (n=63) |
PD-1 IHC FFPE (Abcam / NAT) |
NA |
mPD-1+ if >20 TILs PD-1+ / HPF |
52.4% of DLBCL had mPD-1+ ME cells |
mPD-1+ was associated with a poor prognosis in DLBCL patients (p=0.12, univariate analysis) |
Ahearne M. & al.,[70] Virchows Arch 2014 (n=70) |
PD-1 IHC FFPE (Dr Roncador / NA) |
NA |
mPD-1+ > Median expression of PD-1 |
PD-1+ cells were found in rosettes around lymphoma cells |
High PD-1 expression correlated with OS (95% vs 60% at 2 years p=0,0007) (maintained in multivariate analysis with Adj p=<0.05) |
|
Muenst S. & al.,[55] Disease Markers 2010 (n=55 for clinics / n=184 for IHC) |
PD-1 IHC FFPE (R&D, polyclonal) |
NA |
mPD-1+ > 2.8% cells PD-1+ |
PD-1+ TILs found in transformed DLBCL were more abundant than those found in primary DLBCL |
mPD-1+ TILs showed a prognostic significance for DSS (100% vs 80% at 2 years, p=0.032, univariate analysis) (not maintained in multivariate analysis with Adj p>0.05) |
|
Zhang W. & al.,[73] Cancer Medicine 2016 (n=50 for clinics / n=31 for IHC) |
PD-1 IHC FFPE (Abcam / NAT) PD-1 flow cytometry (BD Biosciences / MIH4) |
H score calculation: H = (PD-1 staining intensity: 0, 1, 2, 3) x (percentage of positive cells: 0 for <1%, 1 for 1-25%, 2 for 25-49%, 3 for >50%) |
mPD-1+ CD4+ if > 30.25% of cells showed positive staining |
65% of DLBCL were PD-1+ (H>1) (undefined cell type) No correlation between % of PD-1+/CD4+ in blood vs % of PD-1+ cells in tissues |
EFS and OS were lower in PD-1+ patients (p>0.05, not significant) Patients with higher % mPD-1+CD4+ T cells had lower EFS and OS (90% vs 50% at 15 months p=0.005; 97% vs 65% at 15 months p=0.009, respectively, univariate analysis) |
|
Kwon D. & al.,[59] Histopathology 2016 (n=78 for clinics / 121 for IHC) |
PD-1 IHC FFPE (Cell Marque / MRQ-22) |
NA |
Number of PD-1+ cells / HPF (Groups: 1 (<10), 2 (10-30), 3 (>30)) |
68.6% of DLBCL had PD-1+ TILs |
A high number of PD-1+ TILs correlated with a high OS (80% vs 55% at 2 years, p=0.026) and high PFS (80% vs 40% at years, p=0.005) in R-CHOP-treated DLBCL patients. (maintained in multivariate analysis for OS with Adj p=0.006) |
|
Laurent C. & al.,[58] Oncoimmunol 2015 (n=27) |
PD-1 IHC FFPE (Abcam / NAT105) |
PD-1+ if >60% cells had a 2+ or 3+ level of staining intensity |
PD-1+ if >10% cells had a 2+ or 3+ level of staining intensity |
22% of DLBCL had PD-1+ tumor cells 48% of DLBCL had PD-1+ ME cells |
NA |
|
FL |
Carreras J. & al.,[78] JCO 2009 (n=89 for clinics / n=100 for IHC) |
PD-1 IHC FFPE (Abcam / NAT-105) |
NA |
NA |
21,8% of FL cells are PD-1+ (undefined cell type) |
A high number of PD1+ cells was associated with a high PFS and OS (75% vs 50% at 2 years, p=0.038; 100% vs 80% at 2 years, p=0.004, respectively) (maintained in multivariate analysis for OS with Adj p=0.013) |
Richendollar BG. & al.,[79] Hum Pathol 2011 (n=91) |
PD-1 IHC FFPE (Abcam / NAT-105) |
NA |
PD-1+ if > 35.6 PD-1+ cells / HPF |
49% of FL had intrafollicular PD-1+ cells (undefined cell type) |
A high number of mPD-1+ T cells was associated with a decreased OS (p=0.10, not significant, univariate analysis) |
|
Smeltzer J. & al.,[81] CCR 2014 (n=58) |
PD-1 IHC FFPE (Abcam / NAT-105) |
Follicular vs diffuse pattern |
Follicular vs diffuse pattern |
FL were PD-1+, with diffuse or intrafollicular pattern of expression. Pattern of PD-1+ expression predicted clinical outcome. |
Diffuse PD-1 expression was associated with a shorter time to transformation, or TTT (p=0.033) and inferior OS (85% vs 45% at 5 years, p=0.009). (maintained in multivariate analysis with Adj p=0.045 for TTT, Adj. p=0.012 for OS) |
|
Wahlin BE. & al.,[75] CCR 2010 (n=64) |
IHC FFPE (CNIO gift / NA) |
Follicular vs interfollicular pattern |
Follicular vs interfollicular pattern |
PD-1 expression was more frequent inside than outside the follicles in FL. |
Follicular PD-1 expression was associated with a good outcome (multivariate analysis with Adj. p=0.0689) |
|
Yang ZZ. & al.,[82] Blood Cancer Journal 2015 (n=32) |
Flow cytometry (NA / NA) |
NA |
Dimly or brightly staining for PD-1 expression in T CD4+ or CD8+ cells, |
PD-1 was expressed at high and low levels in CD4+ and CD8+ T cells |
CD4+ mPD1+dim was associated with poorer OS (95% vs 75% at 5 years, p=0.007, univariate analysis) CD8+ mPD-1dim was associated with poorer OS (100% vs 70% at 5 years, p=0.026, univariate analysis) |
|
Ramsay AG. & al.,[83] Blood 2012 (n=59) |
PD-1 IHC FFPE (Abcam / NAT-105) |
NA |
NA |
Increased expression of PD-1 in FL interfollicular T cells (vs reactive tissues) |
Increased PD-1 expression in the FL poor-prognosis group (survival < 5 yrs) vs in the FL good prognosis group (survival > 15 yrs) (Univariate analysis) |
|
Dorfman D. & al.,[77] Am J Surg Pathol 2006 (n=6) |
PD-1 IHC FFPE (mice immunization / EH12) |
NA |
mPD-1+ if > 20% cells showed positive staining |
0% of FL had PD-1+ tumor cells |
NA |
|
PL |
Laurent C. & al.,[58] Haematologica 2016 (n=40) |
PD-1 IHC FFPE (Abcam / NAT-105) |
PD-1+ if >5% cells had a 2+ or 3+ level of staining intensity |
PD-1+ if >10% cells had a 2+ or 3+ level of staining intensity |
5% of PL had PD-1+ tumor cells 60% of PL had PD-1+ ME cells 54% of EBV+ PL had PD-1+ ME cells |
NA (done for EBV) |
CLL |
Xerri L. & al.,[56] Hum Pathol 2008 (n=11) |
PD-1 flow cytometry (mice immunization / PD-L1.3. 1) |
PD-L1+ if >1% cells had a 1+, 2+ or 3+ level of staining intensity |
NA |
91% of CLL had PD-1+ tumor cells |
NA |
Brusa D. & al.,[84] Haematologica 2013 (n=20) |
PD-1 IHC FFPE (R&D / polyclonal) |
NA |
% of PD-1+ areas in proliferative centers (PC) |
In CLL, PD-1 is expressed at higher levels in PC (13% of PD-1+ areas) compared to other place (8% of PD-1+ areas) |
NA |
|
Ramsay AG. & al.,[83] Blood 2012 (n=35 for clinics, n=71 for IHC) |
PD-1 IHC FFPE (Abcam / NAT-105) Flow cytometry (eBioscience / MIH4) |
NA |
NA |
PD-1 expression was increased in CLL T cells (vs reactive tissues and healthy donor blood) |
Increased PD-1 expression in CD3+ cells in the CLL poor-prognosis group (survival < 38 months) vs in the CLL good prognosis group (survival > 10 yrs) (Univariate analysis) |
|
T-NHL |
Cetinözman F. & al.,[88] Am J Surg Pathol 2012 (n=11 MF tumor stage ; n=26 PCSM-TCL) |
PD-1 IHC FFPE (R&D / polyclonal) |
If cells showed greater PD-1+ staining relative to the isotype control |
NA |
9% of MF had PD-1+ tumor cells 100% of PCSM-TCL had PD-1+ tumor cells |
NA |
Cetinözman F. & al.,[90] Arch Dermatol 2012 (n=27 SS: n=22 MF tumor stage) |
PD-1 IHC FFPE (R&D / polyclonal) |
PD-1+ if >50% cells showed positive staining |
NA |
89% of SS had PD-1+ tumor cells 14% of MF had PD-1+ tumor cells |
NA |
|
Miyoshi H. & al.,[92] Blood 2016 (n=135 ATLL) |
PD-1 IHC FFPE (Abcam / NAT-105) |
NA |
Average number of PD-1+ TILs / HPF |
19% of ATLL had PD-1+ tumor cells |
NA (done for PD-L1) |
|
NHL subtype, number of cases, antibodies used, scoring method and conclusions (PD-1/PD-L1 expression and its link with prognosis, when available) are specified for each study. FFPE: formalin-fixed and paraffin-embedded; CTCL: cutaneous T cell lymphoma; PC: proliferative center; HPF: high power field; NA: not available.
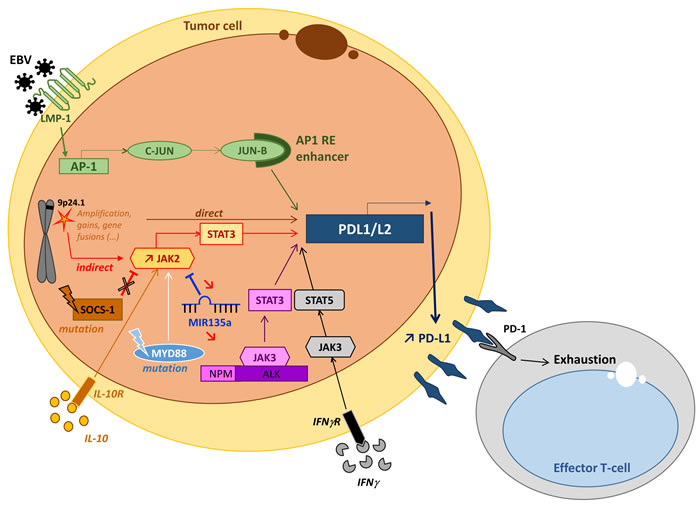
Figure 1: General mechanisms that lead to PD-L1 overexpression in lymphoma. Genetic alterations to the PD-L1 and PD-L2 locus of chromosome 9p24.1 (gains, amplifications or fusions) directly induce the activation of the PD-L1 promoter and thus PD-L1 overexpression [35, 43]. PD-L1 expression can also be induced by activation of the JAK/STAT pathway via inflammatory cytokines such as IL10 [13, 39]. This is through activation of JAK2 via either its molecular alteration, the inhibition of SOCS-1 [36] or by microRNA miR-135a [37]. EBV infection directly activates the PD-L1 promoter via the AP-1/cJUN/JUN-B pathway and indirectly activates it via the activation of JAK3-STAT5 by inflammatory cytokines (IFN) [13, 43]. Other indirect processes that may result in molecular anomalies that induce the activation of the JAK/STAT pathway typically include the nucleophosmin-anaplastic lymphoma kinase (NPM-ALK) translocation in NPM-ALK-positive anaplastic large cell lymphoma (ALCL) [40, 41] or the MYD88 L265P mutation in diffuse large B cell lymphoma [42] .
The PD-1/PD-L1/2 axis in DLBCL
Diffuse large B cell lymphoma (DLBCL) are the most common type of lymphoma in adults. The prognosis for DLBCL patients is heterogeneous and remains poor in 40% of cases despite the introduction of therapy combining rituximab with cyclophosphamide-doxorubicin-oncovin-prednisone (CHOP) [44-46]. The analysis of gene expression profiles in DLBCL has allowed the identification of three different DLBCL entities: germinal center B cell-like (GCB), activated B cell-like (ABC), and primary mediastinal B cell-type (PMBL) [47]. These subtypes arise from different stages of B-cell differentiation and acquire distinct oncogenic abnormalities which promote tumor proliferation and survival [47, 48]. The GCB subtype more frequently presents with genetic lesions such as BCL2 translocations, PTEN or ING1 deletions, MDM2 gains or amplifications and p53 mutations. In contrast, DLBCL ABC exhibit chronic BCR activation (e.g. through CD79A/B mutations) and present with other genetic alterations such as BCL2 amplifications or INK4-ARF deletions. The chronic BCR signaling pathway is a well-known target for therapeutic interventions (e.g ibrutinib, PKC inhibitors, lenalidomide) but activating mutations (e.g of CARD11, Bcl10 translocations, A20 deletions) occasionally hamper drug efficacy [48]. However, the physiopathology of DLBCL is not limited to tumor cells since the DLBCL microenvironment (ME) has also proven to be mandatory for its carcinogenesis. Within the ME, the tumor stromal cells and the composition of the immune infiltrate influence the progression of the DLBCL disease [49-52]. In addition, the strength of the immune response can be functionally impaired by several tumor immune escape mechanisms, most notably those upregulating immune checkpoint molecules such as PD-1/PD-L1 [53].
PD-1/PD-L1/2 expression in DLBCL
PD-L1 is expressed by both DLBCL tumor B cells and by non-malignant cells from their immune microenvironment, such as macrophages [10, 54]. In DLBCL, PD-L1 expression has been reported in around 20-30% of DLBCL cases but this figure varies greatly depending on the cut-off applied (which ranges from 5 to 30%) and the cell compartment analyzed (tumor/non-tumor cells) [10, 12, 13, 54] (Figures 2A and 2B) (Table 1). All of the studies that have investigated PD-L1 levels in DLBCL have reported higher expression rates in the non-GCB DLBCL subtypes [10, 12, 13, 54]. In contrast, the expression of PD-L2 has been less well documented, as most NHL cell lines do not express it [12]. One report found low PD-L2 expression in DLBCL cells without a significant difference between subtypes [10]. Recently, a retrospective study conducted a double staining of PD-L1 and PAX5 in DLBCL samples in order to precisely quantify the rate of PD-L1+ cells in both the tumor and non-tumor compartments [54]. They found that 10.5% of DLBCL samples expressed PD-L1 in tumor cells (n=132/1253 DLBCL samples; using a cut-off of 30%), while it was expressed in 15.3% of ME cells, which were essentially composed of macrophages (n=172/1121 DLBCL samples; using a cut-off of 20%). This study also confirmed the predominant expression of PD-L1 in non-GCB subtypes of DLBCL NOS.
In contrast to PD-L1, PD-1 expression has almost exclusively been detected in the ME cells of DLBCL, with a varying number of cells per mm² examined [10, 55, 56]. DLBCL tumor cells have been found to express a low level of cell surface PD-1 [10, 55-57], and sometimes co-express both PD-1 and PD-L1 [10, 58]. Kiyasu et al. [54] also reported that the number of PD-1+ TILs was higher in GCB DLBCL and was inversely correlated with the number of PD-L1+ tumor and ME cells, although these conclusions remain controversial [59, 60].
PD-L1 expression is also considered to be a hallmark of EBV-associated lymphoproliferative disorders. These include EBV+ plasmablastic lymphoma (PL) (where 20% of tumor cells are PD-L1+) [58], EBV+ post-transplant lymphoproliferative disorders (PTLD) (where 60% of tumor cells are PD-L1+) [13], EBV+ DLBCL of the elderly (where 100% of tumor cells are PD-L1+) [13] and the recently described EBV+ DLBCL subtype [31] found in young patients (where 76% of patients display an expression of PD-L1 by more than 5% of their tumor B cells) [61]. This frequent up-regulation of PD-L1 by EBV+ lymphoma cells, and the inhibition of EBV-induced lymphomagenesis following PD-1/PD-L1 blockade in a mouse model [62], suggest a link between EBV infection and PD-1/PD-L1 upregulation. Furthermore, PD-1 and PD-L1 have also been shown to be expressed by infiltrating immune cells of EBV+ lymphoma patients, suggesting that their expression underlies the tolerogenic immune response induced by EBV [58, 61]. However, PD-L1 expression does not always correlate with EBV infection since it has also been reported in EBV- PTLD [13] and EBV- PL [13, 58].
Mechanisms of PD-L1 and PD-L2 overexpression in DLBCL tumor cells
Nearly 20% of DLBCL NOS are reported to carry genetic anomalies and chromosomal alterations that lead to PD-L1/2 overexpression [35]. Specifically, the structural anomalies on chromosome 9p24.1 have been significantly correlated with PD-L1 expression in DLBCL [54, 63]. Other translocations involving IGH genes that lead to PD-L1 overexpression have also been reported [35]. Recently, Georgiou et al. [35] reported 12% of gains, 3% of amplifications and 4% of translocations of the PD-L1/PD-L2 locus in the non GCB subtype, and lower rates in the GCB subtype. Around 30% of non-GCB DLBCL are also reported to carry MYD88 mutations that cause the chronic activation of the JAK/STAT pathway and in turn stimulate the expression of PD-L1 [35, 39, 42, 43]. Likewise, EBV infection could account for the over-expression of PD-L1 in EBV+ DLBCL since antiviral and inflammatory cytokine responses also activate the JAK/STAT pathway. In addition, the EBV-encoded latent membrane protein (LMP)-1 activates AP-1 (via cJUN/JUN-B components) and the JAK/STAT signaling pathways which, respectively, activate the PD-L1 enhancer and promoter [38].
Beside DLBCL NOS, primary central nervous system large B cell lymphoma (PCNSL) and primitive testicular lymphoma (PTL) are extranodal DLBCLs that arise at sites considered to be immune sanctuaries [64, 65]. PCNSL and PTL frequently harbor genetic anomalies on chromosome 9p24.1, with 9p24.1 copy gains found in 54% of PTL and 52% of PCNSL [66]. Moreover, translocations involving the PD-L1/L2 locus were also reported in 4% of PTL and 6% of PCNSL [63, 66]. However, further studies of PD-L1 immunostaining with larger cohorts of these rare DLBCL subtypes are needed to confirm this PD-L1 overexpression, as only 10% of PCNSL cases (n=2/20) were found to harbor PD-L1+ tumor cells [67].
The expression of PD-L1 by tumor cells in primary mediastinal B cell lymphoma (PMBL) has also been investigated by a number of studies and is reported in 36% to 100% of cases [12, 13, 56, 68]. In PMBL, PD-L1 up-regulation is usually caused by genetic alterations, with 29-55% of chromosome 9p24.1 gains [63, 66] and 20% of rearrangements at the PD-L1/2 locus, involving either the CIITA or the IGH loci [63, 69].
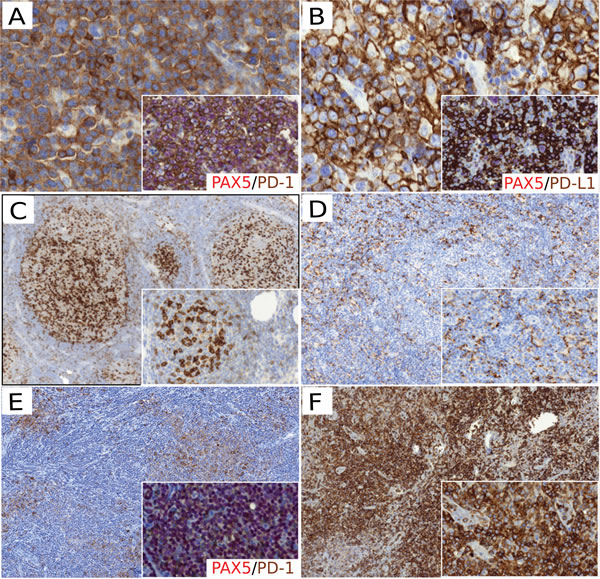
Figure 2: PD-1/PD-L1 protein expression in non Hodgkin lymphoma. A. PD-1 staining positive in DLBCL tumor cells (x400); the magnified insert showed PD-1+ (brown) / PAX5+ (red) tumor cells (x400). B. PD-L1 staining positive in DLBCL tumor cells (x400); the magnified insert showed PD-L1+ (brown) / PAX5+ (red) tumor cells (x400). C. PD-1 staining showing PD-1+ TFH cells with an intrafollicular pattern in FL samples (x100; magnified insert x200). D. PD-L1 staining showing PD-L1+ macrophages in the FL ME (x100). E. PD-1 staining showing PD-1+ cells in CLL proliferative centers (x100); the magnified insert showed PD-1+ (brown) / PAX5+ (red) neoplastic B cells in proliferative center (x200). F. PD-1 staining in AITL samples showing PD-1+ tumor cells (x200). D. PD-L1 staining showing PD-L1 + macrophages in the FL ME (x100; magnified insert x100). F. PD-1 staining in AITL samples showing PD-1 + tumor cells (x200; magnified insert x400).
The prognostic impact of PD-1/PD-L1 expression in DLBCL
As depicted in Figure 3, PD-1 and PD-L1 expression in DLBCL samples have a prognostic value in DLBCL [54, 59, 70]. Using a large series of 1200 DLBCL samples, Kiyasu et al. [54] demonstrated that patients with PD-L1+ DLBCL had inferior overall survival rates than PD-L1- DLBCL patients. Moreover, patients with PD-L1+ tumor cells but low PD-1+ TIL counts had poorer prognoses than patients with PD-L1- DLBCL and high PD-1+ TIL counts [54]. Elevated soluble plasma PD-L1 (sPD-L1) levels in DLBCL patients has also been shown to correlate with the lowest three-year overall survival rates (3-year OS of 76% versus 89%, P<0.001) [71, 72]. Moreover, reports of tumor cell PD-L1 expression have been almost completely assigned to the non-GC subtype of DLBCL which have the worst prognosis among the DLBCL subtypes [10, 12, 54]. Other studies have correlated better DLBCL patient survival with their TILs having a higher PD-1 expression [55, 59, 70]. Conversely, however, DLBCL patients with a high PD-1 expression on their circulating CD4+ T cells showed an aggressive clinical course [73].
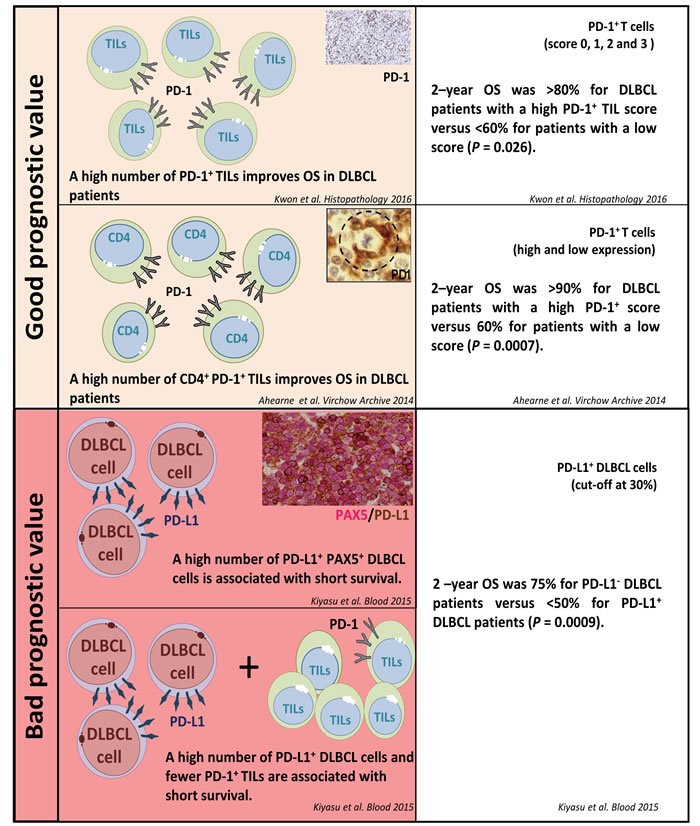
Figure 3: PD-1/PD-L1 expression and their prognostic value in diffuse large B cell lymphoma.
The PD-1/PD-L1 axis in FL
Expression of the PD-1/PD-L1/2 axis in FL
In contrast to DLBCL, most follicular lymphoma (FL) tumor cells do not express PD-L1 or PD-L2 [10, 12, 68, 74], however PD-1+ cells are abundant in the ME of FL [10]. In FL, these PD-1+ cells include not only TILs but also follicular helper T cells (TFH) from lymphomatous follicles or residual germinal centers [75, 76] (Figure 2C). FL ME macrophage cells have an increased expression of PD-L1 (Figure 2D), but these levels remain lower than those in the ME of DLBCL [10].
The prognostic impact of PD-1/PD-L1 expression in FL
Conflicting data have been reported regarding the prognostic impact of PD-1/PD-L1 expression in FL. As depicted in Figure 4, some studies have reported a correlation between low PD-1+ cell counts and either a high histological grade of FL or a higher risk of transformation to DLBCL [77]. Carreras et al. showed an association between high PD-1+ cell counts and better overall survival (OS) and progression-free survival (PFS), although these results remain controversial [78]. These divergent results could possibly be accounted for by the various subtypes of PD-1+ lymphocytes tested (TFH, exhausted T cells, or Tregs). The prognostic value of PD-1 staining in immune cells may also rely on the pattern of infiltration in FL samples, since high rates of intra-follicular PD-1+ cells have been correlated with a good prognosis while PD-1+ inter-follicular and diffuse infiltrates have poorer outcomes [75, 79-81]. In addition, flow cytometry measures of PD-1 expression levels evidenced two different CD4+ PD-1bright and CD4+ PD-1dim T cell subtypes that were associated with different outcomes [82]. In contrast to PD-1, the prognostic relevance of PD-L1 staining in FL remains poorly studied so far. Only one study reported a significant correlation between PD-L1 expression by tumor cells and lower survival rates of FL patients [83].
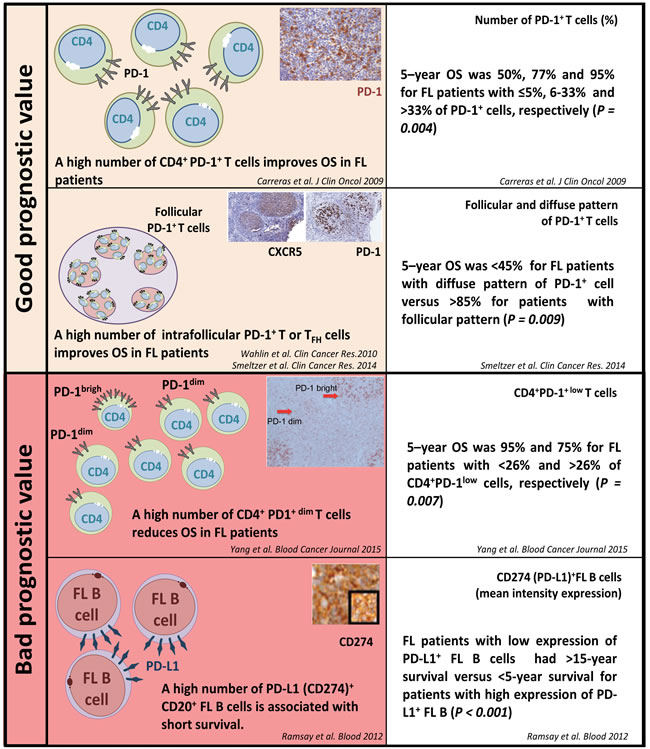
Figure 4: PD-1/PD-L1 expression and their prognostic value in follicular lymphoma.
The PD-1/PD-L1/2 axis in other small B cell lymphoma
The PD-1/PD-L1 axis also remains poorly documented in other small B cell lymphoma. From the few available studies it appears that LPL, MCL and MZL tumor cells are usually negative for PD-L1 IHC staining [12, 56, 68]. In CLL, PD-1 is expressed by both reactive T cells and some paraimmunoblasts and prolymphocytes in the proliferative centers [56, 84] (Figure 2E). Few studies have reported PD-L1+ cells among the circulating blood cells of CLL patients [83, 84], and the expression of PD-L1/L2 by CLL tumor cells showed conflicting results [12, 56, 68, 84].
The PD-1/PD-L1/2 axis in T cell lymphoma
The PD-1/PD-L1 axis is involved in both the development and the immune escape of some PTCL malignancies. From a diagnostic point of view, PD-1 expression is usually observed at the surface of angioimmunoblastic T cell lymphoma (AITL) tumor cells derived from normal TFH. This also applies to other lymphoma with a TFH phenotype according to the new WHO 2016 classification [31] including follicular T cell lymphoma (FTL) and other PTCL with a TFH phenotype (PTCL-TFH) (Figure 2F). PD-1/PD-L1 expression has also been observed on the surface of tumor ME immune cells in these PTCL subtypes, however PD-L1 expression has rarely been observed in tumor cells from these TFH subtypes, with no PD-L1+ tumors from 4 cases reported in one study [56] and 1/21 elsewhere [85]. PD-L1 expression appears to vary widely amongst tumor cells, with low rates ranging from 0% [56] to 17% of cases [85], however one study has suggested that it is higher in refractory PTCL NOS, with 28% of rPTCL NOS cases being PD-L1+ [86].
In contrast, Marzec et al. [41] reported a consistent overexpression of PD-L1 in anaplastic lymphoma kinase-positive anaplastic large cell lymphoma (ALK+ ALCL) cell lines. This report was confirmed in biopsies from ALK+ ALCL tumors, with frequencies of PD-L1+ cases varying from 34 to 100% of the analyzed cases [12, 85, 87]. Marzec et al. [41] showed that activation of the transcription factor STAT3 by the nucleophosmin-ALK (NPM-ALK) fusion protein could be responsible for the increased expression of PD-L1 at the cell surface of ALK+ tumor cells. Moreover, the same group showed that NPM-ALK induces the activation of the IL-10 and TGF-β cytokines. Since IL-10 can also activate JAK/STAT signaling via STAT3, and thus induce the up-regulation of PD-L1 [39], one may reasonably speculate that NPM-ALK directly up-regulates PD-L1 via STAT3 or IL-10.
The expression of PD-1 and/or PD-L1 has also been reported in some cutaneous lymphoproliferative disorders. For instance, some mycosis fungoïdes (MF) and Sezary syndrome (SS) tumor cells have been found to express PD-1 at their surface. Similarly, some rare cutaneous disorders characterized by small- and average-sized CD4+ T cells have been found to be PD-1+ [88-90]. In addition, PD-L1 expression has been reported on SS/MF tumor cells and on SS/MF tumor-infiltrating dendritic cells in 27% and 73% of cases, respectively [85]. Likewise, cases of HTLV1-associated leukemia and lymphoma of adults (ATLL) have been shown to overexpress PD-L1 at the surface of their tumor or ME stromal cells [54, 91, 92], and the presence of PD-L1+ tumor cells, together with the lack of PD-L1+ ME cells, has been correlated with a poor prognosis in ATLL patients [92].
Finally, studies on extranodal NK/T cell lymphoma-nasal type have reported PD-L1+ tumor cells in 67% of cases. This was presumably secondary to EBV infection via LMP1-mediated upregulation of PD-L1 or via interferon (IFN) signaling [13, 43].
Clinical significance of studying PD-1/PD-L1/2 expression in NHL patients
Preliminary data from clinical trials in solid tumors and HL indicate that patients with PD-L1+ tumor cells were those who benefitted most from PD-1/PD-L1 immune checkpoint blockade treatments [15, 93-94]. Nevertheless, significant responses were also observed in some of the PD-L1- patients [95]. This observation reflects the limits of using PD-L1 protein expression alone as a single predictive biomarker since its expression is heterogeneous among tumor cells and can increase spontaneously or upon treatment. The cell-to-cell heterogeneity of PD-1, PD-L1 and PD-L2 expression among cells from NHL biopsies can now be assessed by single cell RNA-sequencing technologies, but these are not widely available in diagnostic laboratories so the current clinical need is for an IHC-based test to detect cell surface protein markers. This has its own problems, however, since there is a lack of standardized IHC procedures [96] with different antibody clones and detection thresholds [97]. In fact, the levels of PD-1 and PD-L1 protein expression and their impact on clinical response in NHL patients do differ according to lymphoma subtype and the staining assessment methodology (Table 1). In solid tumors recent evidence has suggested that both mutational load, preexisting CD8+ T cell infiltration and PD-L1 expression (with a 1% cut-off) represent predictive factors for immunotherapeutic response [94, 98]. So far, none of these biomarkers have been validated in NHL, although we and others have reported significant levels of PD-L1 expression in these malignancies. However, preclinical trials with immune checkpoint blockade (ICB) therapies have shown a promising efficacy, especially in relapsed/refractory (r/r) NHL with an acceptable safety profile of toxicity [99]. For example, 36% of r/r DLBCL patients and 40% of r/r FL displayed a complete response (CR) or partial response (PR) with nivolumab [100]. Pembrolizumab had an overall response rate (ORR) of 37.5% in PMBL patients and 21% in CLL patients [101]. In contrast though, TCL patients treated with nivolumab responded at a lower rate, and an overall response was achieved in only 17% of patients [99, 100]. In addition, EBV+ lymphoma such as EBV+ DLBCL or NKTCL [13, 54, 58, 102] and EBV+ or EBV- PTLD frequently show PD-L1-expressing tumor and ME cells. Thus, in these subtypes, PD-L1 may be used as a biomarker to identify patients who may benefit from anti-PD-1/PD-L1 inhibitors. Thus, the clinical impact of PD-L1 status in EBV+ lymphoma and PTLD has not yet been firmly established. Nevertheless, a significant association between PD-L1 expression and poor outcomes has been detected in early-diagnosed NKTCL patients treated with chemotherapy containing asparaginase [54, 102]. ALK+ ALCL patients may also be eligible for treatment by PD-1/PD-L1 inhibitors since their NPM-ALK rearrangement up-regulates PD-L1 expression. Nevertheless, correlating this expression with clinical outcome needs to be formally validated in ALK+ ALCL patients. Ongoing preclinical trials and translational research into the PD-1/PD-L1 axis in lymphoma will assess the effectiveness of PD-1/PD-L1 inhibitors in PD-1/PD-L1-positive r/r B cell and T cell lymphoma. Thus, the validation of standardized procedures for assessing PD-1/PD-L1 expression is paramount for establishing a reliable predictive marker of response, which is currently missing from our therapeutic armament for NHL patients.
Encouraged by the promising results in melanoma [103] and multiple myeloma patients [104], we anticipate that r/r NHL patients will also benefit from ICB therapies combined with other immunotherapeutic agents (such as anti-CD20 or anti-CD30), or from a combination of multiple ICB therapies (such as those targeting PD-1, CD137 and LAG3). Indeed, although the combination of anti-PD-1 with anti-CTLA-4 did not show a greater clinical response than anti-PD-1 alone for the treatment of hematological malignancies [105], many other combinations of ICB therapy are currently under investigation in NHL patients [99].
In conclusion, tumors from most NHLs carry PD-1+ and PD-L1/L2+ cells. This encompasses both PD-1-expressing TILs as well as PD-L1/2-expressing macrophages and tumor cells in some NHL subtypes. Although PD-1 expression by TILs is the mere hallmark of their physiological activation, PD-L1/2 expression by malignant cells results from several tumor-intrinsic (genetic or oncogenic) and -extrinsic immune escape mechanisms selected by pressure from antitumor immunity. Hence PD-L1 overexpression is associated with the poorest prognosis in several types of aggressive NHLs. Thus, monoclonal antibodies selectively blocking the PD-1/PD-L1 axis could preserve TILs from exhaustion and promote antitumor immunity as an effective therapeutic strategy for NHL.
Abbreviations
Treg: regulatory T cell; TAM: tumor-associated macrophage; MDSC: myeloid-derived suppressor cell; PD-1: programmed death 1 receptor; PD-L1/2: programmed death ligands 1 and 2; TIL: tumor-infiltrated lymphocyte; FL: follicular lymphoma; NHL: non Hodgkin lymphoma; HL: Hodgkin lymphoma; NK: natural killer cells; PTCL: peripheral T cell lymphoma; TFH: follicular helper T cells; LPL: lymphoplasmacytic lymphoma; MCL: mantle cell lymphoma; MZL: marginal zone lymphoma; CLL: chronic lymphocytic leukemia; DLBCL: diffuse large B cell lymphoma; ME: microenvironment; NOS: not otherwise specified; EBV: Epstein-Barr virus; IGH: immunoglobulin heavy chain; PL: plasmablastic lymphoma; PTLD: post-transplant lymphoproliferative disorder; LMP: latent membrane protein; PCNSL: primary central nervous system large B cell lymphoma; PTL: primitive testicular lymphoma; PMBL: primary mediastinal large B cell lymphoma; OS: overall survival; PFS: progression-free survival; AITL: angioimmunoblastic T cell lymphoma; FTL: follicular T cell lymphoma; ALK: anaplastic lymphoma kinase; ALCL: anaplastic large cell lymphoma; NPM: nucleophosmin; MF: mycosis fungoïdes; SS: Sezary syndrome; ATLL: HTLV1-associated leukemia and lymphoma of adults; IFN: interferon; ICB: immune checkpoint blockade; CR: complete response; PR: partial response; IHC: immunohistochemistry.
Acknowledgments
We thank Laurence Jalabert, Audray Benest, Julien Granel and Charley Lagarde for IHC experiments (IUCT). We thank the Imag’IN Platform (IUCT). The work by C.L. and J.J.F is funded by the Centre Hospitalo-Universitaire de Toulouse, the Institut Universitaire du Cancer de Toulouse, the Institut National de la Santé et de la Recherche Medicale, the Université Toulouse III: Paul Sabatier, the Centre National de la Recherche Scientifique, the Laboratoire d’Excellence TOUCAN (contract ANR11-LABX), the Programme Hospitalo-Universitaire en Cancérologie CAPTOR (contract ANR11-PHUC0001) and the Institut Carnot CALYM. Pauline Gravelle is supported by CeVi_Collection project, from the CALYM Carnot Institute, funded by the French National Research Council (ANR).
Conflicts of interest
None of the authors have any conflicts of interest to disclose.
References
1. Challa-Malladi M, Lieu YK, Califano O, Holmes AB, Bhagat G, Murty VV, Dominguez-Sola D, Pasqualucci L, Dalla-Favera R. Combined genetic inactivation of β2-Microglobulin and CD58 reveals frequent escape from immune recognition in diffuse large B cell lymphoma. Cancer Cell. 2011; 20:728–40.
2. Green MR, Kihira S, Liu CL, Nair RV, Salari R, Gentles AJ, Irish J, Stehr H, Vicente-Dueñas C, Romero-Camarero I, Sanchez-Garcia I, Plevritis SK, Arber DA, et al. Mutations in early follicular lymphoma progenitors are associated with suppressed antigen presentation. Proc Natl Acad Sci USA. 2015; 112:E1116–25.
3. Béguelin W, Sawh S, Chambwe N, Chan FC, Jiang Y, Choo JW, Scott DW, Chalmers A, Geng H, Tsikitas L, Tam W, Bhagat G, Gascoyne RD, Shaknovich R. IL10 receptor is a novel therapeutic target in DLBCLs. Leukemia. 2015; 29:1684–94.
4. Saifi M, Maran A, Raynaud P, Picot MC, Quittet P, Cartron G, Rossi JF, Costes V. High ratio of interfollicular CD8/FOXP3-positive regulatory T cells is associated with a high FLIPI index and poor overall survival in follicular lymphoma. Exp Ther Med. 2010; 1:933–38.
5. Amé-Thomas P, Tarte K. The yin and the yang of follicular lymphoma cell niches: role of microenvironment heterogeneity and plasticity. Semin Cancer Biol. 2014; 24:23–32.
6. Serafini P, Mgebroff S, Noonan K, Borrello I. Myeloid-derived suppressor cells promote cross-tolerance in B-cell lymphoma by expanding regulatory T cells. Cancer Res. 2008; 68:5439–49.
7. Azzaoui I, Uhel F, Rossille D, Pangault C, Dulong J, Le Priol J, Lamy T, Houot R, Le Gouill S, Cartron G, Godmer P, Bouabdallah K, Milpied N, et al. T-cell defect in diffuse large B-cell lymphomas involves expansion of myeloid-derived suppressor cells. Blood. 2016; 128:1081–92.
8. Xerri L, Devilard E, Hassoun J, Olive D, Birg F. In vivo expression of the CTLA4 inhibitory receptor in malignant and reactive cells from human lymphomas. J Pathol. 1997; 183:182–87.
9. Armand P. Checkpoint blockade in lymphoma. Hematology Am Soc Hematol Educ Program. 2015; 2015:69-73.
10. Laurent C, Charmpi K, Gravelle P, Tosolini M, Franchet C, Ysebaert L, Brousset P, Bidaut A, Ycart B, Fournié JJ. Several immune escape patterns in non-Hodgkin’s lymphomas. OncoImmunology. 2015; 4:e1026530.
11. Gravelle P, Do C, Franchet C, Mueller S, Oberic L, Ysebaert L, Larocca LM, Hohaus S, Calmels MN, Frenois FX, Kridel R, Gascoyne RD, Laurent G, et al. Impaired functional responses in follicular lymphoma CD8(+)TIM-3(+) T lymphocytes following TCR engagement. OncoImmunology. 2016; 5:e1224044.
12. Andorsky DJ, Yamada RE, Said J, Pinkus GS, Betting DJ, Timmerman JM. Programmed death ligand 1 is expressed by non-hodgkin lymphomas and inhibits the activity of tumor-associated T cells. Clin Cancer Res. 2011; 17:4232–44.
13. Chen BJ, Chapuy B, Ouyang J, Sun HH, Roemer MG, Xu ML, Yu H, Fletcher CD, Freeman GJ, Shipp MA, Rodig SJ. PD-L1 expression is characteristic of a subset of aggressive B-cell lymphomas and virus-associated malignancies. Clin Cancer Res. 2013; 19:3462–73.
14. Armand P. Immune checkpoint blockade in hematologic malignancies. Blood. 2015; 125:3393–400.
15. Ansell SM, Lesokhin AM, Borrello I, Halwani A, Scott EC, Gutierrez M, Schuster SJ, Millenson MM, Cattry D, Freeman GJ, Rodig SJ, Chapuy B, Ligon AH, et al. PD-1 blockade with nivolumab in relapsed or refractory Hodgkin’s lymphoma. N Engl J Med. 2015; 372:311–19.
16. Armand P, Shipp MA, Ribrag V, Michot JM, Zinzani PL, Kuruvilla J, Snyder ES, Ricart AD, Balakumaran A, Rose S, Moskowitz CH. Programmed Death-1 Blockade With Pembrolizumab in Patients With Classical Hodgkin Lymphoma After Brentuximab Vedotin Failure. J Clin Oncol. 2016; 34:3733–39.
17. Westin JR, Chu F, Zhang M, Fayad LE, Kwak LW, Fowler N, Romaguera J, Hagemeister F, Fanale M, Samaniego F, Feng L, Baladandayuthapani V, Wang Z, et al. Safety and activity of PD1 blockade by pidilizumab in combination with rituximab in patients with relapsed follicular lymphoma: a single group, open-label, phase 2 trial. Lancet Oncol. 2014; 15:69–77.
18. Ansell SM. Targeting immune checkpoints in lymphoma. Curr Opin Hematol. 2015; 22:337–42.
19. Berger R, Rotem-Yehudar R, Slama G, Landes S, Kneller A, Leiba M, Koren-Michowitz M, Shimoni A, Nagler A. Phase I safety and pharmacokinetic study of CT-011, a humanized antibody interacting with PD-1, in patients with advanced hematologic malignancies. Clin Cancer Res. 2008; 14:3044–51.
20. Keir ME, Butte MJ, Freeman GJ, Sharpe AH. PD-1 and its ligands in tolerance and immunity. Annu Rev Immunol. 2008; 26:677–704.
21. Ishida Y, Agata Y, Shibahara K, Honjo T. Induced expression of PD-1, a novel member of the immunoglobulin gene superfamily, upon programmed cell death. EMBO J. 1992; 11:3887–95.
22. Fife BT, Pauken KE, Eagar TN, Obu T, Wu J, Tang Q, Azuma M, Krummel MF, Bluestone JA. Interactions between PD-1 and PD-L1 promote tolerance by blocking the TCR-induced stop signal. Nat Immunol. 2009; 10:1185–92.
23. Yokosuka T, Takamatsu M, Kobayashi-Imanishi W, Hashimoto-Tane A, Azuma M, Saito T. Programmed cell death 1 forms negative costimulatory microclusters that directly inhibit T cell receptor signaling by recruiting phosphatase SHP2. J Exp Med. 2012; 209:1201–17.
24. Liu X, Gibbons RM, Harrington SM, Krco CJ, Markovic SN, Kwon ED, Dong H. Endogenous tumor-reactive CD8(+) T cells are differentiated effector cells expressing high levels of CD11a and PD-1 but are unable to control tumor growth. OncoImmunology. 2013; 2:e23972.
25. Turnis ME, Andrews LP, Vignali DA. Inhibitory receptors as targets for cancer immunotherapy. Eur J Immunol. 2015; 45:1892–905.
26. Wherry EJ, Ha SJ, Kaech SM, Haining WN, Sarkar S, Kalia V, Subramaniam S, Blattman JN, Barber DL, Ahmed R. Molecular signature of CD8+ T cell exhaustion during chronic viral infection. Immunity. 2007; 27:670–84.
27. Crawford A, Wherry EJ. The diversity of costimulatory and inhibitory receptor pathways and the regulation of antiviral T cell responses. Curr Opin Immunol. 2009; 21:179–86.
28. Dong H, Strome SE, Salomao DR, Tamura H, Hirano F, Flies DB, Roche PC, Lu J, Zhu G, Tamada K, Lennon VA, Celis E, Chen L. Tumor-associated B7-H1 promotes T-cell apoptosis: a potential mechanism of immune evasion. Nat Med. 2002; 8:793–800.
29. Ahmadzadeh M, Johnson LA, Heemskerk B, Wunderlich JR, Dudley ME, White DE, Rosenberg SA. Tumor antigen-specific CD8 T cells infiltrating the tumor express high levels of PD-1 and are functionally impaired. Blood. 2009; 114:1537–44.
30. Sfanos KS, Bruno TC, Meeker AK, De Marzo AM, Isaacs WB, Drake CG. Human prostate-infiltrating CD8+ T lymphocytes are oligoclonal and PD-1+. Prostate. 2009; 69:1694–703.
31. Swerdlow SH, Campo E, Pileri SA, Harris NL, Stein H, Siebert R, Advani R, Ghielmini M, Salles GA, Zelenetz AD, Jaffe ES. The 2016 revision of the World Health Organization classification of lymphoid neoplasms. Blood. 2016; 127:2375–90.
32. Li Y, Wang J, Li C, Ke XY. Contribution of PD-L1 to oncogenesis of lymphoma and its RNAi-based targeting therapy. Leuk Lymphoma. 2012; 53:2015–23.
33. Topalian SL, Drake CG, Pardoll DM. Immune checkpoint blockade: a common denominator approach to cancer therapy. Cancer Cell. 2015; 27:450–61.
34. Cheah CY, Fowler NH, Neelapu SS. Targeting the programmed death-1/programmed death-ligand 1 axis in lymphoma. Curr Opin Oncol. 2015; 27:384–91.
35. Georgiou K, Chen L, Berglund M, Ren W, de Miranda NF, Lisboa S, Fangazio M, Zhu S, Hou Y, Wu K, Fang W, Wang X, Meng B, et al. Genetic basis of PD-L1 overexpression in diffuse large B-cell lymphomas. Blood. 2016; 127:3026–34.
36. Weniger MA, Melzner I, Menz CK, Wegener S, Bucur AJ, Dorsch K, Mattfeldt T, Barth TF, Möller P. Mutations of the tumor suppressor gene SOCS-1 in classical Hodgkin lymphoma are frequent and associated with nuclear phospho-STAT5 accumulation. Oncogene. 2006; 25:2679–84.
37. Navarro A, Diaz T, Martinez A, Gaya A, Pons A, Gel B, Codony C, Ferrer G, Martinez C, Montserrat E, Monzo M. Regulation of JAK2 by miR-135a: prognostic impact in classic Hodgkin lymphoma. Blood. 2009; 114:2945–51.
38. Green MR, Rodig S, Juszczynski P, Ouyang J, Sinha P, O’Donnell E, Neuberg D, Shipp MA. Constitutive AP-1 activity and EBV infection induce PD-L1 in Hodgkin lymphomas and posttransplant lymphoproliferative disorders: implications for targeted therapy. Clin Cancer Res. 2012; 18:1611–18.
39. Gupta M, Han JJ, Stenson M, Maurer M, Wellik L, Hu G, Ziesmer S, Dogan A, Witzig TE. Elevated serum IL-10 levels in diffuse large B-cell lymphoma: a mechanism of aberrant JAK2 activation. Blood. 2012; 119:2844–53.
40. Kasprzycka M, Marzec M, Liu X, Zhang Q, Wasik MA. Nucleophosmin/anaplastic lymphoma kinase (NPM/ALK) oncoprotein induces the T regulatory cell phenotype by activating STAT3. Proc Natl Acad Sci USA. 2006; 103:9964–69.
41. Marzec M, Zhang Q, Goradia A, Raghunath PN, Liu X, Paessler M, Wang HY, Wysocka M, Cheng M, Ruggeri BA, Wasik MA. Oncogenic kinase NPM/ALK induces through STAT3 expression of immunosuppressive protein CD274 (PD-L1, B7-H1). Proc Natl Acad Sci USA. 2008; 105:20852–57.
42. Choi JW, Kim Y, Lee JH, Kim YS. MYD88 expression and L265P mutation in diffuse large B-cell lymphoma. Hum Pathol. 2013; 44:1375–81.
43. Green MR, Monti S, Rodig SJ, Juszczynski P, Currie T, O’Donnell E, Chapuy B, Takeyama K, Neuberg D, Golub TR, Kutok JL, Shipp MA. Integrative analysis reveals selective 9p24.1 amplification, increased PD-1 ligand expression, and further induction via JAK2 in nodular sclerosing Hodgkin lymphoma and primary mediastinal large B-cell lymphoma. Blood. 2010; 116:3268–77.
44. Coiffier B, Lepage E, Briere J, Herbrecht R, Tilly H, Bouabdallah R, Morel P, Van Den Neste E, Salles G, Gaulard P, Reyes F, Lederlin P, Gisselbrecht C. CHOP chemotherapy plus rituximab compared with CHOP alone in elderly patients with diffuse large-B-cell lymphoma. N Engl J Med. 2002; 346:235–42.
45. Habermann TM, Weller EA, Morrison VA, Gascoyne RD, Cassileth PA, Cohn JB, Dakhil SR, Woda B, Fisher RI, Peterson BA, Horning SJ. Rituximab-CHOP versus CHOP alone or with maintenance rituximab in older patients with diffuse large B-cell lymphoma. J Clin Oncol. 2006; 24:3121–27.
46. Roschewski M, Staudt LM, Wilson WH. Diffuse large B-cell lymphoma-treatment approaches in the molecular era. Nat Rev Clin Oncol. 2014; 11:12–23.
47. Alizadeh AA, Eisen MB, Davis RE, Ma C, Lossos IS, Rosenwald A, Boldrick JC, Sabet H, Tran T, Yu X, Powell JI, Yang L, Marti GE, et al. Distinct types of diffuse large B-cell lymphoma identified by gene expression profiling. Nature. 2000; 403:503–11.
48. Lenz G, Staudt LM. Aggressive lymphomas. N Engl J Med. 2010; 362:1417–29.
49. Ansell SM, Stenson M, Habermann TM, Jelinek DF, Witzig TE. Cd4+ T-cell immune response to large B-cell non-Hodgkin’s lymphoma predicts patient outcome. J Clin Oncol. 2001; 19:720–26.
50. Keane C, Gill D, Vari F, Cross D, Griffiths L, Gandhi M. CD4(+) tumor infiltrating lymphocytes are prognostic and independent of R-IPI in patients with DLBCL receiving R-CHOP chemo-immunotherapy. Am J Hematol. 2013; 88:273–76.
51. Keane C, Vari F, Hertzberg M, Cao KA, Green MR, Han E, Seymour JF, Hicks RJ, Gill D, Crooks P, Gould C, Jones K, Griffiths LR, et al. Ratios of T-cell immune effectors and checkpoint molecules as prognostic biomarkers in diffuse large B-cell lymphoma: a population-based study. Lancet Haematol. 2015; 2:e445–55.
52. Kridel R, Steidl C, Gascoyne RD. Tumor-associated macrophages in diffuse large B-cell lymphoma. Haematologica. 2015; 100:143–45.
53. Honda T, Egen JG, Lämmermann T, Kastenmüller W, Torabi-Parizi P, Germain RN. Tuning of antigen sensitivity by T cell receptor-dependent negative feedback controls T cell effector function in inflamed tissues. Immunity. 2014; 40:235–47.
54. Kiyasu J, Miyoshi H, Hirata A, Arakawa F, Ichikawa A, Niino D, Sugita Y, Yufu Y, Choi I, Abe Y, Uike N, Nagafuji K, Okamura T, et al. Expression of programmed cell death ligand 1 is associated with poor overall survival in patients with diffuse large B-cell lymphoma. Blood. 2015; 126:2193–201.
55. Muenst S, Hoeller S, Willi N, Dirnhofera S, Tzankov A. Diagnostic and prognostic utility of PD-1 in B cell lymphomas. Dis Markers. 2010; 29:47–53.
56. Xerri L, Chetaille B, Serriari N, Attias C, Guillaume Y, Arnoulet C, Olive D. Programmed death 1 is a marker of angioimmunoblastic T-cell lymphoma and B-cell small lymphocytic lymphoma/chronic lymphocytic leukemia. Hum Pathol. 2008; 39:1050–58.
57. Tonino SH, van de Berg PJ, Yong SL, ten Berge IJ, Kersten MJ, van Lier RA, van Oers MH, Kater AP. Expansion of effector T cells associated with decreased PD-1 expression in patients with indolent B cell lymphomas and chronic lymphocytic leukemia. Leuk Lymphoma. 2012; 53:1785–94.
58. Laurent C, Fabiani B, Do C, Tchernonog E, Cartron G, Gravelle P, Amara N, Malot S, Palisoc MM, Copie-Bergman C, Glehen AT, Copin MC, Brousset P, et al. Immune-checkpoint expression in Epstein-Barr virus positive and negative plasmablastic lymphoma: a clinical and pathological study in 82 patients. Haematologica. 2016; 101:976–84.
59. Kwon D, Kim S, Kim PJ, Go H, Nam SJ, Paik JH, Kim YA, Kim TM, Heo DS, Kim CW, Jeon YK. Clinicopathological analysis of programmed cell death 1 and programmed cell death ligand 1 expression in the tumour microenvironments of diffuse large B cell lymphomas. Histopathology. 2016; 68:1079–89.
60. Ko Y, Oh Y, Park C, Kim W, Han H, Lim S, Hwang TS, Kimet WS. Prognostic Implication of Programmed Death-1-Positive Tumor-infiltrating Lymphocytes in Diffuse Large B-Cell Lymphoma. Korean J Pathol. 2011; 45:573–81.
61. Nicolae A, Pittaluga S, Abdullah S, Steinberg SM, Pham TA, Davies-Hill T, Xi L, Raffeld M, Jaffe ES. EBV-positive large B-cell lymphomas in young patients: a nodal lymphoma with evidence for a tolerogenic immune environment. Blood. 2015; 126:863–72.
62. Ma SD, Xu X, Jones R, Delecluse HJ, Zumwalde NA, Sharma A, Gumperz JE, Kenney SC. PD-1/CTLA-4 Blockade Inhibits Epstein-Barr Virus-Induced Lymphoma Growth in a Cord Blood Humanized-Mouse Model. PLoS Pathog. 2016; 12:e1005642.
63. Twa DD, Chan FC, Ben-Neriah S, Woolcock BW, Mottok A, Tan KL, Slack GW, Gunawardana J, Lim RS, McPherson AW, Kridel R, Telenius A, Scott DW, et al. Genomic rearrangements involving programmed death ligands are recurrent in primary mediastinal large B-cell lymphoma. Blood. 2014; 123:2062–65.
64. Cheah CY, Wirth A, Seymour JF. Primary testicular lymphoma. Blood. 2014; 123:486–93.
65. Rubenstein JL, Gupta NK, Mannis GN, Lamarre AK, Treseler P. How I treat CNS lymphomas. Blood. 2013; 122:2318–30.
66. Chapuy B, Roemer MG, Stewart C, Tan Y, Abo RP, Zhang L, Dunford AJ, Meredith DM, Thorner AR, Jordanova ES, Liu G, Feuerhake F, Ducar MD, et al. Targetable genetic features of primary testicular and primary central nervous system lymphomas. Blood. 2016; 127:869–81.
67. Berghoff AS, Ricken G, Widhalm G, Rajky O, Hainfellner JA, Birner P, Raderer M, Preusser M. PD1 (CD279) and PD-L1 (CD274, B7H1) expression in primary central nervous system lymphomas (PCNSL). Clin Neuropathol. 2014; 33:42–49.
68. Menter T, Bodmer-Haecki A, Dirnhofer S, Tzankov A. Evaluation of the diagnostic and prognostic value of PDL1 expression in Hodgkin and B-cell lymphomas. Hum Pathol. 2016; 54:17–24.
69. Steidl C, Shah SP, Woolcock BW, Rui L, Kawahara M, Farinha P, Johnson NA, Zhao Y, Telenius A, Neriah SB, McPherson A, Meissner B, Okoye UC, et al. MHC class II transactivator CIITA is a recurrent gene fusion partner in lymphoid cancers. Nature. 2011; 471:377–81.
70. Ahearne MJ, Bhuller K, Hew R, Ibrahim H, Naresh K, Wagner SD. Expression of PD-1 (CD279) and FoxP3 in diffuse large B-cell lymphoma. Virchows Arch. 2014; 465:351–58.
71. Rossille D, Gressier M, Damotte D, Maucort-Boulch D, Pangault C, Semana G, Le Gouill S, Haioun C, Tarte K, Lamy T, Milpied N, Fest T, Damaj G, et al. High level of soluble programmed cell death ligand 1 in blood impacts overall survival in aggressive diffuse large B-Cell lymphoma: results from a French multicenter clinical trial. Leukemia. 2014; 28:2367–75.
72. Fest T, Cerhan JR, Gandhi MK, Azzaoui I, Crooks P, Maurer MJ, Milpied N, Hertzberg MS, Lamy T, Ansell SM, Slager SL, Feldman AL, Roussel M, et al. Validation of Elevated Blood Soluble PD-L1 As an Independent Prognostic Marker in Newly Diagnosed Diffuse Large B-Cell Lymphoma (DLBCL). Blood. 2014; 124: 2998.
73. Zhang W, Bai JF, Zuo MX, Cao XX, Chen M, Zhang Y, Han X, Zhong DR, Zhou DB. PD-1 expression on the surface of peripheral blood CD4(+) T cell and its association with the prognosis of patients with diffuse large B-cell lymphoma. Cancer Med. 2016; 5:3077–84.
74. Wherry EJ. T cell exhaustion. Nat Immunol. 2011; 12:492–99.
75. Wahlin BE, Aggarwal M, Montes-Moreno S, Gonzalez LF, Roncador G, Sanchez-Verde L, Christensson B, Sander B, Kimby E. A unifying microenvironment model in follicular lymphoma: outcome is predicted by programmed death-1—positive, regulatory, cytotoxic, and helper T cells and macrophages. Clin Cancer Res. 2010; 16:637–50.
76. Myklebust JH, Irish JM, Brody J, Czerwinski DK, Houot R, Kohrt HE, Timmerman J, Said J, Green MR, Delabie J, Kolstad A, Alizadeh AA, Levy R. High PD-1 expression and suppressed cytokine signaling distinguish T cells infiltrating follicular lymphoma tumors from peripheral T cells. Blood. 2013; 121:1367–76.
77. Dorfman DM, Brown JA, Shahsafaei A, Freeman GJ. Programmed death-1 (PD-1) is a marker of germinal center-associated T cells and angioimmunoblastic T-cell lymphoma. Am J Surg Pathol. 2006; 30:802–10.
78. Carreras J, Lopez-Guillermo A, Roncador G, Villamor N, Colomo L, Martinez A, Hamoudi R, Howat WJ, Montserrat E, Campo E. High numbers of tumor-infiltrating programmed cell death 1-positive regulatory lymphocytes are associated with improved overall survival in follicular lymphoma. J Clin Oncol. 2009; 27:1470–76.
79. Richendollar BG, Pohlman B, Elson P, Hsi ED. Follicular programmed death 1-positive lymphocytes in the tumor microenvironment are an independent prognostic factor in follicular lymphoma. Hum Pathol. 2011; 42:552–57.
80. Laurent C, Müller S, Do C, Al-Saati T, Allart S, Larocca LM, Hohaus S, Duchez S, Quillet-Mary A, Laurent G, Brousset P, Valitutti S. Distribution, function, and prognostic value of cytotoxic T lymphocytes in follicular lymphoma: a 3-D tissue-imaging study. Blood. 2011; 118:5371–79.
81. Smeltzer JP, Jones JM, Ziesmer SC, Grote DM, Xiu B, Ristow KM, Yang ZZ, Nowakowski GS, Feldman AL, Cerhan JR, Novak AJ, Ansell SM. Pattern of CD14+ follicular dendritic cells and PD1+ T cells independently predicts time to transformation in follicular lymphoma. Clin Cancer Res. 2014; 20:2862–72.
82. Yang ZZ, Grote DM, Ziesmer SC, Xiu B, Novak AJ, Ansell SM. PD-1 expression defines two distinct T-cell sub-populations in follicular lymphoma that differentially impact patient survival. Blood Cancer J. 2015; 5:e281.
83. Ramsay AG, Clear AJ, Fatah R, Gribben JG. Multiple inhibitory ligands induce impaired T-cell immunologic synapse function in chronic lymphocytic leukemia that can be blocked with lenalidomide: establishing a reversible immune evasion mechanism in human cancer. Blood. 2012; 120:1412–21.
84. Brusa D, Serra S, Coscia M, Rossi D, D’Arena G, Laurenti L, Jaksic O, Fedele G, Inghirami G, Gaidano G, Malavasi F, Deaglio S. The PD-1/PD-L1 axis contributes to T-cell dysfunction in chronic lymphocytic leukemia. Haematologica. 2013; 98:953–63.
85. Wilcox RA, Feldman AL, Wada DA, Yang ZZ, Comfere NI, Dong H, Kwon ED, Novak AJ, Markovic SN, Pittelkow MR, Witzig TE, Ansell SM. B7-H1 (PD-L1, CD274) suppresses host immunity in T-cell lymphoproliferative disorders. Blood. 2009; 114:2149–58.
86. Vranic S, Ghosh N, Kimbrough J, Bilalovic N, Bender R, Arguello D, Veloso Y, Dizdarevic A, Gatalica Z. PD-L1 Status in Refractory Lymphomas. PLoS One. 2016; 11:e0166266.
87. Brown JA, Dorfman DM, Ma FR, Sullivan EL, Munoz O, Wood CR, Greenfield EA, Freeman GJ. Blockade of programmed death-1 ligands on dendritic cells enhances T cell activation and cytokine production. J Immunol. 2003; 170:1257–66.
88. Cetinözman F, Jansen PM, Willemze R. Expression of programmed death-1 in primary cutaneous CD4-positive small/medium-sized pleomorphic T-cell lymphoma, cutaneous pseudo-T-cell lymphoma, and other types of cutaneous T-cell lymphoma. Am J Surg Pathol. 2012; 36:109–16.
89. Xia Y, Jeffrey Medeiros L, Young KH. Signaling pathway and dysregulation of PD1 and its ligands in lymphoid malignancies. Biochim Biophys Acta. 2016; 1865:58-71.
90. Cetinözman F, Jansen PM, Vermeer MH, Willemze R. Differential expression of programmed death-1 (PD-1) in Sézary syndrome and mycosis fungoides. Arch Dermatol. 2012; 148:1379–85.
91. Kozako T, Yoshimitsu M, Fujiwara H, Masamoto I, Horai S, White Y, Akimoto M, Suzuki S, Matsushita K, Uozumi K, Tei C, Arima N. PD-1/PD-L1 expression in human T-cell leukemia virus type 1 carriers and adult T-cell leukemia/lymphoma patients. Leukemia. 2009; 23:375–82.
92. Miyoshi H, Kiyasu J, Kato T, Yoshida N, Shimono J, Yokoyama S, Taniguchi H, Sasaki Y, Kurita D, Kawamoto K, Kato K, Imaizumi Y, Seto M, Ohshima K. PD-L1 expression on neoplastic or stromal cells is respectively a poor or good prognostic factor for adult T-cell leukemia/lymphoma. Blood. 2016; 128:1374–81.
93. Taube JM, Young GD, McMiller TL, Chen S, Salas JT, Pritchard TS, Xu H, Meeker AK, Fan J, Cheadle C, Berger AE, Pardoll DM, Topalian SL. Differential Expression of Immune-Regulatory Genes Associated with PD-L1 Display in Melanoma: Implications for PD-1 Pathway Blockade. Clin Cancer Res. 2015; 21:3969–76.
94. Rizvi NA, Hellmann MD, Brahmer JR, Juergens RA, Borghaei H, Gettinger S, Chow LQ, Gerber DE, Laurie SA, Goldman JW, Shepherd FA, Chen AC, Shen Y, et al. Nivolumab in Combination With Platinum-Based Doublet Chemotherapy for First-Line Treatment of Advanced Non-Small-Cell Lung Cancer. J Clin Oncol. 2016; 34:2969–79.
95. Grigg C, Rizvi NA. PD-L1 biomarker testing for non-small cell lung cancer: truth or fiction? J Immunother Cancer. 2016; 4:48.
96. Herbst RS, Soria JC, Kowanetz M, Fine GD, Hamid O, Gordon MS, Sosman JA, McDermott DF, Powderly JD, Gettinger SN, Kohrt HE, Horn L, Lawrence DP, et al. Predictive correlates of response to the anti-PD-L1 antibody MPDL3280A in cancer patients. Nature. 2014; 515:563–67.
97. Scognamiglio G, De Chiara A, Di Bonito M, Tatangelo F, Losito NS, Anniciello A, De Cecio R, D’Alterio C, Scala S, Cantile M, Botti G. Variability in Immunohistochemical Detection of Programmed Death Ligand 1 (PD-L1) in Cancer Tissue Types. Int J Mol Sci. 2016; 17:17.
98. Tumeh PC, Harview CL, Yearley JH, Shintaku IP, Taylor EJ, Robert L, Chmielowski B, Spasic M, Henry G, Ciobanu V, West AN, Carmona M, Kivork C, et al. PD-1 blockade induces responses by inhibiting adaptive immune resistance. Nature. 2014; 515:568–71.
99. Hude I, Sasse S, Engert A, Bröckelmann PJ. The emerging role of immune checkpoint inhibition in malignant lymphoma. Haematologica. 2017; 102:30–42.
100. Lesokhin AM, Ansell SM, Armand P, Scott EC, Halwani A, Gutierrez M, Millenson MM, Cohen AD, Schuster SJ, Lebovic D, Dhodapkar M, Avigan D, Chapuy B, et al. Nivolumab in Patients With Relapsed or Refractory Hematologic Malignancy: Preliminary Results of a Phase Ib Study. J Clin Oncol. 2016; 34:2698–704.
101. Ding W, Dong H, Call TG, Shanafelt TD, Parikh SA, Leis JF, Laplant BR, He R, Witzig TE, Lin Y, Chanan-Khan A, Bowen DA, Conte M, et al. PD-1 Blockade with Pembrolizumab (MK-3475) in Relapsed/Refractory CLL Including Richter Transformation: An Early Efficacy Report from a Phase 2 Trial (MC1485). Blood. 2015; 126:834.
102. Bi XW, Wang H, Zhang WW, Wang JH, Liu WJ, Xia ZJ, Huang HQ, Jiang WQ, Zhang YJ, Wang L. PD-L1 is upregulated by EBV-driven LMP1 through NF-κB pathway and correlates with poor prognosis in natural killer/T-cell lymphoma. J Hematol Oncol. 2016; 9:109.
103. Larkin J, Chiarion-Sileni V, Gonzalez R, Grob JJ, Cowey CL, Lao CD, Schadendorf D, Dummer R, Smylie M, Rutkowski P, Ferrucci PF, Hill A, Wagstaff J, et al. Combined Nivolumab and Ipilimumab or Monotherapy in Untreated Melanoma. N Engl J Med. 2015; 373:23–34.
104. Jing W, Gershan JA, Weber J, Tlomak D, McOlash L, Sabatos-Peyton C, Johnson BD. Combined immune checkpoint protein blockade and low dose whole body irradiation as immunotherapy for myeloma. J Immunother Cancer. 2015; 3:2.
105. Ansell SM, Gutierrez ME, Shipp MA, Gladstone D, Moskowitz A, Borello I, Popa-Mckiver M, Farsaci B, Zhu L, Lesokhin AM, Armand P. A Phase 1 Study of Nivolumab in Combination with Ipilimumab for Relapsed or Refractory Hematologic Malignancies (CheckMate 039). Blood. 2016; 128:183.