
INTRODUCTION
Pancreatic cancer is a lethal disease with the 5-year survival rate of less than 5% and the median survival of 6 months, rendering it the fourth cause of cancer-related deaths [1]. In practical settings, only 15% patients were diagnosed at early stages and suitable for radical resection, which offers the only chance for cure [2]. On the contrary, most patients were diagnosed as metastatic disease, for which chemotherapy was their only option. However, drugs available only bring modest benefits dues to chemoresistence [3–5]. Hence, it is of great urgency to identify new therapeutic targets so as to improve the prognosis for the patients.
Bile acids (BAs) are natural end products of cholesterol metabolism that function to emulsify and solubilize the lipid aggregates. In the recent years, much had learned between BAs and tumorigenesis, and nearly all studies suggested that BAs involved extensively in human cancer initiation and progression [6, 7]. Farnesoid X receptor (FXR) was a key receptor of BAs, and it was overexpression in various human malignancies associating with anti- and/or pro-tumoral roles. For instance, prior studies indicated that inactivation of FXR in cancer of liver and breast corresponded with increased propagation and decreased apoptosis [8, 9]. While, a study by B Guan and colleagues showed the opposite, they found that FXR inhibition limits the growth of esophageal cancer [10]. As to pancreatic cancer, the existing studies had concluded an overexpression profile of FXR with conflicting roles. For instance, Lee JY showed that FXR functions as oncogene since it positively correlated with lymph node metastasis, migration and invasion of pancreatic cancer [11]; while another direct evidence, obtained more recently, indicated that elevated FXR in pancreatic cancer was responsible for a less aggressiveness phenotype and favors a better prognosis [12]. Obviously, the conflicting results promoted us to re-evaluate the function of FXR in the lethal disease.
In the present study, we examined the expression and biological significance of FXR in pancreatic cancer in a larger population from both protein and mRNA levels. We showed that FXR was upregulated in both mRNA and protein levels, and its overexpression confers a poor prognosis for the patients. In addition, we also showed that FXR was positively correlated with Sp1, a factor found to be an independent prognostic factor for pancreatic cancer in our prior study [13]. Their co-high expression confers the poorest prognosis among all the patients, which could regard as an independent prognostic factor for the patients. Finally, we proposed a model, which included activated FXR signaling to Sp1, to illustrate the detailed crosstalk between Sp1 and FXR.
RESULTS
Correlated Sp1 and FXR expression in mRNA level in pancreatic cancer tissues
To investigate the role of FXR in pancreatic cancer; we initially examined its expression in mRNA level in clinical samples of pancreatic cancer. To this end, the RNA-seq data of pancreatic cancer was downloaded from TCGA. We found that FXR expressed ubiquitously with different levels (Figure 1A). Moreover, a significant difference could be observed between high and low expression groups (p < 0.001, Figure 1A). Furthermore, survival analysis showed that high FXR expression indicated a poor prognosis for the patients (Table 1, p < 0.001, Figure 1B).
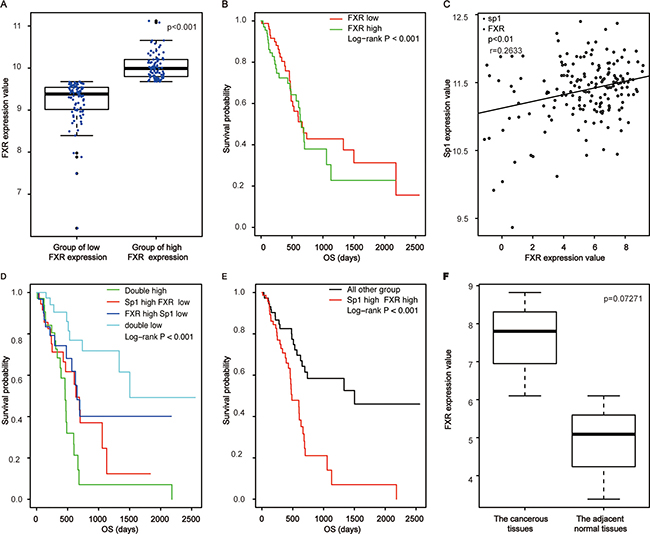
Figure 1: Correlated high expression of Sp1 and FXR in mRNA levels confers the poorest prognosis for pancreatic cancer. (A) The comparison of FXR expression between the high group and the low one; (B) Survival analysis of pancreatic cancer patients based on FXR expression; (C) Correlation assay between FXR and Sp1 in mRNA level; (D, E) Survival analysis of pancreatic cancer patients based on Sp1 and FXR in mRNA level; (F) The comparison of FXR expression between the cancerous tissues and the paired none cancerous tissues in mRNA level.
Table 1: The detailed survival data of pancreatic cancer based on FXR expression
Number at risk |
||||
|---|---|---|---|---|
Year |
0 (year ) |
2 (year ) |
4 (year ) |
6 (year ) |
Low |
87(49.7%) |
16(9.1%) |
6(3.4%) |
1(0.6%) |
High |
88(50.3%) |
9(5.1%) |
3(1.7%) |
0(0.0%) |
Median survival time (year) |
||||
Low |
1.83 |
|||
High |
1.78 |
|||
Survival rate |
Three year survival rate (95% CI) |
Five year survival rate |
||
Low |
0.4288(0.3020~0.6089) |
0.3127(0.1776~0.5503) |
||
High |
0.3036(0.1646~0.5600) |
0.2277(0.0989~0.5241) |
||
Specificity protein (Sp1) is a nuclear transcription factor locating in the nuclear. It expressed ubiquitously in all cells of an individual and responsible for proliferation, differentiation and apoptosis [14, 15]. We found previously that elevated Sp1 confers a poor prognosis for pancreatic cancer [13]. Since activated FXR could trigger line of signaling associating with cell proliferation, metastasis and chemoresistence by phosphorylating downstream molecule, and phosphorylated Sp1 was the active form of Sp1 [16]; we postulated that the two factors were related in pancreatic cancer. Base on the hypothesis, we examined their correlationship and found that they were positively correlated (p < 0.01, r = 0.263, Figure 1C) in mRNA levels with their simultaneously high expression indicated the poorest prognosis for the patients (p < 0.001, Figure 1D, 1E). Of note, we showed no significant differences of FXR expression between the cancerous tissues and the paired adjacent tissues (p = 0.0727, Figure 1F), which might cause by the small samples of adjacent tissues included in TCGA.
FXR was overexpression in protein level in pancreatic cancer tissues
To confirm the role of FXR in pancreatic cancer; we then examined its expression in protein level by immunohistochemistry. We showed that patients exhibited different levels of FXR expression ranging from negative to strong positive (Figure 2A). In addition, our data also showed that there was a significant difference of FXR expression between the cancerous tissues and the paired normal tissues (p < 0.05, Table 2, Figure 2B). Moreover, Pearson’s chi-squared test showed that high FXR expression was positively correlated with tumor location (p = 0.04, Table 3), but not with other parameters of the patients, such as age, gender and so on. Finally, Kaplan–Meier analysis suggested that high FXR expression confers a poor prognosis (p = 0.002, Figure 2C), and its high expression could be regarded as an independent prognostic factor (p < 0.001; HR = 3.27; 95% CI 1.86–5.76, Table 4).
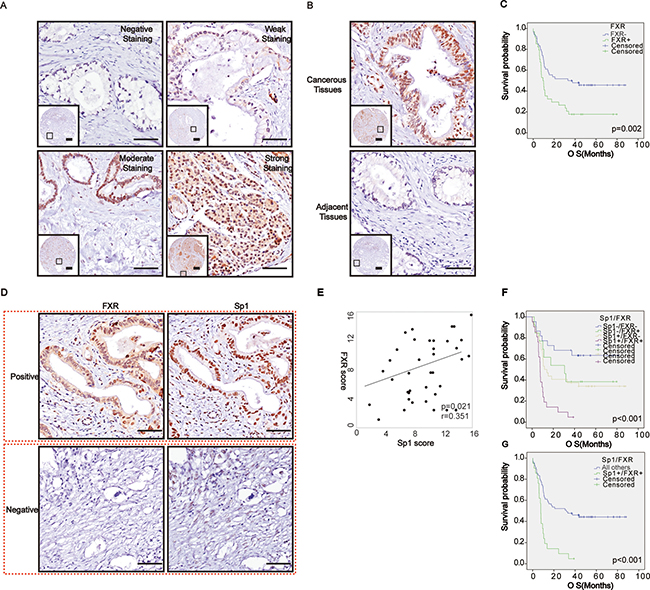
Figure 2: Correlated high expression of Sp1 and FXR in protein levels confers the poorest prognosis for pancreatic cancer. (A) Representative imagines of FXR staining in pancreatic cancer; (B) Representative imagines of FXR staining in the cancerous tissues and paired normal tissues; (C) Survival analysis based on FXR expression; (D) Representative imagines depicted the correlation between Sp1 and FXR in the series sections; (E) Correlation assay between Sp1 and FXR staining in pancreatic cancer; (F–G) Survival analysis based on FXR and Sp1 expression. All others: Sp1+FXR−, Sp1−FXR+, and Sp1−FXR−.
Table 2: FXR expression in the cancerous tissues and the adjacent tissues
Number |
FXR |
P |
||
|---|---|---|---|---|
Positive |
Negative |
|||
Cancerous tissues |
88 |
54 (61.4%) |
34 (38.6%) |
P < 0.05 |
Adjacent tissues |
88 |
27 (30.7%) |
61 (69.3%) |
|
Table 3: Correlation between FXR expression and the clinicopathologicfeatures of pancreatic cancer patients
Factor |
N |
FXR |
||
|---|---|---|---|---|
Positive |
Negative |
P |
||
Gender |
||||
Male |
56 (63.6%) |
34 (38.6%) |
22 (25%) |
0.87 |
Female |
32 (36.4%) |
20 (22.7%) |
12 (13.7%) |
|
Age |
||||
≤ 60 |
41 (46.6%) |
24 (27.3%) |
17 (19.3%) |
0.61 |
> 60 |
47 (53.4%) |
30 (34.1%) |
17 (19.3%) |
|
Tumor stage |
||||
≤ T2 |
74 (84.1%) |
45 (51.1%) |
29 (33%) |
0.81 |
T3 |
14 (15.9%) |
9 (10.2%) |
5 (5.7%) |
|
Nodal stage |
||||
N0 |
52 (59.1%) |
32 (36.3%) |
20 (22.7%) |
0.97 |
N1 |
36 (40.9%) |
22 (25%) |
14 (15.9%) |
|
Primary tumor location |
||||
Body and Tail |
30 (34.1%) |
14 (15.9%) |
16 (18.2%) |
0.04 |
Head and Neck |
58 (65.9%) |
40 (45.5%) |
18 (20.4%) |
|
Lymphvascular invasion |
||||
No |
50 (56.8%) |
32 (36.4%) |
18 (20.5%) |
0.56 |
Yes |
38 (43.2%) |
22 (25%) |
16 (18.2%) |
|
Nuclear grade |
||||
≤ II |
73 (83%) |
48 (54.5%) |
25 (28.4%) |
0.06 |
> II |
15 (17%) |
6 (6.8%) |
9 (10.2%) |
|
Jaundice |
||||
No |
62 (70.5%) |
36 (40.9%) |
26 (29.6%) |
0.33 |
Yes |
26 (29.5%) |
18 (20.5%) |
8 (9%) |
|
Abdominal pain |
||||
No |
39 (44.3%) |
27 (30.7%) |
12 (13.6%) |
0.18 |
Yes |
49 (55.7%) |
27 (30.7%) |
22 (25%) |
|
Table 4: Univariate and multivariate survival analysis of clinic-pathologic variables of pancreatic cancer patients
Factor |
OS (Months) |
Univariate analysis |
Multivariate analysis |
||||
|---|---|---|---|---|---|---|---|
HR |
95%CI |
P |
HR |
95%CI |
P |
||
Gender |
|||||||
Male |
11.1 (0.2–88.0) |
0.58 |
0.33–1.03 |
0.07 |
|||
Female |
36.7 (0.1–76.4) |
1 |
|||||
Age |
|||||||
> 60 |
11.3 (0.2–86.7) |
1.05 |
0.63–1.77 |
0.84 |
|||
≤ 60 |
15.2 (0.1–88.0) |
1 |
|||||
T stage |
|||||||
T3 |
23.5 (0.2–88.0) |
1.03 |
0.50–2.09 |
0.95 |
|||
≤ T2 |
12.6 (0.1–86.7) |
1 |
|||||
Nodal stage |
|||||||
N0 |
33.5 (0.2–88.0) |
0.69 |
0.53–0.90 |
0.006 |
0.55 |
0.31–0.95 |
0.03 |
N1 |
9.8 (0.1–86.7) |
1 |
1 |
||||
Primary tumor location |
|||||||
Head/Neck |
14.8 (0.1–88.0) |
0.83 |
0.49–1.43 |
0.51 |
|||
Body/Tail |
10.5 (1.3–79.6) |
1 |
|||||
Lymphvascular invasion |
|||||||
Yes |
10.6 (0.2–82.4) |
1.39 |
0.82–2.33 |
0.22 |
|||
No |
18.0 (0.1–88.0) |
1 |
|||||
Nuclear grade |
|||||||
≤ II |
18.4 (0.2–88.0) |
0.68 |
0.49–0.93 |
0.02 |
0.46 |
0.23–0.91 |
0.03 |
> II |
7.0 (0.1–79.6) |
1 |
1 |
||||
Jaundice |
|||||||
No |
14.2 (0.2–82.4) |
0.98 |
0.55–1.74 |
0.94 |
|||
Yes |
11.5 (0.1–88.0) |
1 |
|||||
Abdominal pain |
|||||||
No |
10.6 (0.1–88.0) |
0.71 |
0.42–1.19 |
0.19 |
|||
Yes |
17.6 (2.7–86.7) |
1 |
|||||
Sp1 |
|||||||
Positive |
9.9 (0.1–88.0) |
2.42 |
1.35–4.33 |
0.003 |
2.27 |
1.24–4.16 |
0.008 |
Negative |
37.4 (0.2–81.5) |
1 |
1 |
||||
FXR |
|||||||
Negative |
9.6 (0.1–79.6) |
2.15 |
1.27–3.63 |
0.004 |
2.02 |
1.16–3.49 |
0.01 |
Positive |
34.8 (0.2–88.0) |
1 |
1 |
||||
Sp1/FXR |
|||||||
Sp1+/FXR+ |
10.1 (0.2–88.0) |
3.27 |
1.86–5.76 |
< 0.001 |
2.71 |
1.53–4.80 |
0.001 |
All others |
34.2 (0.1–82.4) |
1 |
1 |
||||
Correlated Sp1 and FXR expression in protein level in pancreatic cancer tissues and cell lines
Subsequently, we tried to investigate whether the correlation between Sp1 and FXR also exists in pancreatic cancer in protein level. To obtain this, we observed their expression in the serial sections of tissue microarray and found that where FXR staining accompanied by Sp1 staining, and vice versa (Figure 2D). Statistically, Spearman’s rank test also revealed a positively correlation between them (p = 0.021, r = 0.35, Table 5, Figure 2E). Furthermore, survival assay indicated that their simultaneous high expression confers the poorest prognosis among all the patients (p < 0.001, Figure 2F, 2G), and their combined high expression was also an independent prognostic factor for the patients (p < 0.001, HR = 3.27, 95% CI 1.86-5.76, Table 4).
Table 5: FXR was positively correlated with Sp1 in protein level in pancreatic cancer
Parameters |
FXR |
χ2 |
Co-efficient |
P |
|||
|---|---|---|---|---|---|---|---|
Positive |
Negative |
Total |
|||||
Sp1 |
Positive |
40 (45.5%) |
13 (14.8%) |
53 (60.2%) |
11.19 |
0.35 |
P < 0.05 |
Negative |
14 (15.9%) |
21 (23.9%) |
35 (39.8%) |
||||
Total |
54 (61.4%) |
34 (38.6%) |
88 (100%) |
||||
Meanwhile, we also investigated whether the positive correlation exists in the cell line of pancreatic cancer in protein level. To begin with, we detected FXR expression in the cell lines. We found that FXR expression was higher in the cancerous cell lines when compared to the normal cell- human pancreatic duct epithelial (HPDE) cells (Figure 3A). After that, we investigated Sp1 expression after FXR deletion in the cancer cell lines so as to reveal their correlation. The data indicated that Sp1 expression was down regulated upon FXR knockdown (Figure 3B), suggesting that the positive correlation also existed in pancreatic cancer cells in protein level.
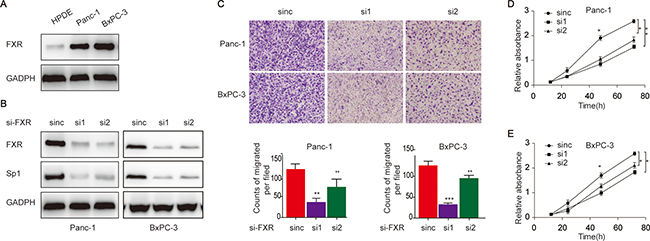
Figure 3: Elevated FXR in pancreatic cancer cells associate with increased proliferation and migration capacities. (A) FXR expression in pancreatic cancer cell line and HPDE; (B) The detection of Sp1 expression upon FXR knockdown; (D/E) The evaluation of proliferation (C) the evaluation of pancreatic cancer proliferation after FXR knockdown; (D) and migration (E) of pancreatic cancer cells upon FXR knockdown.
Additionally, the biological behaviours of pancreatic cancer cells were examined upon FXR knockdown. We showed that the cells showed decreased migration upon FXR knockdown (Figure 3C). Consistently, our data also indicated that the cells showed decreased proliferation upon FXR knockdown (Figure 2D, 2E). Taken together, these data indicated that elevated FXR expression was a risk factor pancreatic cancer initiation and progression.
Proposed model linking FXR to Sp1 in pancreatic cancer
Systematical literature review indicted that FXR functions through activating downstream signaling, such as p38/MAPK [17] and PI3K/AKT [18], which subsequently phosphorylate downstream molecule, leading to deregulated cell proliferation, invasion and metastasis, and chemoresistence. This very fact in combined with our finding that FXR was positively correlated Sp1 and the discovery that phosphorylated Sp1 was the activated form of Sp1 promoted us to proposed a model to link FXR to Sp1: BAs-triggered FXR increase the over-activation of p38-MAPK and/or PI3K/AKT signaling in the plasma resulting in the phosphorylation of Sp1, which finally activate the expression of genes associating with the malignant phenotype of pancreatic cancer (Figure 4).
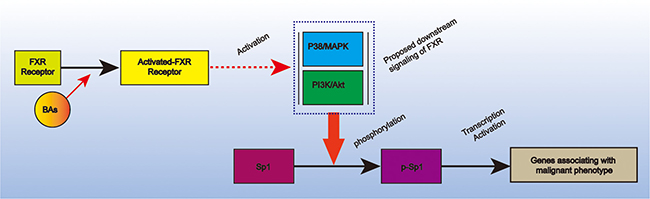
Figure 4: Proposed model that link Sp1 and FXR in pancreatic cancer. It depicted that BAs-triggered FXR could phosphorylate Sp1 via p38-MAPK and/or PI3K-AKT signaling. The activated Sp1 could subsequently promote pancreatic cancer progression via transcription activation.
DISCUSSION
In the present study, FXR expression and its biological significance in pancreatic cancer were investigated. We showed that FXR expressed ubiquitously in pancreatic cancer, and that high FXR expression confers a poor prognosis. Moreover, we also found that Sp1 was positively correlated with FXR with their simultaneous high expression confers the poorest prognosis for the patients. Based on the data, we proposed a model to illustrate the crosstalk between FXR and Sp1. Taken together; our study added the wealth knowledge on the pro-tumoral role of FXR in pancreatic cancer and suggested that targeted inhibition of FXR and/or in combination of Sp1 might provide an alternative approach for the management of pancreatic cancer.
Bile acids (BAs) are natural end products of cholesterol metabolism that function to emulsify and solubilize the lipid aggregates. Previously, researches on BAs were mainly focused on its role in chronic inflammation, such as acute pancreatitis [19] and gastritis [20, 21], and the positive correlation between chronic inflammations of the gastrointestinal tract organs had now been well established. Since inflammation was a widely accepted risk factor for human malignancies [22, 23], mounting studies were conducted to investigate the role of BAs on tumorigenesis in the recent years. Most of the studies concluded BAs to be risk factor for human cancers, especially for the gastrointestinal tract ones [6], despite some of the existing data showed that BAs to be an anti-tumoral factor [24]. As to pancreas, none systematically investigated the role of BAs in pancreatic carcinogenesis. Recently, a study completed by Tomohiko Adachi showed that refluxed BAs into pancreatic ducts to be a significant factor predisposing to pancreatic intraductal papillary carcinomas [25], which suggested that BAs might also function as a pro-tumoral factor in pancreatic cancer.
FXR is a nuclear receptor that responsible for bile acid homeostasis via regulating the expression of genes involved in the process [26, 27]. However, there were various reports that FXR was elevated in multiple human cancers responsible for their initiation and progression [28, 29]. For instance, it is stated that FXR could suppress the proliferation of liver cancer via the inhibition of mTOR/S6K signaling [8]. On the other hand, some of the reports proposed the opposite; they showed that that the inhibition of FXR limits esophageal cancer growth [10]. The paradox data indicated that the exact role of FXR was tissue-specific. As to pancreatic cancer, the reported function of FXR was also paradox, with Giaginis C showed that FXR was anti-tumoral [12], while Lee JY showed that FXR overexpression facilitates lymphatic metastasis of pancreatic cancer [11]. Apparently, our data contradicted with Giaginis C. Comprehensive review of these studies showed that our data was more convincible, as we included a larger sample size, and the conclusion were drawn from both the mRNA and protein levels.
Considering the biological significance, we preliminary investigated the machinery whereby FXR interacts with Sp1 in pancreatic cancer. Since FXR could functions via phosphorylating downstream molecule [16], and phosphorylated Sp1 was the active form of Sp1 [30]. We hence hypothesized that Sp1 functions downstream of FXR. As Sp1 was a transcription factor, there was possibility that elevated FXR in pancreatic cancer resultant from elevated Sp1 transcription activity. Indeed, this might give the explanation of the correlated Sp1 and FXR in the disease. Overall, these hypotheses were merely based on literatures review and needed further experimental confirmation.
In conclusion, our findings reveal strong expression of FXR in pancreatic cancer, and suggested that FXR may serve as an oncogenic factor that promotes pancreatic progression by collaborating with Sp1. Since both FXR and Sp1 were associated with the malignant phenotypes of pancreatic cancer, further study is required to determine their potential roles to be candidate therapeutic target in the clinics.
MATERIALS AND METHODS
Bioinformatics analysis
RNA-Seq data of PDAC was downloaded from TCGA (http://cancergenome.nih.gov/). The data includes 183 pancreatic cancer patients in total, and four patients were with paired-none cancerous tissues. Other information of the patients, such as age, gender, prognosis and so on, were obtained from the website. For statistical analysis, the patients were divided into halves base on Sp1 and FXR expression values. Specifically, patients with the expression values greater than the median value were classified into the high expression group, while the rest were added to the low expression group.
Cell lines and cell culture
Human pancreatic duct epithelial (HPDE) cells and pancreatic cancer cell lines were purchased from Shanghai Institute for Life Science, Chinese Academy of Sciences. All the cells were cultured in RPMI 1640 supplemented with 10% fetal bovine serum (FBS, Gibco, Carlsbad, CA, USA) at 37 °C in a humidified atmosphere of 95% air and 5% CO2, and grown in a humidified atmosphere of air/CO2 (95%: 5%). Cells with gene deletion were cultured in the same condition with 1.5-μg/mL puromycin (Sigma-Aldrich, St. Louis, MO, USA). For passage and experimental purposes, the cells were detached using trypsin-EDTA and resuspended in the complete medium.
siRNA transfections
Cells were plated in 6-wells plates and transfected with 3 μl RNAi in the presence of 4μl RNAimax (Invitrogen) according to manufactures’ instructions. Two different siRNAs and the control siRNA were purchased from Genepharm Technologies (Shanghai, China). Gene silencing effects were confirmed by Western blot analysis at 48 hours post-transfection. Specific siRNA oligo duplexes targeting FXR (FXR siRNA#1:5′-GCGGTTGAAGCTATGTTCCTTCGTT-3′;FXR siRNA# 2:5′-GGCTCCAGGGAATCCTGCATTCTAA-3′) and the negative control siRNA were synthesized by GenePharma (Shanghai, China).
Migration assays
For migration assays, the treated cells were grown in 60-mm plates in RPMI-1640 without growth factors for 24h. The complete media were added to the bottom chambers of 24-well tissue culture plates in triplicate. The cells (40,000) were added to the upper chambers of Transwell assays (BD Biosciences, Franklin) Cells were allowed to migrate for 14 h and then fixed, stained, and quantified.
Cell proliferation CCK8 assay
For in vitro proliferation cells were plated at 1000 cells per well of a 96 well plate and after 16 h, growth medium with different concentrations of the respective FXR agonist was added. After 72 hours, the DNA content was determined using a spectro-fluorometer (Envision, Perkin Elmer, Boston, U.S.A.) using the CyQuant Direct Proliferation Assay (according to the manufacturers recommendations.
Western blot analysis
Cells were washed three times with cold PBS and lysed on ice in RIPA buffer with protease inhibitors PMSF (Beyotime Biotechnology, China). Protein concentrations were determined by BCA method (Beyotime Biotechnology, China). A total of 20 μg protein was separated by 10% SDS-PAGE and electro-blotted onto NC membranes using semi-dry blotting apparatus. After blocking in 3% bovine serum albumin (BSA), the membranes were incubated with the primary antibodies overnight at 4°C. The membranes were washed and incubated with the secondary antibodies for 1h at room temperature on a shaker. The protein bands were visualized using a commercially available enhanced chemiluminesence kit (Thermo Scientific, Hudson, NH, USA). GAPDH were used as control. The primary antibodies used in the study include: Sp1(1:1000), FXR:1(1000) (CST, Beverly, MA, USA); and GAPDH (Santa Cruz Biotechnology, CA, USA)
Patients
88 patients in total who were histopathologically diagnosed as pancreatic cancer at the Department of General Surgery, Shanghai General Hospital affiliated Shanghai Jiao Tong University from 2009 to 2012. The histological characterization and clinic pathological staging of the samples were determined according to current International Union Against Cancer Guidelines. Cancerous and adjacent normal tissues were collected from patients during the surgeries. Written informed consents and approvals from the Ethics Committees of Shanghai General Hospital were obtained for the use of these materials for research purposes. The study was consistent with the provisions of the Declaration of Helsinki (as revised in Fortaleza, Brazil, October 2013).
Tissue microarray construction
The microarray was made in collaboration with Shanghai Biochip, Shanghai, China. Briefly, hematoxylin and eosin (HE) stained sections from primary tumor blocks were used to define two representative tumor regions and adjacent normal tissues: representative tumor regions were defined as tumor areas containing more than 75% cancer cells without necrosis; and adjacent normal tissues at least 5 cm from the tumor regions were randomly selected. Samples were not taken from areas of bleeding. Cylinders (1.5 mm in diameter) were then punched from defined regions of a tissue block using a tissue microarrayer (Century, IL, CA, USA) and inserted into recipient paraffin blocks. Two sets of three paraffin-embedded tissue microarray blocks were made, and sections of these blocks were transferred onto glass slides. In total, two sets of tissue microarray blocks containing 88 tumor tissue spots and 88 adjacent normal tissue spots were used in this study.
Immunohistochemistry
A standard immunohistochemistry protocol was used as previously described [31]. Briefly, tissue microarray sections were dewaxed and dehydrated in a xylene and alcohol bath solution. Endogenous peroxidase activity was then blocked by a 10-min incubation in 0.3% hydrogen peroxide. Antigen retrieval was then achieved by incubating the slides in 0.01 M citrate buffer (pH 6.0) at 98°C for 5 min using a microwave oven. The slides were then cooled to room temperature and blocked in normal goat serum at room temperature for 1 h, followed by incubation with a primary antibody at 4°C overnight. The sections were then incubated with a horseradish peroxidase-labeled secondary antibody and visualized using 3,3′-diaminobenzidine.
Score of staining density
Evaluation of the staining in at least five areas at 400 × magnification was performed by two independent pathologists blind to study. The staining was scored according to the intensity and percentage of the stained cells. Staining intensity was assigned as 1 (no staining), 2 (weak staining), 3 (moderate staining), and 4 (strong staining). The percentages were classified into four categories: 1 (≤ 25%), 2 (25%–50%), 3 (50%–75%), and 4 (75%–100%). The final scores were calculated as the staining intensity × the percentage of positive cells. For statistical analyses, a score < 8 was regarded as negative expression, and > 8 as positive expression.
Statistical analysis
Statistical analyses were performed using SPSS (version 21.0; SPSS Inc., Chicago, USA). The relationships between the clinicopathlogical factors and FXR were investigated using Pearson χ2 test. The Spearman’s rank test was used to evaluate the correlation between Sp1 and FXR. Kaplan–Meier analysis was used to demonstrate differences in overall survival (OS). The correlation between the factors and OS were investigated with the Cox regression model. Factors correlating with OS in the univariate analysis were tested by multivariate analysis. The hazard ratio (HR) and corresponding 95% confidence intervals (95% CI) were calculated for each factor. Data were considered statistically significant when p < 0.05.
ACKNOWLEDGMENTS AND FUNDING
This study was supported in part by the National Natural Science Foundation of China (Grant No. 81502018, 81572315, 81171887 and 91229117), the Program of Shanghai Subject Chief Scientist (Grant no. 12XD1404200), the Shanghai Science and Technology Committee (Grant no. 11DZ1922002), a research grant from the Shanghai Hospital Development Center (Grant no. SHDC12014128), the National Key Clinical Discipline-Oncology, and the Songjiang Liandong Program (Grant no. 0702N14002).
CONFLICTS OF INTEREST
The authors have no conflicts of Interest.
REFERENCES
1. Siegel RL, Miller KD, Jemal A. Cancer statistics, 2015. CA Cancer J Clin. 2015; 65:5–29.
2. Neoptolemos JP. Adjuvant treatment of pancreatic cancer. European Journal of Cancer. 2011; 47:S378–S380.
3. Burris Hr, Moore MJ, Andersen J, Green MR, Rothenberg ML, Modiano MR, Cripps MC, Portenoy RK, Storniolo AM, Tarassoff P. Improvements in survival and clinical benefit with gemcitabine as first-line therapy for patients with advanced pancreas cancer: a randomized trial. Journal of clinical oncology. 1997; 15:2403–2413.
4. Miller K, Wang M, Gralow J, Dickler M, Cobleigh M, Perez EA, Shenkier T, Cella D, Davidson NE. Paclitaxel plus bevacizumab versus paclitaxel alone for metastatic breast cancer. New England Journal of Medicine. 2007; 357:2666–2676.
5. Hurwitz H, Fehrenbacher L, Novotny W, Cartwright T, Hainsworth J, Heim W, Berlin J, Baron A, Griffing S, Holmgren E. Bevacizumab plus irinotecan, fluorouracil, and leucovorin for metastatic colorectal cancer. New England journal of medicine. 2004; 350:2335–2342.
6. Tsuei J, Chau T, Mills D, Wan YJ. Bile acid dysregulation, gut dysbiosis, and gastrointestinal cancer. Exp Biol Med (Maywood). 2014; 239:1489–1504.
7. Li T, Apte U. Bile Acid Metabolism and Signaling in Cholestasis, Inflammation, and Cancer. Adv Pharmacol. 2015; 74:263–302.
8. Huang X, Zeng Y, Wang X, Ma X, Li Q, Li N, Su H, Huang W. FXR blocks the growth of liver cancer cells through inhibiting mTOR-s6K pathway. Biochem Biophys Res Commun. 2016; 474:351–356.
9. Giordano C, Barone I, Vircillo V, Panza S, Malivindi R, Gelsomino L, Pellegrino M, Rago V, Mauro L, Lanzino M, Panno ML, Bonofiglio D, Catalano S, et al. Activated FXR Inhibits Leptin Signaling and Counteracts Tumor-promoting Activities of Cancer-Associated Fibroblasts in Breast Malignancy. Sci Rep. 2016; 6:21782.
10. Guan B, Li H, Yang Z, Hoque A, Xu X. Inhibition of farnesoid X receptor controls esophageal cancer cell growth in vitro and in nude mouse xenografts. Cancer. 2013; 119:1321–1329.
11. Lee JY, Lee KT, Lee JK, Lee KH, Jang KT, Heo JS, Choi SH, Kim Y, Rhee JC. Farnesoid X receptor, overexpressed in pancreatic cancer with lymph node metastasis promotes cell migration and invasion. Br J Cancer. 2011; 104:1027–1037.
12. Giaginis C, Koutsounas I, Alexandrou P, Zizi-Serbetzoglou A, Patsouris E, Kouraklis G, Theocharis S. Elevated Farnesoid X Receptor (FXR) and Retinoid X Receptors (RXRs) expression is associated with less tumor aggressiveness and favourable prognosis in patients with pancreatic adenocarcinoma. Neoplasma. 2015; 62:332–341.
13. Hang J, Hu H, Huang J, Han T, Zhuo M, Zhou Y, Wang L, Wang Y, Jiao F, Wang L. Sp1 and COX2 expression is positively correlated with a poor prognosis in pancreatic ductal adenocarcinoma. Oncotarget. 2016; 7:28207–28217. doi: 10.18632/oncotarget.8593.
14. Li L, Davie JR. The role of Sp1 and Sp3 in normal and cancer cell biology. Annals of Anatomy. 2010; 192:275–283.
15. Black AR, Black JD, Azizkhan-Clifford J. Sp1 and krüppel-like factor family of transcription factors in cell growth regulation and cancer. Journal of cellular physiology. 2001; 188:143–160.
16. Jung D, York JP, Wang L, Yang C, Zhang A, Francis HL, Webb P, McKeehan WL, Alpini G, Lesage GD, Moore DD, Xia X. FXR-induced secretion of FGF15/19 inhibits CYP27 expression in cholangiocytes through p38 kinase pathway. Pflugers Arch. 2014; 466:1011–1019.
17. Debruyne PR, Bruyneel EA, Karaguni IM, Li X, Flatau G, Muller O, Zimber A, Gespach C, Mareel MM. Bile acids stimulate invasion and haptotaxis in human colorectal cancer cells through activation of multiple oncogenic signaling pathways. Oncogene. 2002; 21:6740–6750.
18. Jiang Y, Iakova P, Jin J, Sullivan E, Sharin V, Hong IH, Anakk S, Mayor A, Darlington G, Finegold M, Moore D, Timchenko NA. Farnesoid X receptor inhibits gankyrin in mouse livers and prevents development of liver cancer. Hepatology. 2013; 57:1098–1106.
19. Orabi AI, Muili KA, Javed TA, Jin S, Jayaraman T, Lund FE, Husain SZ. Cluster of differentiation 38 (CD38) mediates bile acid-induced acinar cell injury and pancreatitis through cyclic ADP-ribose and intracellular calcium release. J Biol Chem. 2013; 288:27128–27137.
20. Quante M, Bhagat G, Abrams JA, Marache F, Good P, Lee MD, Lee Y, Friedman R, Asfaha S, Dubeykovskaya Z, Mahmood U, Figueiredo JL, Kitajewski J, et al. Bile acid and inflammation activate gastric cardia stem cells in a mouse model of Barrett-like metaplasia. Cancer Cell. 2012; 21:36–51.
21. Guo C, Qi H, Yu Y, Zhang Q, Su J, Yu D, Huang W, Chen WD, Wang YD. The G-Protein-Coupled Bile Acid Receptor Gpbar1 (TGR5) Inhibits Gastric Inflammation Through Antagonizing NF-kappaB Signaling Pathway. Front Pharmacol. 2015; 6:287.
22. Candido J, Hagemann T. Cancer-related inflammation. J Clin Immunol. 2013; 33:S79–84.
23. Allavena P, Germano G, Marchesi F, Mantovani A. Chemokines in cancer related inflammation. Exp Cell Res. 2011; 317:664–673.
24. Guo C, Su J, Li Z, Xiao R, Wen J, Li Y, Zhang M, Zhang X, Yu D, Huang W, Chen WD, Wang YD. The G-protein-coupled bile acid receptor Gpbar1 (TGR5) suppresses gastric cancer cell proliferation and migration through antagonizing STAT3 signaling pathway. Oncotarget. 2015; 6:34402–34413. doi: 10.18632/oncotarget.5353.
25. Shibahara H, Tamada S, Goto M, Oda K, Nagino M, Nagasaka T, Batra SK, Hollingsworth MA, Imai K, Nimura Y, Yonezawa S. Pathologic features of mucin-producing bile duct tumors: two histopathologic categories as counterparts of pancreatic intraductal papillary-mucinous neoplasms. Am J Surg Pathol. 2004; 28:327–338.
26. Yang F, Gong J, Wang G, Chen P, Yang L, Wang Z. Waltonitone inhibits proliferation of hepatoma cells and tumorigenesis via FXR-miR-22-CCNA2 signaling pathway. Oncotarget. 2016; 7:75165–75175. doi: 10.18632/oncotarget.12614.
27. Qin P, Borges-Marcucci LA, Evans MJ, Harnish DC. Bile acid signaling through FXR induces intracellular adhesion molecule-1 expression in mouse liver and human hepatocytes. Am J Physiol Gastrointest Liver Physiol. 2005; 289:G267–273.
28. Bailey AM, Zhan L, Maru D, Shureiqi I, Pickering CR, Kiriakova G, Izzo J, He N, Wei C, Baladandayuthapani V, Liang H, Kopetz S, Powis G, et al. FXR silencing in human colon cancer by DNA methylation and KRAS signaling. Am J Physiol Gastrointest Liver Physiol. 2014; 306:G48–58.
29. Dossa AY, Escobar O, Golden J, Frey MR, Ford HR, Gayer CP. Bile acids regulate intestinal cell proliferation by modulating EGFR and FXR signaling. Am J Physiol Gastrointest Liver Physiol. 2016; 310:G81–92.
30. Jackson SP, MacDonald JJ, Lees-Miller S, Tjian R. GC box binding induces phosphorylation of Sp1 by a DNA-dependent protein kinase. Cell. 1990; 63:155–165.
31. Jiao F, Hu H, Han T, Yuan C, Wang L, Jin Z, Guo Z, Wang L. Long noncoding RNA MALAT-1 enhances stem cell-like phenotypes in pancreatic cancer cells. Int J Mol Sci. 2015; 16:6677–6693.