
INTRODUCTION
Prostate cancer (PCa) is the most common cancer diagnosed in men and is second leading cancer death among men in the United States [1] and it is 5th most common cancer in South Korean men. The incidence and mortality rates of PCa vary by 25-fold and 10-fold across populations [2]. The highest incidence rates are found in Western developed countries, and the highest mortality rates are found in the African-Americans, whereas the lowest incidence and mortality rates are reported in Asians [3]. The big differences in the epidemiologic profile raise an important question whether genetic heterogeneity or differences in the environments have a greater impact on PCa development [4].
To date, genome wide meta-analyses of PCa have provided numerous common susceptibility loci from European ancestry population [5-7]. A fine-mapping study from the European-based international consortium provided additional novel PCa signals [8]. However, a large-scaled meta-analysis identified two new PCa risk loci from only two East-Asian groups (Japanese and Chinese) [3]. Since there was a genetic difference according to the ethnic groups, we performed the first Korean population-based exome-wide association study for PCa.
Cancer risk prediction by genetic risk scores (GRS) have been designed as an efficient and effective approach in terms of clinical utility [9]. Recently, genetic risk assessment studies have been reported evaluating the cumulative genetic scores for PCa risk [10, 11]. Several customized products such as Oncotype Dx® (Genomic Health Inc, Redwood City, CA, USA), Prolaris® (Myriad Genetics, Salt Lake City, UT, USA) and Decipher® (GenomeDX Biosciences, Vancouver, BC, Canada), use a concept of polygenic risk score that is currently available to the real clinical situation [12, 13]. However, the vast majority of genome wide association study (GWAS)-derived loci explain only a limited fraction of the disease risk development and functional implications as a non-coding variant. Given ethnic differences and genetic heterogeneity, integrative genetic approaches have not been fully explored in non-European populations. Taken together, exome-based association studies and risk prediction analyses are needed to understand the potential etiologic and functional mechanisms of PCa risk. Finally, we evaluated exome-based association studies of PCa in a Korean population and additionally provide a risk prediction model using GRS formation.
RESULTS
The descriptive characteristics for the discovery stage (1,001 PCa patients and 2,641 controls) and the validation stage (514 and 548) participants are shown in Table 1. All of the men were ethnical Koreans. For the cases, the mean age was 66.3 years, the median level of prostate specific antigen (PSA) was 9.19 ng/ml and the average prostate size was 37.48 cc. Most of the cases had a biopsy Gleason score of less than 8 (biopsy Gleason score 6: 39.3% and score 7: 41.1%). Of the cases, 41 were metastatic and 820 (81.9%) were treated by radical prostatectomy (RP). The controls were younger, but not substantially leaner than the cases. Our study was performed in a two-stage design as depicted in Figure 1. In Stage I, 1,001 PCa samples and 2,641 population controls were used to find the associated markers in the Korean population and examine the previously GWAS-identified SNPs in different ethnic populations. In Stage II, the GRS was calculated based on the validated SNPs from Stage I in order to determine their discriminative ability in an independent set of cases and controls.
Table 1: Clinical characteristics for exome-wide association study among Korean population
Variables |
Prostate cancer |
Control (n = 2,641) |
Prostate Cancer II |
Control II (n=548) |
|---|---|---|---|---|
Mean Age (yrs) ± SD |
66.32 ± 6.65 |
50.94 ± 8.50 |
69.08 ± 7.56 |
50.04 ±13.33 |
Median PSA (ng/ml) ± SD |
9.19 ± 138.60 |
N.A |
10.10 ± 648.92 |
N.A. |
Prostate volume (ml) ± SD |
37.48 ± 17.35 |
N.A |
N.A |
N.A. |
Body mass index (kg/m2) ± SD |
24.47 ± 8.23 |
24.25 ± 3.04 |
||
Pathologic stage (n_%) |
- |
|||
pT2 |
460 (56.1) |
- |
N.A |
|
pT3a |
271 (33.0) |
- |
N.A |
|
pT3b |
79 (9.6) |
- |
N.A |
|
pT4 |
10 (1.2) |
- |
N.A |
|
Gleason score (n_%) |
- |
|||
6 |
393 (39.3) |
- |
43 (8.4) |
|
7 |
411 (41.1) |
- |
278 (54.1) |
|
8 |
138 (13.8) |
- |
86 (16.7) |
|
9 |
47 (4.7) |
- |
95 (18.5) |
|
10 |
12 (1.2) |
12 (2.3) |
Abbreviations: SD = standard deviation; PSA = prostate specific antigen
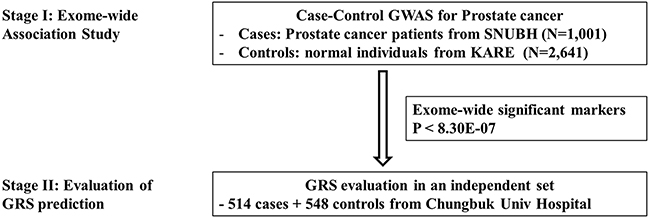
Figure 1: Overall study scheme.
Stage I Exome-wide association study
Among the 60,276 exonic SNPs that were available after the genotype QC, Table 2 shows the results of the exome-wide association with PCa. In this Korean population, the stage I association study detected 4 loci containing 5 lead variants that conferred exome-wide significance, commonly accepted as a p-value below 0.05 divided by the number of association tests (here, 0.05/60,276 ≈ 8.30E-07). The complete study results are presented in Supplementary Table 1 with markers of P < 10E-05.
Table 2: Association study results for prostate cancer that were exome-wide significant (P < 8.30 x 10⁻⁷). Results from the previous studies with genome-wide significance were presented for each SNPs.
SNP |
Korean Study (Stage I) |
Previously reported results |
||||||||
|---|---|---|---|---|---|---|---|---|---|---|
(reference/risk allele, forward) |
Gene |
Chromo-somal region |
Risk allele frequency |
OR(95%CI) |
p-value |
Genetic context |
population |
OR(95%CI) |
p-value |
|
case |
control |
|||||||||
rs1512268 (C/T) |
NKX3-1 |
8p21.2 |
0.376 |
0.306 |
1.37 (1.23-1.53) |
1.90E-08 |
Intergenic |
UK and Australia [14] |
1.18 (1.14-1.22) |
2.5x10⁻²³ |
Japanese [15] |
1.34 |
4.3x10⁻¹¹ |
||||||||
Latinos [16] |
1.21 (1.07-1.37) |
2.8x10⁻³ |
||||||||
rs1016343 (C/T) |
PRNCR1 |
8q24.21 |
0.408 |
0.306 |
1.58 (1.42-1.77) |
2.42E-16 |
Exonic |
UK and Australia [17] |
1.37 |
1x10⁻⁷ |
European [18] |
1.31 (1.20-1.42) |
4x10⁻¹⁰ |
||||||||
rs7837688 (G/T) |
CASC8 - CASC11 |
8q24.21 |
0.213 |
0.136 |
1.73 (1.51-1.98) |
2.85E-15 |
Intergenic |
Japanese [15] |
NA |
1x10-25 |
UK and Australia [17] |
1.41 |
9x10-12 |
||||||||
rs7501939* (T/C) |
HNF1B |
17q12 |
0.779 |
0.714 |
1.41 (1.25-1.61) |
2.78E-08 |
Intronic |
Japanese [15] |
NA |
1x10-12 |
European [18] |
1.19 (1.11-1.28) |
2x10⁻⁶ |
||||||||
rs2735839* (A/G) |
KLK3 |
19q13.33 |
0.677 |
0.605 |
1.31 (1.19-1.47) |
6.35E-07 |
Upstream |
UK and Australia [17] |
0.83 (0.75–0.91) |
1.5x10⁻¹⁸ |
European [18] |
1.20 (1.10-1.33) |
2x10-18 |
||||||||
Multi-ethnic [19] |
1.20 (1.13-1.28) |
2x10-18 |
||||||||
*risk allele is the major allele
At the Stage II analysis of the construction of the GRS, two SNPs (rs1456315 and rs266849) of these 5 SNPs were replaced with adjacent SNPs (rs1016343 and rs2735839) with high LD (r > 0.9) and meaningful signal (p<10E-05), because analysis of the two SNPs failed in the Stage II samples. Three SNPs were located in 8q21-24, one in 17q12 and one in 19q13.33. All five of the hits reside at or nearby the genes that were previously identified by GWA studies; e.g., NK3-1, PRNCR1, CASC8/11, HNF1B, and KLK3 (presented in Table 2) [14-19]. The QQ plot (Supplementary Figure 1) suggested that inflation by type I errors from any cause were unlikely (inflation factor, λ=0.92 by genomic control analysis). The Manhattan plot for our analysis for PCa susceptibility loci testing the additive effects of each SNP are presented in Figure 2. Supplementary Figure 2 presents a regional plot with the LD structure for the chromosomal region 8q24.21. As indicated in the figure, the two SNPs in the 8q24.21 region were in different LD blocks.
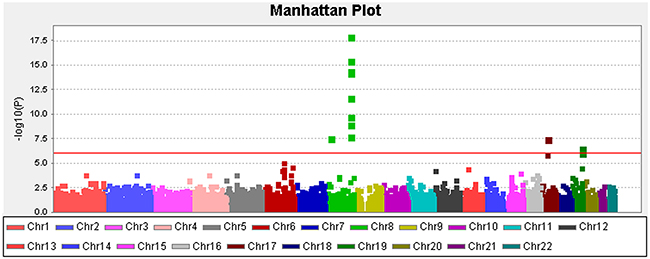
Figure 2: Manhattan plot depicting the Stage I results of the exome-wide association study. Y-axis: -log10(p-value); X-axis: genomic position. The solid red line shows the study-specific exome-wide significance level at a p-value of 8.30E-07.
GRS for PCa risk prediction
When we used the sum of the number of risk alleles as the GRS, the distribution of the GRS followed a normal distribution (Figure 3) with a mean score of 4.23 ± 1.44 for the controls and 4.78 ± 1.43 for the cases. The GRS was associated with an increased PCa risk for the Stage II samples from the Chungbuk University Hospital (cases n=514 and controls n=548); taking the group with a GRS=4 as a reference, the higher GRS group showed an increase and the lower GRS group showed a decrease in PCa risk. A GRS score above 6 showed a statistically significant risk of PCa; OR=1.85, 95%CI [1.28, 2.69], OR 2.11, 95%CI [1.26, 3.53] and OR 3.34, 95%CI [1.05, 10.62] for the groups with GRS=6, 7, and 8 or above, respectively (Figure 4). The trend of an increase in PCa risk according to the increase in GRS is very strong (p<0.0001, test for trend), and the risk for the highest GRS group (GRS>=8) compared with the lowest group (GRS<=1) was estimated to be increased more than 10-fold.
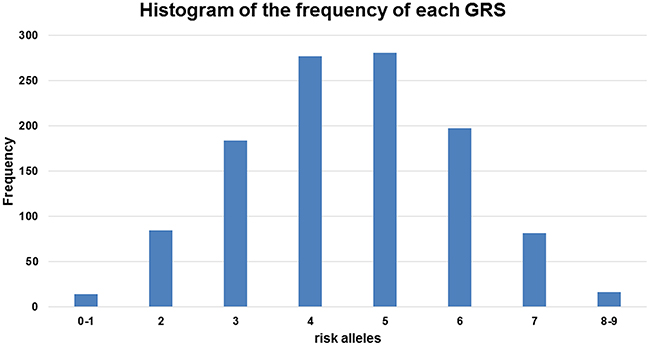
Figure 3: Frequency distribution across the genetic risk score (GRS) groups. The histogram is plotted on the x-axis representing each GRS category as the sum of the risk alleles across the five loci, and the y-axis plots the number of individuals in each GRS category.
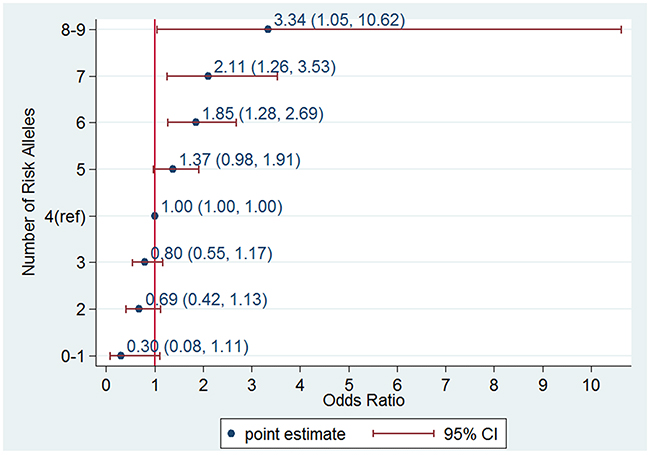
Figure 4: Odds ratio (OR) of prostate cancer according to genetic risk score (GRS) category in an independent data set consisting of 514 cases and 548 controls from the Chungbuk University Hospital. An allele dosage category of 4 was used as a reference group.
When the predictive performance of the GRS was evaluated using a receiver operating curve function, the area under the curve (AUC) obtained was 0.605 with a 95% CI ranged from 0.573 to 0.637 (Supplementary Figure 3).
DISCUSSION
This is the first GWAS on PCa susceptibility in a Korean population. PCa is one of the most rapidly increasing cancers for Korean men over the past two decades. The incidence rate of PCa in Korea, however, is still lower than that of Caucasians or Africans, being 26.2 out of 100,000 person-year. Whether it is genes or the environment that contributes to this gap has been elusive. Our findings that all 5 lead genetic variants associated with PCa are replicated SNPs, support for genetic similarities, rather than differences. Interestingly, with only five markers the overall predictive value of the GRS was same as the PLCO study findings with 30 markers [20]. Emphasis on etiologic similarities of PCa over differences are equivalent with that for breast cancer [21]. Our findings suggest that it might be reasonable to expect that the epidemiology of PCa in Korea and probably in many East Asian populations would follow that of the populations with higher PCa incidence rates.
All 5 SNPs with exome-wide significance at the Stage I study were replicates of previous studies. Though the HumanExome BeadChip array targets the exome and rare variants, it inclusively contains GWAS tag SNPs and common variants grid where the detected SNPs fall into. All 5 susceptibility loci had been reported in European studies, and 3 loci were from other Asian studies. The effect size of the risk alleles was generally higher in this study than the previous findings. It is noteworthy that the larger effect size in the Korean population is statistically significant for two SNPs (rs1016343 and rs7837688) in the 8q24.21 region compared with other studies. These two SNPs in the 8q24.21 region are more common in Koreans or East Asians, whereas the other SNPs in GRS, showed lower frequencies in Koreans than those in Europeans or African ancestries. Variations in allele frequency across the population for these 5 susceptibility loci were relatively large, and the major/minor alleles were reversed for some of the SNPs. For example, for rs1512268 and rs7501939, the ancestral (major) alleles in African ancestry (both T allele) consist only 0.3 for Asians making these wild type as minor alleles. Considering the effect size and their allele frequencies of the susceptibility loci across the population, it is not likely that Korean men are genetically less susceptible to PCa. Our findings suggest that the current gap in the PCa occurrence across populations would be gradually reduced. The 8q24 region is currently considered the most important susceptibility region for PCa, accounting for about 8% of the two-fold increase in risk observed in first degree relatives [22]. The variants in this region spread across three haplotype blocks (Supplementary Figure 2) and probably contribute independently to PCa risk [22-25]. The 8q24 region is a gene “desert” with only a few predicted non-coding genes. The closest annotated protein coding gene, proto-oncogene MYC, is over 200 kb downstream from the nearest PCa risk variant. Multiple lines of evidence indicate that the 8q24 risk locus exhibits minimal RNA transcriptional output [26] and contains regulatory elements, especially enhancers [27].
Recently, functional roles of long non-coding RNAs (lncRNAs) have been suggested for PCa development; through epigenetic regulations/progression [28-30]. In the 8q24 region PRNCR1 is one of the highly expressed lncRNA genes reported in aggressive PCa cases. PRNCR1 is known to be associated with androgen receptor (AR)-related gene activation in prostate tumor tissues [31].
Currently, genetic data based prognostic biomarkers are available in PCa clinics notably Prolaris®, Decipher® and Oncotype Dx®, [32]. As of the year 2016, the established SNPs were estimated to explain 33% of the familial risk of PCa. [11]. Eeles et al showed that by using a polygenic risk score consisting of 68 SNPs associated with PCa men in the top 1% of the risk distribution have more than a four-fold increased risk for PCa compared with those with an average risk [33]. In our study, we recruited the Stage II case-control study to estimate the predictive value of the susceptibility loci. The highest GRS score group (GRS>=8) consisted of 2% (12 out of 586) of the cases and 0.7% of the controls (4 out of 548), and the increase in the PCa risk was 3.34 compared with those with average GRS scores. The predictive values of the risk loci from our study are largely compatible with other studies. A recent report suggested a possible application of this predictive ability to clinical practice. A polygenic risk score, including 35 established PCa risk SNPs, was recently shown to decrease the number of biopsies by 23% at a cost of 3% fewer cases detected in a Swedish cohort of men that underwent a biopsy of the prostate [34]. The discriminative power of the GRS in this study during the Stage II study was estimated to be 0.605. Even with the modest sample size, the risk size according to the GRS or the predictive value was compatible with other large studies, and our findings might potentially be applied for preventive measures.
Although this is the first report of a genomic association study of PCa in Korea, we admit some limitations. First, our study involved relatively modest number of cases which might have resulted in limited statistical power. We believe some loci that were previously replicated may have been missed out, and more importantly no new variants were found exceeding the exome-wide significance mainly because of this limited statistical power. In the same vein, all five GRS SNPs in this study used in order to predict prostate cancer risk were relatively common variants, not rare functional variants included in the Exome Array chip design. Second, the Stage II study analyzed selected SNPs to validate the predictive value of the Stage I findings, and thus, an official meta-analysis at a genome-wide scale was not possible. Third, the control groups were selected from a population-based cohort study, and the age of the controls was generally younger. It is unlikely, however, that the findings in this study were confounded by this age difference because genotypes are known to be randomly distributed, and the susceptibility loci in this study represent alleles that have significantly different distributions between populations and PCa patients.
In conclusion, we detected 5 risk variants for PCa in a Korean population, which were confirmed in many previously reported findings. Our findings suggest that similarities, rather than differences, in genetic susceptibilities might be a more important aspect across populations, but the impacts from the differences in the effect size, the allele frequency, and the LD block structure should be investigated further to elucidate the genetic cause of PCa. The addition of individualized calculated GRS effectively enhanced the accuracy of prediction. These results need to be validated in future studies.
PATIENTS AND METHODS
Ethics statement
This study was approved by our institutional review board (Seoul National University Bundang Hospital Institutional review board; IRB number, B-1312/232-302) and followed the rules stated in the Declaration of Helsinki. All participants provided written informed consent.
Study design and populations
Our study was performed in a two-stage design as depicted in Figure 1. In Stage I, 1,001 PCa samples and 2,641 population controls were used to find the associated markers in the Korean population and examine the previously identified GWAS SNPs in the different ethnic populations. In Stage II, the GRS was calculated based on the validated SNPs from Stage I in order to determine its discriminative ability in an independent set of cases and controls.
For Stage I, we used the data from 988 PCa patients enrolled and treated in the Seoul National University Bundang Hospital from November 2003 to July 2013, and 2,641 controls from the Korean Association Resource (KARE) study as part of the Korean Genome and Epidemiology Study (KoGES). For all of the patients included in Stage I, blood specimens were prospectively collected throughout the course of the study, and serum PSA, clinical stages, biopsies Gleason scores, numbers of positive cores, and the pathological outcome data were recorded. Transrectal ultrasound-guided multi-core (≥12) biopsies were performed using an automatic firing mechanism. The collected prostate tissue samples were biopsied bilaterally near the base, mid-gland, and apex, with at least six biopsies per side. A total of 12 baseline biopsy cores were taken in all of the men, and additional biopsies of suspicious lesions were obtained if needed. Among the PC patients, 820 patients underwent RP in same hospital. All biopsy and RP specimens were analyzed by a single genitourinary pathologist. The controls were selected from 10,038 people total in the 40-69 years old residing in the cities of Ansung and Ansan recruited in 2001 through 2002. More detailed information about the study is available in a previously published article [35].
For the Stage II GRS evaluation, 516 cases and 548 controls were recruited from a tertiary institution, The Chungbuk University Hospital. The diagnosis of PCa was the same as described for the Stage I.
Exome chip and quality control in stage I (GWAS)
The Stage I Exome-based discovery study was conducted using the HumanExome BeadChip 12v1-1 system (Illumina, Inc.; San Diego, CA), which includes 242,901 probes focused on protein-altering variants (non-synonymous, stop and splice) selected from exome and whole-genome sequences [36, 37]. Details about SNP content and selection strategies can be found at the exome array design webpage (http://genome.sph.umich.edu/wiki/Exome_Chip_Design). Genotype calling was performed using Illumina’s GenTrain version 2.0 clustering algorithm with the GenomeStudio software (V2011.1). Cluster boundaries were determined using Illumina’s standard cluster file. To improve the accuracy of variant calling, manual reclustering and visual inspection were conducted for genotypes based on the CHARGE clustering method [36]. Sample quality control was carried out to exclude samples with genotyping rates < 95%, heterozygosity, and cryptic relatedness. Markers were excluded based on the following criteria: 1) monomorphic in our samples, 2) missing call rate > 5%, 3) significant deviation from the Hardy-Weinberg equilibrium (P < 1.0 × 10⁻⁶). The 988 case and 2,641 control subjects and 60,276 variants remained after quality control were taken forward for subsequent analysis.
Genotyping for de novo replication
To have more numbers of loci available to choose from when selecting sets of informative markers for the GRS construction with exome-wide significant lead markers, at first, 5 exome-wide significant lead SNPs (P < 1.0 × 10⁻⁴) from the Stage I were selected to genotype in the Chungbuk samples for the replication. The genotyping of these SNPs was performed using the Fluidigm 192.24 Dynamic Array TM IFC and Biomark HD systems. Duplicates and negative controls were included in each 96-well plate for quality control. Technicians blinded to the sample status performed the genotyping. The average concordance rate between the duplicate samples was >99%.
GRS construction and risk assessment
To construct a GRS using PCa susceptibility loci, we considered the five exome-wide significant lead SNPs (P < 8.30 × 10⁻⁷) from each LD block which were also previously validated within the other ethnic groups. The cumulative number of risk alleles was calculated using an additive model (0 for homozygous of non-risk alleles, 1 for heterozygous of alleles and 2 for homozygous of the risk alleles for each SNP). The GRS was calculated by a non-weighted sum of the risk allele counts (non-weighted GRS), because the model with non-weighed GRS showed better model fitting than that with odds raio-weighted GRS in the initial explanatory model. Then, we obtained estimates of the area under the receiver-operating characteristic curve (AUC) to evaluate its discriminative ability in an independent set of cases and controls from the Chungbuk University Hospital.
Statistical analysis
Single-variant association tests were analyzed using EPACTS v3.2.4 (http://genome.sph.umich.edu/wiki/EPACTS), PLINK (http://zzz.bwh.harvard.edu/plink/) and SAS programs (version 9.1; SAS institute Inc., Cary, NC, USA). The data were analyzed using an unconditional logistic regression to calculate an odds ratio (OR) as an estimate of the relative risk of PCa susceptibility with the SNP genotypes. For multiple comparisons, a statistically significant threshold (P < 8.30 × 10⁻⁷) was used based on the Bonferroni correction.
ACKNOWLEDGMENTS STATEMENT
This work is supported by grant no SNUBH-02-2016-015 from the SNUBH (Seoul National University Bundang Hospital) Research Fund, Basic Science Research Program through the National Research Foundation of Korea (NRF) funded by the Ministry of Education (2015R1D1A1A09061013), The International Science and Business Belt Program through the Ministry of Science, ICT and Future Planning (2016K000297) and Post-Genome Technology Development Program (10050164, Developing Korean Reference Genome (funded by the Ministry of Trade, Industry & Energy (MOTIE, Korea).
CONFLICTS OF INTEREST
The authors have no conflicts of interest with any institution or product.
REFERENCES
1. Siegel R, Ma J, Zou Z, Jemal A. Cancer statistics, 2014. CA Cancer J Clin. 2014; 64:9-29.
2. Jemal A, Bray F, Center MM, Ferlay J, Ward E, Forman D. Global cancer statistics. CA Cancer J Clin. 2011; 61:69-90.
3. Wang M, Takahashi A, Liu F, Ye D, Ding Q, Qin C, Yin C, Zhang Z, Matsuda K. Large-scale association analysis in Asians identifies new susceptibility loci for prostate cancer. 2015; 6:8469.
4. Eeles R, Goh C, Castro E, Bancroft E, Guy M, Al Olama AA, Easton D, Kote-Jarai Z. The genetic epidemiology of prostate cancer and its clinical implications. Nat Rev Urol. 2014; 11:18-31.
5. Panagiotou OA, Travis RC, Campa D, Berndt SI, Lindstrom S, Kraft P, Schumacher FR, Siddiq A, Papatheodorou SI, Stanford JL, Albanes D, Virtamo J, Weinstein SJ, et al. A genome-wide pleiotropy scan for prostate cancer risk. Eur Urol. 2015; 67:649-657.
6. Al Olama AA, Kote-Jarai Z, Berndt SI, Conti DV, Schumacher F, Han Y, Benlloch S, Hazelett DJ, Wang Z, Saunders E, Leongamornlert D. A meta-analysis of 87,040 individuals identifies 23 new susceptibility loci for prostate cancer. 2014; 46:1103-1109.
7. Amin Al Olama A, Kote-Jarai Z, Schumacher FR, Wiklund F, Berndt SI, Benlloch S, Giles GG, Severi G, Neal DE, Hamdy FC, Donovan JL, Hunter DJ, Henderson BE, et al. A meta-analysis of genome-wide association studies to identify prostate cancer susceptibility loci associated with aggressive and non-aggressive disease. Hum Mol Genet. 2013; 22:408-415.
8. Amin Al Olama A, Dadaev T, Hazelett DJ, Li Q, Leongamornlert D, Saunders EJ, Stephens S, Cieza-Borrella C, Whitmore I, Benlloch Garcia S, Giles GG, Southey MC, Fitzgerald L, et al. Multiple novel prostate cancer susceptibility signals identified by fine-mapping of known risk loci among Europeans. Hum Mol Genet. 2015; 24:5589-5602.
9. Little J, Wilson B, Carter R, Walker K, Santaguida P, Tomiak E, Beyene J, Usman Ali M, Raina P. Multigene panels in prostate cancer risk assessment: a systematic review. Genet Med. 2015.
10. Amin Al Olama A, Benlloch S, Antoniou AC, Giles GG, Severi G, Neal DE, Hamdy FC, Donovan JL, Muir K, Schleutker J, Henderson BE, Haiman CA, Schumacher FR, et al. Risk Analysis of Prostate Cancer in PRACTICAL, a Multinational Consortium, Using 25 Known Prostate Cancer Susceptibility Loci. Cancer Epidemiol Biomarkers Prev. 2015; 24:1121-1129.
11. Szulkin R, Whitington T, Eklund M, Aly M, Eeles RA, Easton D, Kote-Jarai ZS, Amin Al Olama A, Benlloch S, Muir K, Giles GG, Southey MC, Fitzgerald LM, et al. Prediction of individual genetic risk to prostate cancer using a polygenic score. Prostate. 2015; 75:1467-1474.
12. Klein EA, Cooperberg MR, Magi-Galluzzi C, Simko JP, Falzarano SM, Maddala T, Chan JM, Li J, Cowan JE, Tsiatis AC, Cherbavaz DB, Pelham RJ, Tenggara-Hunter I, et al. A 17-gene assay to predict prostate cancer aggressiveness in the context of Gleason grade heterogeneity, tumor multifocality, and biopsy undersampling. Eur Urol. 2014; 66:550-560.
13. Klein EA, Haddad Z, Yousefi K, Lam LL, Wang Q, Choeurng V, Palmer-Aronsten B, Buerki C, Davicioni E, Li J, Kattan MW, Stephenson AJ, Magi-Galluzzi C. Decipher Genomic Classifier Measured on Prostate Biopsy Predicts Metastasis Risk. Urology. 2016; 90:148-152.
14. Eeles RA, Kote-Jarai Z, Al Olama AA, Giles GG, Guy M, Severi G, Muir K, Hopper JL, Henderson BE, Haiman CA, Schleutker J, Hamdy FC, Neal DE, et al. Identification of seven new prostate cancer susceptibility loci through a genome-wide association study. Nat Genet. 2009; 41:1116-1121.
15. Takata R, Akamatsu S, Kubo M, Takahashi A, Hosono N, Kawaguchi T, Tsunoda T, Inazawa J, Kamatani N, Ogawa O, Fujioka T, Nakamura Y, Nakagawa H. Genome-wide association study identifies five new susceptibility loci for prostate cancer in the Japanese population. Nat Genet. 2010; 42:751-754.
16. Cheng I, Chen GK, Nakagawa H, He J, Wan P, Laurie CC, Shen J, Sheng X, Pooler LC, Crenshaw AT, Mirel DB, Takahashi A, Kubo M, et al. Evaluating genetic risk for prostate cancer among Japanese and Latinos. Cancer Epidemiol Biomarkers Prev. 2012; 21:2048-2058.
17. Eeles RA, Kote-Jarai Z, Giles GG, Olama AA, Guy M, Jugurnauth SK, Mulholland S, Leongamornlert DA, Edwards SM, Morrison J, Field HI, Southey MC, Severi G, et al. Multiple newly identified loci associated with prostate cancer susceptibility. Nat Genet. 2008; 40:316-321.
18. Schumacher FR, Berndt SI, Siddiq A, Jacobs KB, Wang Z, Lindstrom S, Stevens VL, Chen C, Mondul AM, Travis RC, Stram DO, Eeles RA, Easton DF, et al. Genome-wide association study identifies new prostate cancer susceptibility loci. Hum Mol Genet. 2011; 20:3867-3875.
19. Hoffmann TJ, Van Den Eeden SK, Sakoda LC, Jorgenson E, Habel LA, Graff RE, Passarelli MN, Cario CL, Emami NC, Chao CR, Ghai NR, Shan J, Ranatunga DK, et al. A large multiethnic genome-wide association study of prostate cancer identifies novel risk variants and substantial ethnic differences. Cancer Discov. 2015; 5:878-891.
20. Liss MA, Xu J, Chen H, Kader AK. Prostate genetic score (PGS-33) is independently associated with risk of prostate cancer in the PLCO trial. Prostate. 2015; 75:1322-1328.
21. Sung H, Rosenberg PS, Chen WQ, Hartman M, Lim WY, Chia KS, Wai-Kong Mang O, Chiang CJ, Kang D, Ngan RK, Tse LA, Anderson WF, Yang XR. Female breast cancer incidence among Asian and Western populations: more similar than expected. J Natl Cancer Inst. 2015; 107.
22. Al Olama AA, Kote-Jarai Z, Giles GG, Guy M, Morrison J, Severi G, Leongamornlert DA, Tymrakiewicz M, Jhavar S, Saunders E, Hopper JL, Southey MC, Muir KR, et al. Multiple loci on 8q24 associated with prostate cancer susceptibility. Nat Genet. 2009; 41:1058-1060.
23. Ghoussaini M, Song H, Koessler T, Al Olama AA, Kote-Jarai Z, Driver KE, Pooley KA, Ramus SJ, Kjaer SK, Hogdall E, DiCioccio RA, Whittemore AS, Gayther SA, et al. Multiple loci with different cancer specificities within the 8q24 gene desert. J Natl Cancer Inst. 2008; 100:962-966.
24. Haiman CA, Patterson N, Freedman ML, Myers SR, Pike MC, Waliszewska A, Neubauer J, Tandon A, Schirmer C, McDonald GJ, Greenway SC, Stram DO, Le Marchand L, et al. Multiple regions within 8q24 independently affect risk for prostate cancer. Nat Genet. 2007; 39:638-644.
25. Gudmundsson J, Sulem P, Gudbjartsson DF, Masson G, Agnarsson BA, Benediktsdottir KR, Sigurdsson A, Magnusson OT, Gudjonsson SA, Magnusdottir DN, Johannsdottir H, Helgadottir HT, Stacey SN, et al. A study based on whole-genome sequencing yields a rare variant at 8q24 associated with prostate cancer. Nat Genet. 2012; 44:1326-1329.
26. Pomerantz MM, Beckwith CA, Regan MM, Wyman SK, Petrovics G, Chen Y, Hawksworth DJ, Schumacher FR, Mucci L, Penney KL, Stampfer MJ, Chan JA, Ardlie KG, et al. Evaluation of the 8q24 prostate cancer risk locus and MYC expression. Cancer Res. 2009; 69:5568-5574.
27. Meyer KB, Maia AT, O’Reilly M, Ghoussaini M, Prathalingam R, Porter-Gill P, Ambs S, Prokunina-Olsson L, Carroll J, Ponder BA. A functional variant at a prostate cancer predisposition locus at 8q24 is associated with PVT1 expression. PLoS Genet. 2011; 7:e1002165.
28. Weiss M, Plass C, Gerhauser C. Role of lncRNAs in prostate cancer development and progression. Biol Chem. 2014; 395:1275-1290.
29. Sun T, Ye H, Wu CL, Lee GS, Kantoff PW. Emerging players in prostate cancer: long non-coding RNAs. Am J Clin Exp Urol. 2014; 2:294-299.
30. Su YJ, Yu J, Huang YQ, Yang J. Circulating Long Noncoding RNA as a Potential Target for Prostate Cancer. Int J Mol Sci. 2015; 16:13322-13338.
31. Yang L, Lin C, Jin C, Yang JC, Tanasa B, Li W, Merkurjev D, Ohgi KA, Meng D, Zhang J, Evans CP, Rosenfeld MG. lncRNA-dependent mechanisms of androgen-receptor-regulated gene activation programs. Nature. 2013; 500:598-602.
32. Bostrom PJ, Bjartell AS, Catto JW, Eggener SE, Lilja H, Loeb S, Schalken J, Schlomm T, Cooperberg MR. Genomic Predictors of Outcome in Prostate Cancer. Eur Urol. 2015; 68:1033-1044.
33. Eeles RA, Olama AA, Benlloch S, Saunders EJ, Leongamornlert DA, Tymrakiewicz M, Ghoussaini M, Luccarini C, Dennis J, Jugurnauth-Little S, Dadaev T, Neal DE, Hamdy FC, et al. Identification of 23 new prostate cancer susceptibility loci using the iCOGS custom genotyping array. Nat Genet. 2013; 45:385-391, 391e381-382.
34. Aly M, Wiklund F, Xu J, Isaacs WB, Eklund M, D’Amato M, Adolfsson J, Gronberg H. Polygenic risk score improves prostate cancer risk prediction: results from the Stockholm-1 cohort study. Eur Urol. 2011; 60:21-28.
35. Cho YS, Go MJ, Kim YJ, Heo JY, Oh JH, Ban HJ, Yoon D, Lee MH, Kim DJ, Park M, Cha SH, Kim JW, Han BG, et al. A large-scale genome-wide association study of Asian populations uncovers genetic factors influencing eight quantitative traits. Nat Genet. 2009; 41:527-534.
36. Grove ML, Yu B, Cochran BJ, Haritunians T, Bis JC, Taylor KD, Hansen M, Borecki IB, Cupples LA, Fornage M, Gudnason V, Harris TB, Kathiresan S, et al. Best practices and joint calling of the HumanExome BeadChip: the CHARGE Consortium. PLoS One. 2013; 8:e68095.
37. Huyghe JR, Jackson AU, Fogarty MP, Buchkovich ML, Stancakova A, Stringham HM, Sim X, Yang L, Fuchsberger C, Cederberg H, Chines PS, Teslovich TM, Romm JM, et al. Exome array analysis identifies new loci and low-frequency variants influencing insulin processing and secretion. Nat Genet. 2013; 45:197-201.