
INTRODUCTION
Cancer is now becoming the leading cause of death in both developed and developing countries [1]. Digestive system malignant tumors occupy most of the all-cancer incidence and mortality, with 3.4 million new diagnosed cases and 1.5 million deaths each year [2]. The prognosis of patients with digestive system malignancies were unfavorable. Effective and accessible clinical biomarkers were urgently required for the prognosis prediction of patients with digestive system malignant tumors, since there was still no specific and accepted biomarker for this kind tumors.
LncRNAs were defined as non-protein coding RNAs with the length of more than 200 nucleotides. LncRNAs account for more than 80% of the entire genome transcripts [3]. Over the past decades, lncRNAs were always considered as transcriptions of “noise” or clonal artifacts [4]. Nowadays, more and more evidences showed that lncRNAs were closely associated with diverse biological processes [5–6]. Noteworthily, lncRNAs could be acted as oncogenes or tumor suppressors in cancers, such as HOTAIR, H19, MEG3 and TUSC7 [7–11].
Urothelial carcinoma associated 1 (UCA1) was a novel lncRNA gene with three exons and two introns, which is located in the chromosome 19p13.12. The lncRNA UCA1 was firstly discovered to be up-expressed in the carcinogenesis of bladder cancer in 2006 [12]. In recent years, increasing studies have reported that UCA1 was over-expressed in various cancers and UCA1 played important roles in the occurrence and development of human cancers [13–15]. In addition, many studies suggested that the expression of UCA1 was also related to prognosis of digestive system carcinomas [16–18]. These findings implied that UCA1 could be exploited as a potential biomarker for digestive system malignancies. However, until now, no specific meta-analysis was reported for assessing the prognostic value of UCA1 in digestive system carcinomas. Therefore, we performed this current comprehensive meta-analysis to evaluate the association between UCA1 expression level and prognosis in patients with digestive system cancers. The clinicopathological value of UCA1 was further analyzed in esophageal carcinoma, colorectal carcinoma and pancreatic carcinoma.
RESULTS
Literature search and study characteristics
According to the criteria for selection mentioned above, after carefully screening the abstract and full-text of these references, finally, 14 publications (including 15 studies) [16–29] were identified as eligible for the present quantitative analysis of the prognostic value of UCA1 in digestive system cancers. All included publications were written in English. The detailed selection steps were shown (Figure 1).
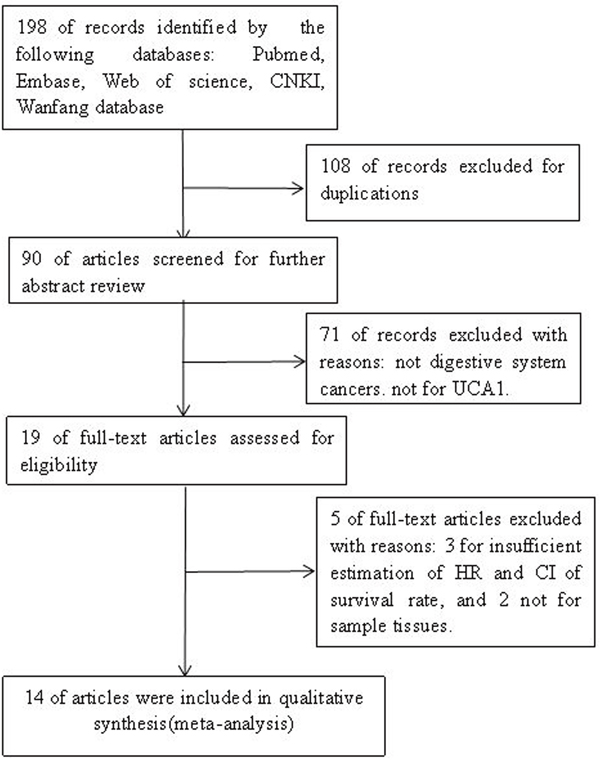
Figure 1: The steps for screening eligible publications.
A total of 1441 patients with survival data were included in this meta-analysis, the mean sample size was 96.07, with a maximum number of 240 and a minimum sample size of 20. Among the fifteen studies, six studies were about colorectal cancer [16, 19, 21, 24, 27], three studies were about gastric cancer [22, 25], two studies were about pancreatic cancer [26, 28], two studies were about hepatocellular carcinoma [20, 23], two studies were about esophageal carcinoma [17, 29]. The cancer cases in the included studies were all Asians (14 for Chinese, 1 for Koreans). The accrual period of 15 studies was ranged from 2014 to 2016. The participants in all the studies were categorized into high UCA1 expression group and low UCA1 expression group. The main characteristics were summarized (Table 1).
Table 1: Main characteristics of all studies included in the meta-analysis
First author, Year |
Country |
Cancer type |
Sample |
Tumor stage |
Follow-up |
AT |
Cut-off value |
Detection |
Survival |
Multivariate |
NOS score |
|---|---|---|---|---|---|---|---|---|---|---|---|
Han Y, 2014 [16] |
China |
CRC |
80 |
I-IV |
Mean 42.6 |
NA |
mean expression |
qRT-PCR |
OS |
no |
7 |
Li JY, 2014 [17] |
China |
EC |
90 |
I-IV |
median 43 |
None |
mean expression |
qRT-PCR |
OS |
yes |
8 |
Gao JF, 2015 [18] |
China |
GC |
20 |
I-IV |
NA |
None |
NA |
qRT-PCR |
OS |
yes |
6 |
Tao K, 2015 [19] |
China |
CRC |
80 |
I-IV |
Over 60 |
None |
the fourth quartile |
qRT-PCR |
OS |
yes |
8 |
Wang F, 2015 [20] |
China |
HCC |
98 |
I-IV |
Over 60 |
None |
median expression |
qRT-PCR |
OS |
yes |
8 |
Ni BB, 2015 [21] |
China |
CRC |
54 |
I-IV |
Over 50 |
NA |
median expression |
qRT-PCR |
OS |
yes |
7 |
Zheng Q, 2015 [22] |
China |
GC |
112 |
I-IV |
Over 60 |
None |
median expression |
qRT-PCR |
OS,DFS |
yes |
8 |
Yang Z, 2015 [23] |
Korea |
HCC |
240 |
I-IV |
Over 60 |
None |
median expression |
NA |
OS,DFS |
OS-no. |
8 |
Bian ZH-1, 2016 [24] |
China |
CRC |
90 |
I-IV |
Over 60 |
NA |
median expression |
qRT-PCR |
OS |
yes |
7 |
Bian ZH-2, 2016 [24] |
China |
CRC |
105 |
I-IV |
Over 60 |
NA |
median expression |
qRT-PCR |
OS |
no |
7 |
Shang C, 2016 [25] |
China |
GC |
77 |
Borrmann type I-IV |
Over 60 |
None |
NA |
qRT-PCR |
DFS |
yes |
8 |
Chen P, 2016 [26] |
China |
PC |
128 |
I-IV |
1-60 |
None |
mean expression |
qRT-PCR |
OS |
yes |
9 |
Jiang H, 2016 [27] |
China |
CRC |
121 |
I-IV |
1-60 |
None |
median expression |
qRT-PCR |
OS |
yes |
8 |
Fu XL, 2016 [28] |
China |
PC |
80 |
I-IV |
Over 40 |
None |
median expression |
qRT-PCR |
OS |
yes |
8 |
Jiao C, 2016 [29] |
China |
EC |
66 |
I–III |
1-30 |
NA |
median expression |
qRT-PCR |
OS |
no |
6 |
CRC: colorectal cancer; EC: esophageal carcinoma; PC: pancreatic cancer; HCC: hepatocellular carcinoma; GC: gastric cancer; OS: overall survival; DFS: disease-free survival; qRT-PCR: quantitative real-time-polymerase chain reaction; AT: adjuvant therapy before surgery; NA: not available.
Prognostic value of UCA1 in digestive system cancers
UCA1 expression and overall survival(OS) in digestive system cancers
There was a total of 14 studies reporting the OS of 1364 patients per UCA1 expression levels [16–24, 26–29]. Because heterogeneity analysis showed no severe heterogeneity between studies, the fixed-effects model was applied in the meta-analysis (P = 0.995, I2 = 0.0 %). Overall, the pooled results confirmed that there was a significant association between high UCA1expression and poor OS in digestive system cancer (HR: 1.89, 95 % CI: 1.52–2.26, p<= 0.001) (Figure 2A).
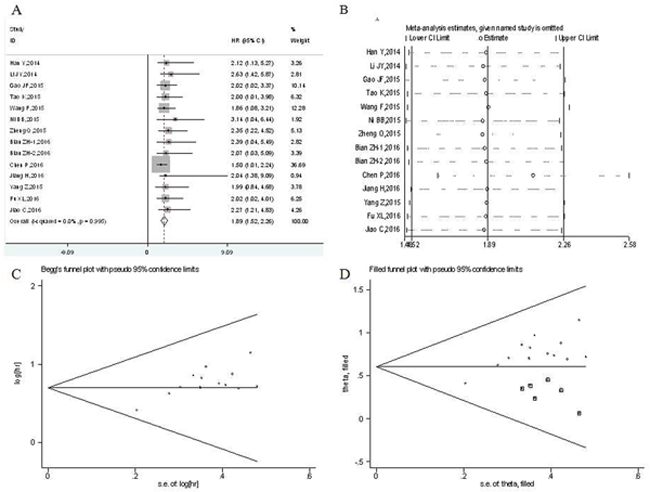
Figure 2: Meta-analysis of the pooled hazard ratios (HRs) of overall survival of patients with high UCA1 expression level in digestive system malignancies. (A) Forest plot of HR for the relationship between increased UCA1 expression and OS. (B) Sensitivity analysis. (C) Begg’s funnel plot. (D) Filled funnel plot of meta-analysis with “trim-and-fill” method. ○ indicated observed studies; ◘ indicated missed studies.
Although there was no significant between-studies heterogeneity, the subgroup meta-analysis was conducted on the tumor type, country, histology type, analysis type, sample size and cut-off value (Table 1). From the subgroup results, we found that UCA1 was a significant prognostic indicator of OS for patients with esophageal cancer (HR: 2.41, 95 % CI: 1.01-3.82, p<= 0.001), gastric cancer (HR: 2.13, 95 % CI: 1.17-3.09, p<= 0.001), colorectal cancer (HR: 2.21, 95 % CI: 1.35–3.08, p<= 0.001), pancreatic cancer (HR: 1.58, 95 % CI: 1.01–2.15, p<= 0.001). A strong association was also showed in hepatocellular carcinoma (HR:1.89, 95 % CI: 0.96–2.82, p<= 0.001). Additionally, we detected a significant relationship between UCA1 expression and OS of patients with digestive system malignant tumors in China (HR: 1.89, 95 % CI: 1.50-2.27, p<= 0.001). UCA1 expression was found to be significantly associated with OS of patients with nonsquamous cell carcinoma (HR: 1.87, 95 % CI: 1.49–2.25, p<= 0.001). UCA1 was found to be significantly associated with OS of patients in studies reported in multivariate analysis (HR: 1.85, 95 % CI: 1.45–2.25, p<= 0.001) and non-multivariate analysis (HR: 2.12, 95 % CI: 1.14-3.09, p<= 0.001). The association between UCA1 and OS of patients was significant in studies with sample size both equal or greater than 100 (HR: 1.67, 95 % CI: 1.15-2.20, p<= 0.001) and less than 100 (HR: 2.10, 95 % CI: 1.57-2.63, p<= 0.001). Furthermore, a significant relationship between UCA1 and OS of patients was observed in both studies with the median value as cutoff (HR: 2.12 95 % CI: 1.53–2.70, p<= 0.001) and studies with the mean value as cutoff (HR: 1.62, 95 % CI: 1.05-2.19, p<= 0.001).
The sensitivity analysis was performed to assess the stability of the results by removing each study in turn. The result indicated that meta-analysis results didn’t not change significantly (Figure 2B), which suggesting the robustness of the results. We assess the publication bias by the Begg’s funnel plot and Egger’s test. However, the shapes of funnel plot were asymmetric (Figure 2C), and publication bias was significant by Begg’s test (z = 1.53, P = 0.125) and Egger’s test (t[bias] = 4.51, P = 0.001). Nonparametric “trim-and-fill” method was used to replace six missing studies (Figure 2D). After the trim-and-fill adjustment, the estimated pooled HR was 1.823, with 95 % CI being 1.563–2.126 (p<= 0.001).
Independent prognostic value of UCA1 for OS in digestive system cancers
A total of 10 studies conducted the cox multivariate analysis to explore whether UCA1 was an independent predictive factor for OS of patients with digestive system malignancies [17–22, 24, 26–68]. There was no significant heterogeneity existing among studies (P= 0.950, I2= 0.0%), the fixed-effects model was utilized to combine the hazard ratios (HRs) with corresponding 95 % CI. The pooled meta-analysis confirmed that high UCA1 expression was a significant independent predictor of poor OS in digestive system malignancies (HR: 1.85, 95 % CI: 1.45–2.25, p<= 0.001) (Figure 3A). The patients detected with elevated UCA1 expression were more likely to have significantly shorter OS.
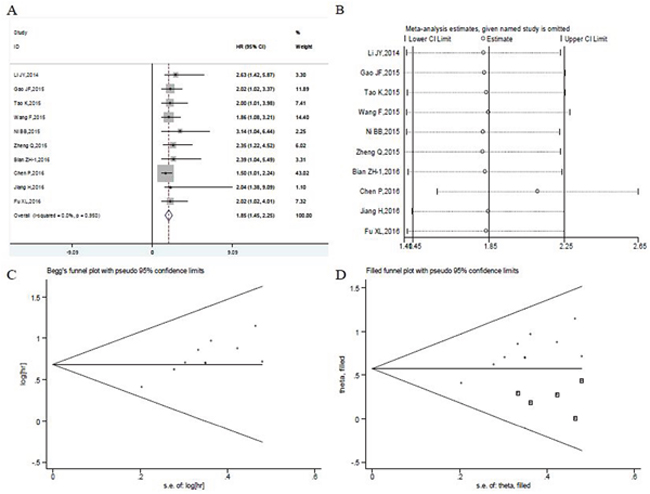
Figure 3: Meta-analysis of the independent predictive value of UCA1 for overall survival of patients with digestive system malignancies. (A) Forest plots of meta-analysis. (B) Sensitivity analysis. (C) Begg’s funnel plot. (D) Filled funnel plot of meta-analysis with “trim-and-fill” method. ○ indicated observed studies; ◘ indicated missed studies.
Moreover, the pooled HR values > 1 were consistently calculated in subgroup meta-analysis stratified by the tumor type, histology type, sample size and cut-off value, which still had statistical significance (Table 3). The subgroup analysis showed the above factors did not alter the predictive value of UCA1 as an independent factor for OS of patients with digestive system malignancies. And no obvious heterogeneity was observed in subgroup analysis of studies looking at the independent role of UCA1 (Table 3).
Table 2: Results of subgroup analysis of pooled hazard ratios of overall survival of patients with high UCA1 expression level
Stratified analysis |
No. of |
No. of |
Pooled HR (95% CI) |
p-value |
Heterogeneity |
||
|---|---|---|---|---|---|---|---|
I2 (%) |
P-value |
Model |
|||||
[1] Tumor type |
14 |
1364 |
|
|
|
|
|
Colorectal cancer |
6 |
530 |
2.21(1.35–3.08) |
<0.001 |
0.0 |
0.989 |
Fixed effects |
Pancreatic cancer |
2 |
208 |
1.58(1.01–2.15) |
<0.001 |
0.0 |
0.532 |
Fixed effects |
Hepatocellular carcinoma |
2 |
338 |
1.89(0.96–2.82) |
<0.001 |
0.0 |
0.910 |
Fixed effects |
Gastric cancer |
2 |
132 |
2.13(1.17–3.09) |
<0.001 |
0.0 |
0.746 |
Fixed effects |
Esophageal carcer |
2 |
156 |
2.41(1.01–3.82) |
0.001 |
0.0 |
0.807 |
Fixed effects |
[2] Histology type |
|
|
|
|
|
|
|
Squamous cell carcinoma |
1 |
90 |
2.63(1.42–5.87) |
<0.001 |
- |
- |
- |
Nonsquamous cell carcinoma |
13 |
1274 |
1.87(1.49–2.25) |
<0.001 |
0.0 |
0.994 |
Fixed effects |
[3] Country |
|
|
|
|
|
|
|
China |
13 |
1124 |
1.89(1.50–2.27) |
<0.001 |
0.0 |
0.990 |
Fixed effects |
Korea |
1 |
240 |
1.99(0.84–4.78) |
0.117 |
- |
- |
- |
[4] Sample size |
|
|
|
|
|
|
|
≥ 100 |
5 |
706 |
1.67(1.15–2.20) |
<0.001 |
0.0 |
0.874 |
Fixed effects |
< 100 |
9 |
658 |
2.10(1.57–2.63) |
<0.001 |
0.0 |
0.997 |
Fixed effects |
[5] Analysis type |
|
|
|
|
|
|
|
multivariate |
10 |
873 |
1.85(1.45–2.25) |
<0.001 |
0.0 |
0.950 |
Fixed effects |
Non-multivariate |
4 |
491 |
2.12(1.14–3.09) |
<0.001 |
0.0 |
0.997 |
Fixed effects |
[6] Cut-off value |
|
|
|
|
|
|
|
median expression |
9 |
1094 |
2.12(1.53–2.70) |
<0.001 |
0.0 |
0.998 |
Fixed effects |
mean expression |
3 |
170 |
1.62(1.05–2.19) |
<0.001 |
0.0 |
0.563 |
Fixed effects |
others |
2 |
100 |
2.01(1.09–2.93) |
<0.001 |
0.0 |
0.988 |
Fixed effects |
Table 3: Results of subgroup analysis of the independent role of UCA1 in overall survival of digestive system malignancies
Stratified analysis |
No. of |
No. of |
Pooled HR |
p-value |
Heterogeneity |
||
|---|---|---|---|---|---|---|---|
I2 (%) |
P-value |
Model |
|||||
[1] Tumor type |
10 |
873 |
|
|
|
|
|
Colorectal cancer |
4 |
345 |
2.28(1.20–3.36) |
<0.001 |
0.0 |
0.909 |
Fixed effects |
Pancreatic cancer |
2 |
208 |
1.58(1.01–2.15) |
<0.001 |
0.0 |
0.532 |
Fixed effects |
Hepatocellular carcinoma |
1 |
98 |
1.86(1.08–3.21) |
<0.001 |
- |
- |
- |
Gastric cancer |
2 |
132 |
2.13(1.17–3.09) |
<0.001 |
0.0 |
0.746 |
Fixed effects |
Esophageal carcinoma |
1 |
90 |
2.63(1.42–5.87) |
<0.001 |
- |
- |
- |
[2] Histology type |
|
|
|
|
|
|
|
Squamous cell carcinoma |
1 |
90 |
2.63(1.42–5.87) |
<0.001 |
- |
- |
- |
Nonsquamous cell carcinoma |
9 |
783 |
1.82(1.41–2.23) |
<0.001 |
0.0 |
0.944 |
Fixed effects |
[3] Sample size |
|
|
|
|
|
|
|
≥ 100 |
3 |
361 |
1.62(1.04–2.19) |
<0.001 |
0.0 |
0.625 |
Fixed effects |
< 100 |
7 |
512 |
2.09(1.51–2.66) |
<0.001 |
0.0 |
0.982 |
Fixed effects |
[4] Cut-off value |
|
|
|
|
|
|
|
median expression |
6 |
603 |
2.12(1.43–2.81) |
<0.001 |
0.0 |
0.968 |
Fixed effects |
mean expression |
2 |
170 |
1.58(0.99–2.18) |
<0.001 |
0.0 |
0.340 |
Fixed effects |
others |
2 |
100 |
2.01(1.09–2.93) |
<0.001 |
0.0 |
0.988 |
Fixed effects |
The leave-one-out sensitivity analysis performed showed that no individual study changed the pooled HRs significantly (Figure 3B). However, the shape of funnel plot was asymmetrical (Figure 3C) and the tests of publication bias showed there was significant publication bias (Begg’s test: z (continuity corrected) = 1.79, P=0.074; Egger’s test: t(bias)=4.62, P = 0.002). Then the “trim and fill method” was also adopted to replace five missing studies(Figure 3D). After correction, the adjusted pooled HR was 1.775 (95 % CI: 1.491- 2.113, p<= 0.001).
UCA1 expression and disease-free survival(DFS) in digestive system cancers
Only three studies including 429 patients reported the relationship between UCA1 and DFS in digestive system malignancies [22, 23, 25]. Two studies were about gastric cancer [22, 25], and one was for hepatocellular carcinoma [23]. Due to no significant heterogeneity across-studies was observed (I2 = 0.0 %; P = 0.994), the fixed-effects model was used to analyze the pooled hazard ratios (HRs) with corresponding 95 % confidence interval (CI). The results showed that there was a significant association between high expression level of UCA1 and poor DFS in digestive system malignancies (HR = 2.50; 95 % CI = 1.30–3.69; p<= 0.001) (Figure 4). Particularly, UCA1 was found to be a significant prognostic indicator of DFS for patients with gastric cancer (HR =2.54; 95 % CI = 1.09–4.00, p= 0.001) (Figure 4). However, due to no heterogeneity across-studies and the small number of studies, publication bias and sensitivity analysis were not conducted.
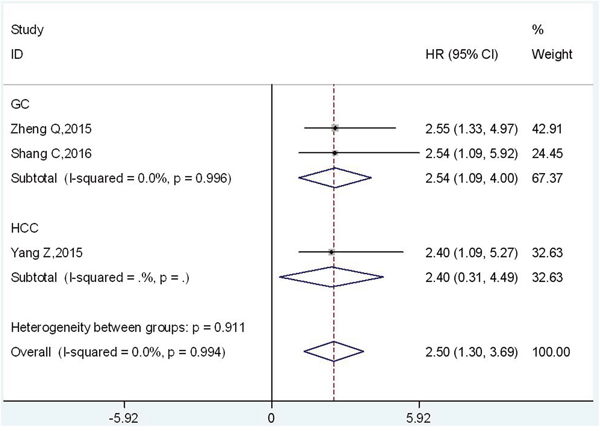
Figure 4: Forest plot of HR for the relationship between high UCA1 expression level and DFS in digestive system malignancies.
Clinicopathological value of UCA1 in digestive system cancers
UCA1 expression and clinicopathological factors in esophageal cancer
There were only two studies reporting the relationship between UCA1 and clinicopathological features of esophageal cancer [17, 29]. Both two studies assessed the correlation between UCA1 expression and gender, age and TNM stage. Because no significant heterogeneity was detected in gender (P= 0.97, I2 %= 0%), age (P=0.80, I2 %= 0%) and TNM stage (P=0.87, I2 %= 0%), the fixed-effects model was used for all (Table 4). The combined results showed that there was no significant association betweenUCA1expression and gender (OR: 1.26, 95 % CI: 0.67–2.38, p = 0.47) and age (OR: 1.35, 95 % CI: 0.69–2.65, p = 0.38). While high UCA1 expression was found to be significantly associated with advanced TNM stage (OR: 3.81, 95 % CI: 1.87–7.76, p= 0.0002). Publication bias and sensitivity analysis were not applicable in analyzing the relationship between UCA1 and clinicopathological features of esophageal cancer, because of the limited number of studies without between-studies heterogeneity.
Table 4: Results of meta-analysis of high UCA1 expression level and clinicopathological features in esophageal cancer, colorectal cancer and pancreatic cancer
Stratified analysis |
No. of |
No. of |
Pooled OR (95% CI) |
p-value |
Heterogeneity |
||
|---|---|---|---|---|---|---|---|
I2 (%) |
P-value |
Model |
|||||
Esophageal cancer |
2 |
156 |
|
|
|
|
|
Gender (male vs. female) |
2 |
156 |
1.26(0.67–2.38) |
0.47 |
0.0 |
0.97 |
Fixed effects |
Age (≥60 vs. <60) |
2 |
156 |
1.35(0.69–2.65) |
0.38 |
0.0 |
0.80 |
Fixed effects |
Tumor stage (III+IV vs. I+II) |
2 |
156 |
3.81(1.87–7.76) |
0.0002 |
0.0 |
0.87 |
Fixed effects |
Colorectal cancer |
5 |
425 |
|
|
|
|
|
Gender (male vs. female) |
5 |
425 |
0.76(0.51–1.13) |
0.17 |
16 |
0.31 |
Fixed effects |
Tumor size (≥5 vs. <5cm) |
3 |
250 |
1.81(0.67–4.90) |
0.24 |
70 |
0.04 |
Random effects |
Location (colon vs rectum) |
3 |
291 |
0.77(0.48–1.24) |
0.28 |
0.0 |
0.8 |
Fixed effects |
Histological grade (poorly and others vs. well and moderately) |
5 |
425 |
2.60(1.67-4.03) |
<0.0001 |
45 |
0.12 |
Fixed effects |
Depth of invasion (T3-4 vs. T1-2) |
4 |
371 |
1.71(0.78–3.75) |
0.18 |
60 |
0.04 |
Random effects |
Lymphatic invasion (yes vs. no) |
3 |
224 |
1.56(0.88–2.75) |
0.13 |
0.0 |
0.73 |
Fixed effects |
Venous invasion (yes vs. no) |
2 |
134 |
0.85(0.39–1.85) |
0.69 |
0.0 |
0.78 |
Fixed effects |
Lymph node metastasis (yes vs. no) |
2 |
134 |
3.88(1.71–8.83) |
0.001 |
0.0 |
0.74 |
Fixed effects |
Distant metastasis (yes vs. no) |
4 |
345 |
2.67(1.32–5.38) |
0.006 |
25 |
0.26 |
Fixed effects |
Tumor stage (III+IV vs. I+II) |
5 |
425 |
2.45(1.62–3.70) |
<0.0001 |
38 |
0.17 |
Fixed effects |
Pancreatic cancer |
2 |
208 |
|
|
|
|
|
Gender (male vs. female) |
2 |
208 |
0.92(0.53–1.61) |
0.78 |
33 |
0.22 |
Fixed effects |
Location (head vs. body and tail) |
2 |
208 |
1.14(0.64–2.02) |
0.66 |
0.0 |
0.52 |
Fixed effects |
Histological grade (poorly vs. well and moderately) |
2 |
208 |
1.04(0.39–2.79) |
0.94 |
67 |
0.04 |
Random effects |
Depth of invasion (T3-4 vs. T1-2) |
2 |
208 |
2.50(1.34–4.67) |
0.004 |
0.0 |
0.41 |
Fixed effects |
Nervous invasion (yes vs. no) |
2 |
208 |
1.51(0.86–2.66) |
0.15 |
0.0 |
0.36 |
Fixed effects |
UCA1 expression and clinicopathological factors in colorectal cancer
A total of five studies explored the relationship between UCA1 and clinicopathological characteristics of colorectal cancer [16, 19, 21, 24, 27], including five studies regarding gender, differentiation grade and TNM stage, four studies of depth of primary tumor invasion and distant metastasis, three studies involving tumor size, location and lymphatic invasion, two studies of lymph node metastasis and venous invasion (Table 4).
The analysis between UCA1 expression and gender (P = 0.31, I2 %= 16 %), location (P = 0.80, I2 %= 0 %), differentiation grade (P = 0.12, I2 %= 45 %), lymphatic invasion(P = 0.73, I2 %= 0 %), venous invasion (P = 0.78, I2 %= 0 %), lymph node metastasis (P = 0.74, I2 %= 0 %), distant metastasis (P = 0.26, I2 %= 25 %), and TNM stage (P = 0.17, I2 %= 38 %) in colorectal cancer revealed no significant heterogeneity across studies, and thus the fixed-effects model was applied. However, there were significant heterogeneity in studies regarding depth of primary tumor invasion (P = 0.04, I2 %= 60 %) and tumor size (P = 0.04, I2 %= 70 %) (Table 4), therefore the random-effects model was applied.
In colorectal cancer, high UCA1 expression was significantly related to differentiation grade (OR: 2.60, 95 % CI: 1.67– 4.03, p<0.0001), lymph node metastasis (OR: 3.88, 95 % CI: 1.71– 8.83, p = 0.001) and distant metastasis(OR: 2.67, 95 % CI: 1.32-5.38, p = 0.006) and TNM stage (OR: 2.45, 95 % CI: 1.62-3.70, p <0.0001). Whereas no significant association was found with gender (OR: 0.76, 95 % CI: 0.51– 1.13, p = 0.17), tumor size (OR: 1.81, 95 % CI: 0.67– 4.90, p = 0.24), location (OR: 0.77, 95 % CI: 0.48– 1.24, p = 0.28), the depth of tumor(OR: 1.71, 95 % CI: 0.78– 3.75, p = 0.18), lymphatic invasion (OR: 1.56, 95 % CI: 0.88-2.75, p = 0.13) and venous invasion (OR: 0.85, 95 % CI: 0.39-1.85, p = 0.69). Publication bias and sensitivity analysis were not performed due to the small number of studies and little heterogeneity.
UCA1 expression and clinicopathological factors in pancreatic cancer
In pancreatic cancer, there were only two studies assessing the correlation between UCA1 expression and clinicopathological data [26, 28], the following clinicopathological features were both reported in the two studies: gender, location, histological grade, nervous invasion and depth of tumor.
Except for histological grade (P = 0.04, I2%= 67%), there was no significant heterogeneity between studies in gender (P = 0.22, I2 %= 33 %), location (P = 0.52, I2%= 0 %), nervous invasion (P =0.36, I2 %= 0 %) and depth of invasion (P = 0.41, I2 %= 0 %). Thus, the fixed-effects model was used for all except for the histological grade (Table 4).
The overall meta-analysis results revealed that UCA1 expression was no significantly associated with gender (OR: 0.92, 95 % CI: 0.53–1.61, p = 0.78), location (OR:1.14, 95 % CI: 0.64–2.02, p = 0.66), histological grade (OR: 1.04, 95 % CI: 0.39–2.79, p = 0.94) and nervous invasion (OR: 1.51, 95 % CI: 0.86–2.66, p = 0.15) (Table 4). Nevertheless, the depth of primary tumor invasion has a significant correlation with UCA1 expression (OR: 2.50, 95 % CI: 1.34–4.67, p = 0.004) (Table 4).
Because of little heterogeneity and small number of included studies, publication bias and sensitivity analysis were not performed in analyzing the relationship between UCA1 and clinicopathological parameters of pancreatic cancer.
DISCUSSION
Recently, many studies reported that the expression of UCA1 was significantly upregulated in tumor tissues from human digestive system, and UCA1 played a crucial role in the tumorigenesis of digestive system malignancies [30–32]. But the prognostic value of UCA1 in the malignant digestive system tumors was still not clear. Therefore, this meta-analysis was performed to evaluate the clinical relevance and prognostic value of UCA1 in digestive system malignancies. To our best knowledge, this is the first meta-analysis to explore the association between UCA1 expression and OS, DFS and clinicopathological features in human digestive system cancers.
Here we undertook meta-analysis of 15 studies comprising 1441 patients with digestive system cancer. 1364 patients with OS data were included in 14 studies and 429 patients with DFS data were from 3 studies. The prognostic value of UCA1 in digestive system cancers was assessed. However, both the heterogeneity test and fixed-effects model were performed. The present study demonstrated that UCA1 expression was negatively correlated with OS in patients with digestive system malignancies (HR: 1.89, 95 % CI: 1.52–2.26, p<= 0.001). The patients with high UCA1 expression had a poorer OS compared to patients with low UCA1 expression. Despite significant heterogeneity didn’t exist in these studies for OS, subgroup analyses were performed on the tumor type, country, histology type, analysis type, sample size and cut-off value (Table 2), these factors didn’t alter the significant predictive value of UCA1 in OS in different kinds of digestive system malignancies. Then the “trim-and-fill” method was applied to adjust our results since we found significant publication bias through Begg’s test and Egger’s test in the studies (Figure 2). After adjusting for the pooled HR and 95 % CI, there was no significant alternation with the primary data (HR: 1.823, 95 % CI: 1.563–2.126, p<= 0.001). It indicated that our results were reliable, which was also confirmed in sensitivity analysis.
Furthermore, we found that UCA1 could act as an independent prognostic prediction factor for patients with digestive system malignancies. The results could be confirmed by HRs and 95 % CIs from multivariate Cox regression analyses (HR:1.85, 95 % CI: 1.45-2.25, p<= 0.001). And no obvious heterogeneity was observed in subgroup analysis of studies. The prognostic implication of UCA1 was also showed in the stratified analysis based on cancer type, histology type, sample size and cut-off value (Table 3). None of these variables changed the predictive value of UCA1 as an independent factor for OS of patients with digestive system malignancies. Although significant publication bias was found in our meta-analysis, the adjusted pooled HR demonstrated that UCA1 could be applied as an independent prognostic factor for digestive system malignancies (HR: 1.775, 95 % CI: 1.491- 2.113, p<= 0.001) (Figure 3). The sensitivity analysis also indicated the stability of this results (Figure 3). Besides that, our results also showed that there was a significant negative association between UCA1 levels and DFS in digestive system malignancies (HR = 2.50; 95 % CI = 1.30–3.69; p<= 0.001) (Figure 4), particularly in gastric cancer (HR =2.54; 95 % CI = 1.09–4.00, p= 0.001) (Figure 4).
For the relationship between UCA1 and clinicopathological features in digestive system cancers, multiple studies have been performed on different kinds of the cancers. But clinicopathological value of UCA1 in a specific kind of digestive system cancer was distinctive and even contradictory. For example, in human colorectal cancer, Han et al. [16] suggested that UCA1 correlated with differentiation and invasion depth. Jiang et al. [27]indicated that UCA1 was correlated with differentiated histology, but no significant association was found in invasion depth of colorectal cancer. Chen et al. [26] reported different result, which demonstrated that UCA1 expression in pancreatic cancer was significantly correlated with depth of invasion, but without no significant correlation with histological differentiation.
The molecular biology characters were different and mechanism of tumorigenesis was complex in the digestive tract tumor. Thus, we focused on the clinicopathological value of UCA1 in a specific type of digestive tract cancers. We studied the association between UCA1 expression and clinicopathological characteristics in esophageal cancer, colorectal cancer and pancreatic cancer. The clinicopathological value of UCA1 in gastric cancer and hepatocellular carcinoma was not obtained for the limited and unavailable data of clinical pathological features. In esophageal cancer, we found UCA1 was significantly associated with advanced TNM stage, but no significant association was found in gender and age. In colorectal cancer, our research demonstrated that UCA1 expression was significantly related to differentiation grade, lymph node metastasis, distant metastasis and TNM stage, but no significant association was observed in gender, tumor size, location, the depth of tumor, lymphatic and venous invasion. Finally, the clinicopathological role of UCA1 was evaluated in pancreatic cancer, UCA1 expression was significantly associated with primary tumor invasion, however no significant association was found in gender, location, histological grade and nervous invasion.
The expression patterns and biological roles of UCA1 in digestive system cancers was explored. It would further support UCA1 as a promising biomarker for the prognosis of digestive system tumors. The potential roles of UCA1 expression regulation in various digestive carcinomas have been reviewed. For gastric cancer, UCA1 was observed to be highly expressed, while the silence of UCA1 could decrease proliferation of tumor cells. Expression of UCA1 was negatively correlated with the miR-27b and the UCA1-miR-27b axis was involved in regulation of chemo-sensitivity of gastric cancer cells [33]. In esophageal squamous cell carcinoma (ESCC), it demonstrated that UCA1 could inhibited cell proliferation, migration, invasion, and cell cycle progression of EC109 cells, and UCA1 could involve in ESCC development by regulating the Wnt signaling pathway [34]. For colorectal cancer (CRC), Han et al. [16] found that UCA1 levels were markedly elevated in tissues and cells compared to controls, and it could influence malignant biological behavior of CRC cells. The study by Bian et al. [24] identified UCA1 as a new oncogene, which implicated in miR-204-5p-CREB1/BCL2/RAB22A regulatory network in CRC. For the liver cancer, it found that upregulated UCA1 could promote cell growth and tumorigenesis through the signaling of HBx-UCA1/EZH2-p27Kip1 axis in hepatocarcinogenesis [35]. For the contribution of UCA1 to tumorigenesis of pancreatic cancer, Chen et al. [26] detected UCA1 expression was greatly increased in cancerous tissue and UCA1 played a physiological role in regulating proliferation, apoptosis and cell cycle arrest. Fu et al. [28] also provide evidence that UCA1 promoted the tumorigenesis in pancreatic cancer. Nevertheless, the exact molecular mechanisms of UCA1 in carcinogenesis and progression of digestive system cancers was still pending exploration. More experimental studies should be conducted to clarify the unrecognized roles and detailed function of UCA1 in carcinogenesis and progression.
It should be emphasized that the present meta-analysis had several limitations. First, the criterion of high expression for UCA1 in tissue samples was not the same in different studies, and it was hard to get a consensus cut-off value to define the UCA1 overexpression in various cancers. Second, the therapeutic strategy was diverse in gastrointestinal tumors, which made a significant influence on postoperative survival of patients, leading to heterogeneity. Third, we only studied publications written in English and Chinese, and only 15 studies with 1441 patients were included in present meta-analysis, so the total number of studies and patients included was relatively small. Fourth, only 3 studies including 429 patients were included and reported the relationship between UCA1 and DFS. Furthermore, all the studies we included were conducted in Asian population from Chinese and Korea. Finally, the potential publication bias was also observed in this meta-analysis and positive results would be more easily to be published than that of in negative results.
In conclusion, the meta-analysis results of this study could help to improve our understanding on the prognosis significance of UCA1 in different types of digestive system carcinomas. UCA1 may serve as a novel biomarker for predicting the prognosis and assessing clinicopathologic features in digestive system carcinomas. Ultimately, further scientific research with larger-size, multi-center and higher-quality studies is required to verify the clinical utility of UCA1 in digestive system malignancies.
MATERIALS AND METHODS
Search strategy and study selection
To get access to potentially eligible studies, comprehensive literature retrieval was performed against several databases: PubMed, Web of Science, Embase and Chinese National Knowledge Infrastructure (CNKI), Wanfang database. The literature search was conducted up to Oct. 15, 2016. The publications were identified with the combination of the following search terms: “Urothelial cancer-associated 1” or “UCA1” or “lncRNA UCA1” or “long noncoding RNA UCA1”, “cancer” or “carcinoma” or “tumor” or “neoplasm,” “prognosis” or “survival” or “clinical outcome”. The reference lists of relevant articles were also searched manually. The published language was limited to English and Chinese.
Inclusion and exclusion criteria were set to screen the publications. Inclusion criteria were as follows: (1) The studies explored the association between UCA1 and cancer prognosis; (2) Related clinicopathologic parameters were described; (3) The UCA1 expression were determined in the tissues of digestive system cancers; (4) Patients were divided into high and low expression groups according to the expression level of lncRNA UCA1; (5) Sufficient information and data was provided for calculating a hazard ratio (HR) with its 95% confidence interval (CI). Exclusion criteria were as follows: (1) The studies not relevant to digestive system cancers, UCA1, or cancer prognosis; (2) studies without usable data, such the data was obtained from animal models; (3) duplicate publications; and (4) reviews, letters and case reports.
Data extraction and quality assessment
Two authors (DQ and GH) extracted data independently from all the including studies by standardized data compilation forms, and any disagreements were resolved by discussion. For all eligible studies, the following information was collected: the first author, year of publication, country, cancer type, sample size, tumor stage, follow-up period, outcome measures, cut-off value, determination method, HR and corresponding 95 % CI. The clinicopathological data were also extracted from the eligible studies.
If the HRs with corresponding 95 % CIs was provided in a including study, the available data was directly extracted. If a study provided only Kaplan-Meier curves, the survival data was extracted from Kaplan-Meier survival curves by Engauge Digitizer V4.1 (http://digitizer.sourceforge.net/).
The Newcastle-Ottawa Scale (NOS) was applied to assess the quality of all including studies. The scores of NOS criteria were ranged from 0 (lowest) to 9 (highest). If the final scores of a study was higher, the methodological quality was better. A study with an NOS score equal or more than 6 was considered to be of high quality. In this meta-analysis, the quality of all studies included in this meta-analysis was varied from 6 to 9, with a mean value of 7.5.
Statistical analysis
Statistical analyses of HRs for OS and DFS were calculated by Stata SE12.0 (Stata Corporation, College Station, TX, USA). ORs for clinicopathological parameters were calculated by RevMan5.3 software (Cochrane Collaboration, http://community.cochrane.org/tools/reviewproduction-tools/revman-5/revman-5-download).
The between-studies heterogeneity was determined by Chi square-based Q test and I2 statistics. A P value great than 0.05 for the Q test and I2 value less than 50 % were considered to be of no significant heterogeneity, then the fixed effects model was applied (P > 0.05, I2 < 50%); otherwise, the random effects model was used to provide wider CI for studies with significant heterogeneity.
Subgroup analysis was performed to further investigate the prognostic value of lncRNA UCA1 in digestive system malignancies. Potential publication bias was determined with funnel plots analysis, Begg’s test and Egger’s test. The sensitivity analysis was also performed to assess the stability of the results. A p value less than 0.05 was statistically significant.
ACKNOWLEDGMENTS AND FUNDING
We thank for the financial support of National Natural Science Foundation of China (No.81560389) and Graduate Innovation Fund of Nanchang University (No.cx2015168). Our deepest gratitude goes to the editors and anonymous reviewers for their careful work and thoughtful suggestions that have helped improve this paper substantially.
CONFLICTS OF INTEREST
The authors declared no conflicts of interest regarding the publication of this paper.
REFERENCES
1. Siegel R, Naishadham D, Jemal A. Cancer statistics, 2012. CA Cancer J Clin. 2012; 62: 10-29.
2. Jemal A, Bray F, Center MM, Ferlay J, Ward E, Forman D. Global cancer statistics. CA Cancer J Clin. 2011; 61: 69-90.
3. Hung T, Chang HY. Long noncoding RNA in genome regulation: Prospects and mechanisms. RNA Biol. 2010; 7: 582-585.
4. Yamashita A, Shichino Y, Yamamoto M. The long non-coding RNA world in yeasts. Biochim Biophys Acta. 2016; 1859: 147-54.
5. Malek E, Jagannathan S, Driscoll JJ. Correlation of long non-coding RNA expression with metastasis, drug resistance and clinical outcome in cancer. Oncotarget. 2014; 5: 8027-38. doi: 10.18632/oncotarget.2469.
6. Li Y, Chen H, Pan T, Jiang C, Zhao Z, Wang Z, Zhang J, Xu J, Li X. LncRNA ontology: inferring lncRNA functions based on chromatin states and expression patterns. Oncotarget. 2015; 6: 39793-805. doi: 10.18632/oncotarget.5794.
7. Li H, An J, Wu M, Zheng Q, Gui X, Li T, Pu H, Lu D. LncRNA HOTAIR promotes human liver cancer stem cell malignant growth through downregulation of SETD2. Oncotarget. 2015; 6: 27847-64. doi: 10.18632/oncotarget.4443.
8. Liang WC, Fu WM, Wong CW, Wang Y, Wang WM, Hu GX, Zhang L, Xiao LJ, Wan DC, Zhang JF, Waye MM. The lncRNA H19 promotes epithelial to mesenchymal transition by functioning as miRNA sponges in colorectal cancer. Oncotarget. 2015; 6: 22513-25. doi: 10.18632/oncotarget.4154.
9. Tian ZZ, Guo XJ, Zhao YM, Fang Y. Decreased expression of long non-coding RNA MEG3 acts as a potential predictor biomarker in progression and poor prognosis of osteosarcoma. Int J Clin Exp Pathol. 2015; 8: 15138-42.
10. Wang Z, Jin Y, Ren H, Ma X, Wang B, Wang Y. Downregulation of the long non-coding RNA TUSC7 promotes NSCLC cell proliferation and correlates with poor prognosis. Am J Transl Res. 2016; 8: 680-7.
11. Wang S, Wang Z. Prognostic value of long noncoding RNA HOTAIR in digestive system malignancies. J Gastroenterol Hepatol. 2015; 30: 1123-33.
12. Wang XS, Zhang Z, Wang HC, Cai JL, Xu QW, Li MQ, Chen YC, Qian XP, Lu TJ, Yu LZ, Zhang Y, Xin DQ, Na YQ, et al. Rapid identification of UCA1 as a very sensitive and specific unique marker for human bladder carcinoma. Clin Cancer Res. 2006; 12:4851–4858.
13. Zhang L, Cao X, Zhang L, Zhang X, Sheng H, Tao K. UCA1 overexpression predicts clinical outcome of patients with ovarian cancer receiving adjuvant chemotherapy. Cancer Chemother Pharmacol. 2016; 77: 629-634.
14. Na XY, Liu ZY, Ren PP, Yu R, Shang XS. Long non-coding RNA UCA1 contributes to the progression of prostate cancer and regulates proliferation through KLF4-KRT6/13 signaling pathway. Int J Clin Exp Med. 2015; 8: 12609-12616.
15. Cheng N, Cai W, Ren S, Li X, Wang Q, Pan H, Zhao M, Li J, Zhang Y, Zhao C, Chen X, Fei K, Zhou C, et al. Long non-coding RNA UCA1 induces non-T790M acquired resistance to EGFR-TKIs by activating the AKT/mTOR pathway in EGFR-mutant non-small cell lung cancer. Oncotarget. 2015; 6: 23582-93. doi: 10.18632/oncotarget.4361.
16. Han Y, Yang YN, Yuan HH, Zhang TT, Sui H, Wei XL, Liu L, Huang P, Zhang WJ, Bai YX. UCA1, a long non-coding RNA up-regulated in colorectal cancer influences cell proliferation, apoptosis andcell cycle distribution. Pathology. 2014; 46: 396-401.
17. Li JY, Ma X, Zhang CB. Overexpression of long non-coding RNA UCA1 predicts a poor prognosis in patients with esophageal squamous cell carcinoma. Int J Clin Exp Pathol. 2014; 7: 7938-7944.
18. Gao J, Cao R, Mu H. Long non-coding RNA UCA1 may be a novel diagnostic and predictive biomarker in plasma for early gastriccancer. Int J Clin Exp Pathol. 2015; 8: 12936-12942.
19. Tao K, Yang J, Hu Y, Sun Y, Tan Z, Duan J, Zhang F, Yan H, Deng A. Clinical significance of urothelial carcinoma associated 1 in colon cancer. Int J Clin Exp Med. 2015; 8: 21854-21860.
20. Wang F, Ying HQ, He BS, Pan YQ, Deng QW, Sun HL, Chen J, Liu X, Wang SK. Upregulated lncRNA-UCA1 contributes to progression of hepatocellular carcinoma through inhibition ofmiR-216b and activation of FGFR1/ERK signaling pathway. Oncotarget. 2015; 6: 7899-7917. doi: 10.18632/oncotarget.3219.
21. Ni B, Yu X, Guo X, Fan X, Yang Z, Wu P, Yuan Z, Deng Y, Wang J, Chen D, Wang L. Increased urothelial cancer associated 1 is associated with tumor proliferation and metastasis and predictspoor prognosis in colorectal cancer. Int J Oncol. 2015; 47: 1329-1338.
22. Zheng Q, Wu F, Dai WY, Zheng DC, Zheng C, Ye H, Zhou B, Chen JJ, Chen P. Aberrant expression of UCA1 in gastric cancer and its clinical significance. Clin Transl Oncol. 2015; 17: 640-646.
23. Yang Z, Lu Y, Xu Q, Tang B, Park CK, Chen X. HULC and H19 Played Different Roles in Overall and Disease-Free Survival from Hepatocellular Carcinomaafter Curative Hepatectomy: A Preliminary Analysis from Gene Expression Omnibus. Dis Markers. 2015; 2015: 191029.
24. Bian Z, Jin L, Zhang J, Yin Y, Quan C, Hu Y, Feng Y, Liu H, Fei B, Mao Y, Zhou L, Qi X, Huang S, et al. LncRNA-UCA1enhances cell proliferation and 5-fluorouracil resistance in colorectal cancer by inhibiting miR-204-5p. Sci Rep. 2016; 6: 23892.
25. Shang C, Guo Y, Zhang J, Huang B. Silence of long noncoding RNA UCA1 inhibits malignant proliferation and chemotherapy resistance toadriamycin in gastric cancer. Cancer Chemother Pharmacol. 2016; 77: 1061-1067.
26. Chen P, Wan D, Zheng D, Zheng Q, Wu F, Zhi Q. Long non-coding RNA UCA1 promotes the tumorigenesis in pancreatic cancer. Biomed Pharmacother. 2016; 83: 1220-1226.
27. Jiang H, Chen YT, Fu XG. Tissue expression level of lncRNA UCA1 is a prognostic biomarker for colorectal cancer. Int J Clin Exp Pathol. 2016; 9: 4241-4246.
28. Fu XL, Liu DJ, Yan TT, Yang JY, Yang MW, Li J, Huo YM, Liu W, Zhang JF, Hong J, Hua R, Chen HY, Sun YW. Analysis of long non-coding RNA expression profiles in pancreatic ductal adenocarcinoma. Sci Rep. 2016; 6: 33535.
29. Jiao C, Song Z, Chen J, Zhong J, Cai W, Tian S, Chen S, Yi Y, Xiao Y. lncRNA-UCA1 enhances cell proliferation through functioning as a ceRNA of Sox4 in esophageal cancer. Oncol Rep. 2016; 36: 2960-2966.
30. Gu W, Gao T, Sun Y, Zheng X, Wang J, Ma J, Hu X, Li J, Hu M. LncRNA expression profile reveals the potential role of lncRNAs in gastric carcinogenesis. Cancer Biomark. 2015; 15: 249-58.
31. Li CY, Liang GY, Yao WZ, Sui J, Shen X, Zhang YQ, Peng H, Hong WW, Ye YC, Zhang ZY, Zhang WH, Yin LH, Pu YP. Integrated analysis of long non-coding RNA competing interactions reveals the potential role in progression of human gastric cancer. Int J Oncol. 2016; 48: 1965-76.
32. El-Tawdi AH, Matboli M, El-Nakeep S, Azazy AE, Abdel-Rahman O. Association of long noncoding RNA and c-JUN expression in hepatocellular carcinoma. Expert Rev Gastroenterol Hepatol. 2016; 10: 869-77.
33. Fang Q, Chen X, Zhi X. Long non-coding RNA (LncRNA) urothelial carcinoma associated 1 (UCA1) increases multi-drug resistance of gastric cancer via downregulating miR-27b. Med Sci Monit. 2016; 22: 3506-3513.
34. Wang X, Gao Z, Liao J, Shang M, Li X, Yin L, Pu Y, Liu R. LncRNA UCA1 inhibits esophageal squamous-cell carcinoma growth by regulating the Wnt signaling pathway. J Toxicol Environ Health A. 2016; 79: 407-18.
35. Hu JJ, Song W, Zhang SD, Shen XH, Qiu XM, Wu HZ, Gong PH, Lu S, Zhao ZJ, He ML, Fan H. HBx-upregulated lncRNA UCA1 promotes cell growth and tumorigenesis by recruiting EZH2 and repressing p27Kip1/CDK2 signaling. Sci Rep. 2016; 6: 23521.