
INTRODUCTION
One of the neuropathological hallmarks of Alzheimer’s Disease (AD) is the neurofibrillary tangle, which contains paired helical filaments (PHFs) composed of hyperphosphorylated forms of the microtubule-associated protein tau (MAPT) by mechanism which is not illustrated [1]. Increasing attention has been paid to endogenous and exogenous factors, as well as genetic risk factors contributing to the incidence of AD [2], stimulating the disease progression of AD [3]. It was believed that the identification of key genetic determinants for AD might help further understand its underlying mechanism.
Human MAPT gene is located on chromosome 17q21. There have been conflicting results showing positive or negative findings on the association between the MAPT SNPs and AD risk. Some studies were showed that SNPs rs242557 [4, 5], rs3785883 [6] in US series, rs2471738 [6, 7] and rs1467967 [8] of the MAPT gene might been associated with increased AD risk. Some studies were, however, reported that rs242557 [8-10], rs3785883 [11-14], rs2471738 [11, 14, 15] and rs1467967 [7, 16] might not be associated with AD risk [10, 11, 13, 16, 17].
There are many factors leading to these different results about the association between the MAPT SNPs and AD risk. One of primary reasons is low statistical power and the limited sample size in each study. Therefore, we performed a meta-analysis on the association between the MAPT SNPs and AD risk by pooling all available published data. In this study, we evaluated the genetic heterogeneity of the studies included and then carried out a meta-analysis on the association between the MAPT SNPs (rs242557, rs2471738, rs3785883 and rs1467967) with AD risk to make a more accurate assessment of the relationship for greater power in detecting the disease associations.
RESULTS
Characteristic of eligible studies
The literature search was done on studies up to January 2017 and availability of an English-language abstract or paper for review; this yielded 208 hits (PubMed: 14, Google scholar: 194). 194 of these were excluded, including 16 duplicates, 67 non-AD case reports, 34 reviews, 34 irrelevant studies, 25 data not available, 10 abstracts, 5 non-English language papers (also non-Chinese) and 3 case reports. In total, 64 independent studies from 14 articles published from 2005 to 2016 providing data of the MAPT genotype, were included in the current meta-analysis (16 for rs242557, 14 for rs2471738, 14 for rs3785883 and 15 for rs1467967; Figure 1). We found that in all the studies included SNPs neither rs75721 (within exon 14) nor rs9468 (within exon 13) was significantly associated with increased AD risk (results not shown). So, we analyzed the associations between these SNPs (rs242557, rs2471738, rs3785883 and rs1467967) of the MAPT gene and AD risk involved in 14666/17532, 13812/17201, 14607/17883 and 15064/17687 cases/controls, respectively. The NOS results indicated that the methodological quality of these selected studies was generally good. The study characteristics were listed in Table 1.
Table 1: Main characteristics of the studies included in this meta-analysis of the associations between these SNPs of the MAPT gene and AD risk.
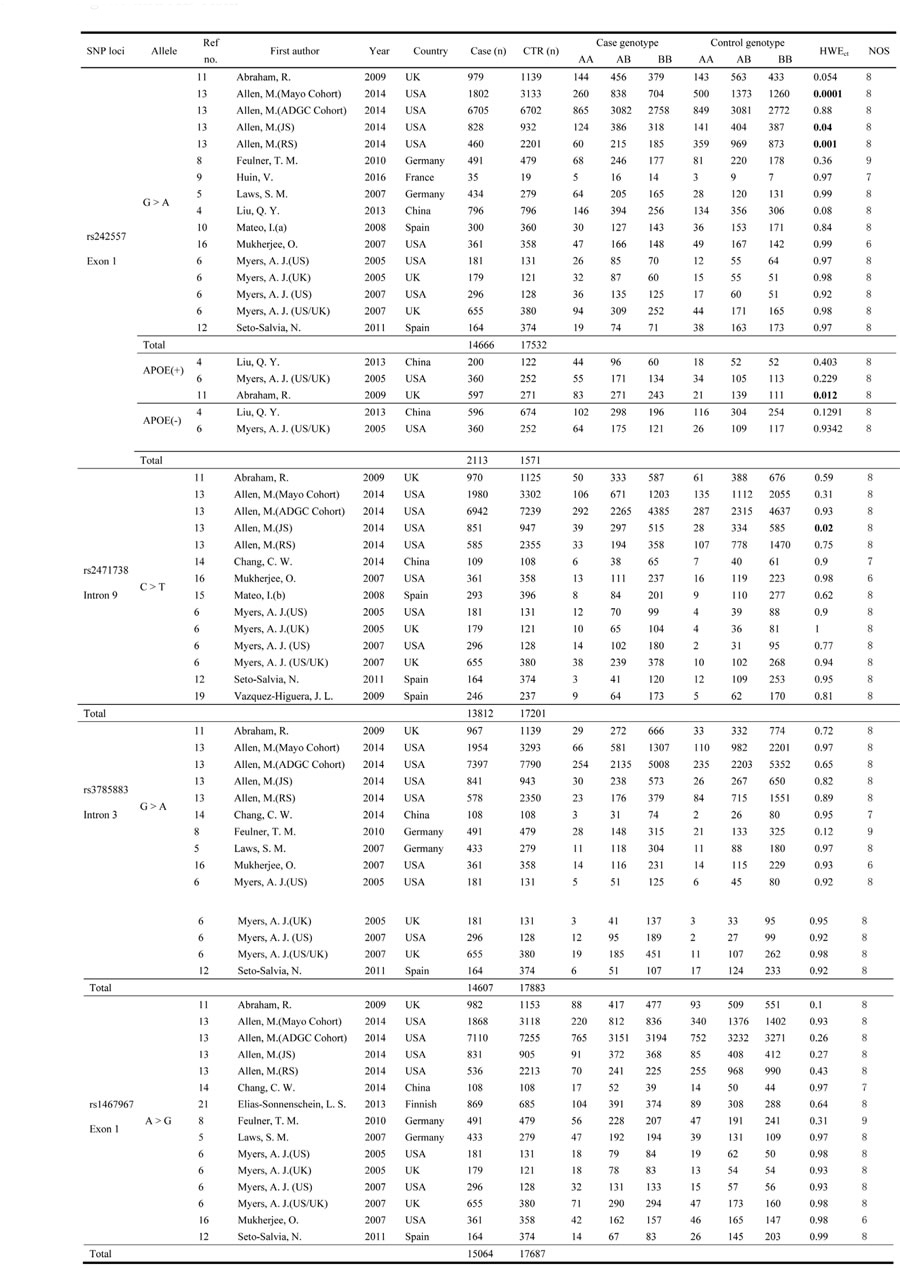
Abbreviations: Ref no: reference number; NOS, the Newcastle-Ottawa Scale; CTR, control; HWEct, Hardy-Weinberg Equilibrium in controls;
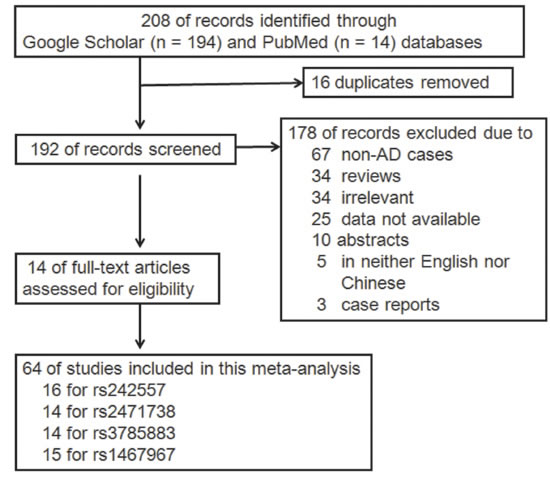
Figure 1: Flow diagram of study selection.
Heterogeneity test
The strength of the association was estimated in the allelic, dominant, recessive and additive models. The heterogeneity among studies was tested with Q statistic and further quantified by I2 statistic. As measured by the I2 (Table 2), in this meta-analysis no significant heterogeneity existed between studies under all the genetic models tested for rs242557 (the range of I2 values from 0 to 33.1%), rs3785883 (the range of I2 values from 0 to 29.1%), and rs1467967 (the range of I2 values from 0 to 17.5%). Therefore, the fixed-effect model (Mantel-Haenszel method) was used to calculate the pooled ORs. However, for rs2471738 there was significant heterogeneity observed between studies under the allelic and dominant models (I2 = 62.0 and 57.1 for the allelic and dominant genetic models, respectively). Therefore, the random-effect model (Inverse Variance method) was used to calculate the pooled ORs under allelic and dominant models (fixed-effect model for the recessive and additive genetic models).
Table 2: The genetic heterogeneity test.
Genetic model |
X2 |
p |
I2 (%) |
||||
rs242557 |
NO stratification |
Allelic |
A vs. G |
22.42 |
0.097 |
33.1 |
|
Dominant |
AA+AG vs. GG |
18.94 |
0.216 |
20.8 |
|||
Recessive |
AA vs. AG+GG |
18.50 |
0.237 |
18.9 |
|||
Additive |
AA vs. GG |
21.35 |
0.126 |
29.8 |
|||
Stratified by APOE ε4 allele |
Positive |
Allelic |
A vs. G |
1.87 |
0.393 |
0 |
|
negative |
Allelic |
A vs. G |
5.4 |
0.02 |
81.5 |
||
rs2471738 |
Allelic |
T vs. C |
34.21 |
0.001 |
62.0 |
||
Dominant |
TT+TC vs. CC |
30.32 |
0.004 |
57.1 |
|||
Recessive |
TT vs. TC+CC |
14.68 |
0.328 |
11.5 |
|||
Additive |
TT vs. CC |
18.39 |
0.143 |
29.3 |
|||
rs3785883 |
Allelic |
A vs. G |
18.33 |
0.146 |
29.1 |
||
Dominant |
AA+AG vs. GG |
16.29 |
0.234 |
20.2 |
|||
Recessive |
AA vs. AG+GG |
6.17 |
0.94 |
0 |
|||
Additive |
AA vs. GG |
7.97 |
0.846 |
0 |
|||
rs1467967 |
Allelic |
G vs. A |
16.96 |
0.258 |
17.5 |
||
Dominant |
GG+AG vs. AA |
15.12 |
0.37 |
7.4 |
|||
Recessive |
GG vs. AG+AA |
8.7 |
0.85 |
0 |
|||
Additive |
GG vs. AA |
13.19 |
0.512 |
0 |
|||
Meta-analysis results of the association between SNP rs242557 and AD risk
For rs242557 when the 16 studies were pooled into the meta-analysis using the fixed-effect model, a significant association was observed under the dominant (OR = 1.05, 95% CI = 1.01, 1.10, P = 0.025, Figure 3) model, and there was a trend under the allelic (OR = 1.03, 95% CI = 1.00, 1.06, P = 0.078, Figure 2) model. However, no significant association was found under the recessive (OR = 1.06, 95% CI = 0.95, 1.08, P = 0.766) and additive models (OR = 1.04, 95% CI = 0.97, 1.12, P = 0.223).
When stratified by APOE ε4 carrier status, the association between the rs242557 SNP and AD risk was observed to be stronger in the individuals with APOE ε4-positive genotype (with no heterogeneity, I2 = 0, OR = 1.24, 95% CI = 1.08, 1.43, P = 0.003) than without stratification (OR = 1.03, 95% CI = 1.00, 1.06, P = 0.078) under the allelic model. But for the individuals with APOE ε4-negative genotype (APOE ε4-), there was large heterogeneity (I2 = 81.5, Table 2) under the allelic model, and no significant association between the rs242557 SNP with AD risk (OR = 1.29, 95% CI = 0.93, 1.80, P = 0.132, Table 3, Figure 4).
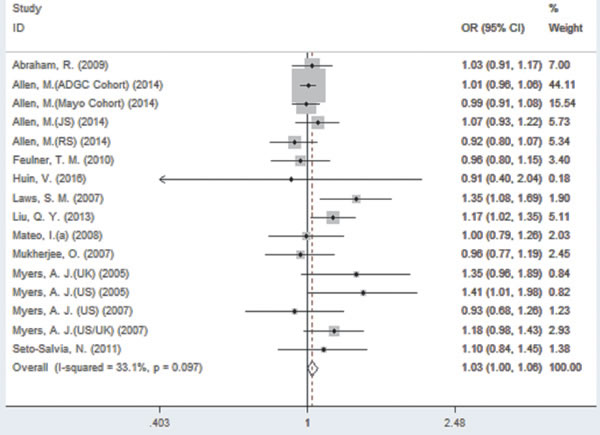
Figure 2: Forest plot for the meta-analysis of the association of SNP rs242557 and AD risk under the allelic model (A vs. G).
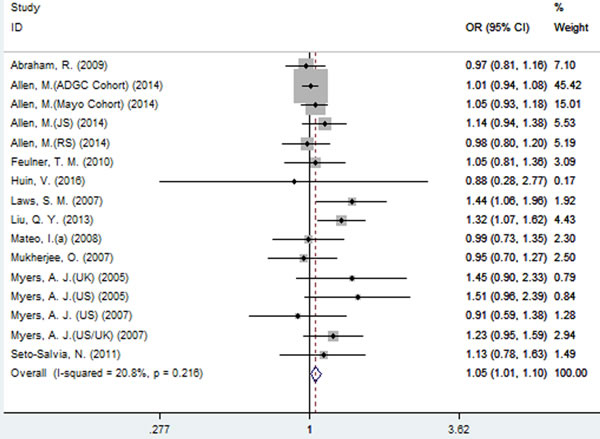
Figure 3: Forest plot for the meta-analysis of the association of SNP rs242557 and AD risk under the dominant model (AA + AG vs. GG).
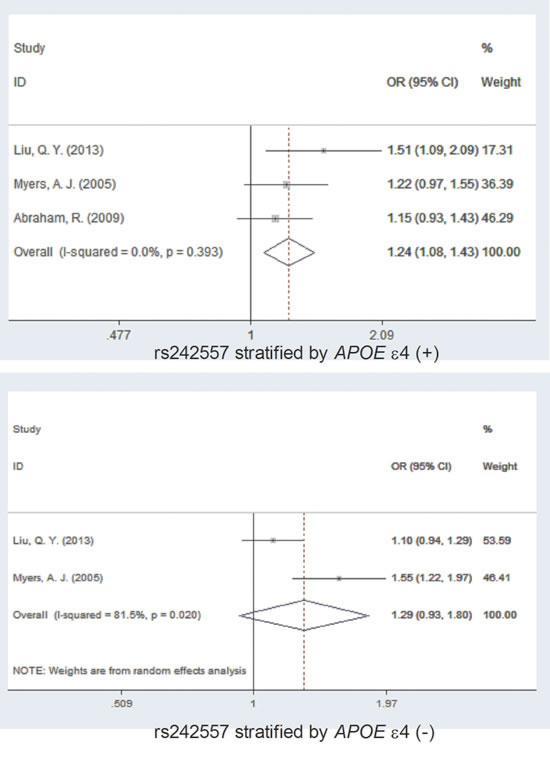
Figure 4: Forest plot for the meta-analysis of the association of SNP rs242557 and AD risk stratified by APOE ε4 allele status.
Meta-analysis results of the association between SNP rs2471738 and AD risk
A significant association between SNP rs2471738 and AD risk was identified under the allelic (random-effect, OR = 1.11, 95% CI = 1.01, 1.20, P = 0.021, Figure 5 and Table 3) and dominant (OR = 1.10, 95% CI = 1.00, 1.21, P = 0.046, Figure 6 and Table 3) models. A significant association between SNP rs2471738 and AD risk was also identified under the recessive (fixed-effect, OR = 1.18, 95% CI = 1.05, 1.32, P = 0.004, Figure 7 and Table 3) and additive (OR = 1.20, 95% CI = 1.07, 1.34, P = 0.002, Figure 8 and Table 3) models.
Table 3: The pooled results of the associations between these SNPs and AD risk as well as publication bias evaluation of the studies included.
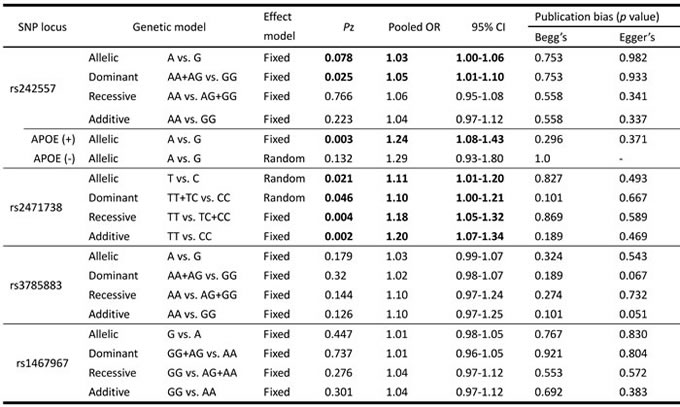
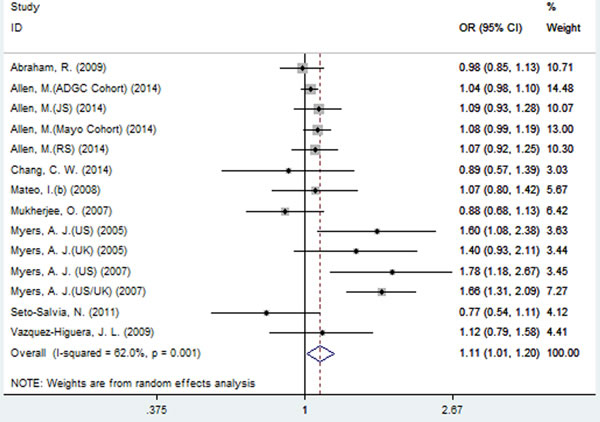
Figure 5: Forest plot for the meta-analysis of the association of SNP rs2471738 and AD risk under the allelic model (T vs. C).
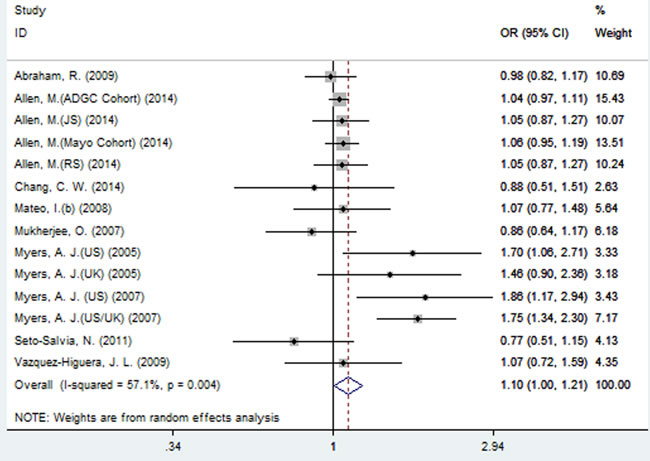
Figure 6: Forest plot for the meta-analysis of the association of SNP rs2471738 and AD risk under the dominant model (TT + TC vs. CC).
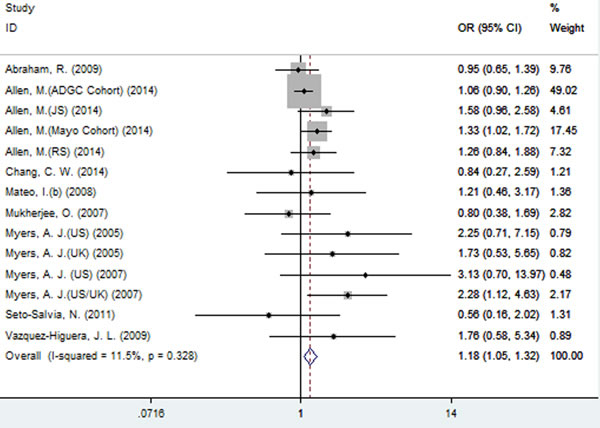
Figure 7: Forest plot for the meta-analysis of the association of SNP rs2471738 and AD risk under the recessive model (TT vs. CC + TC).
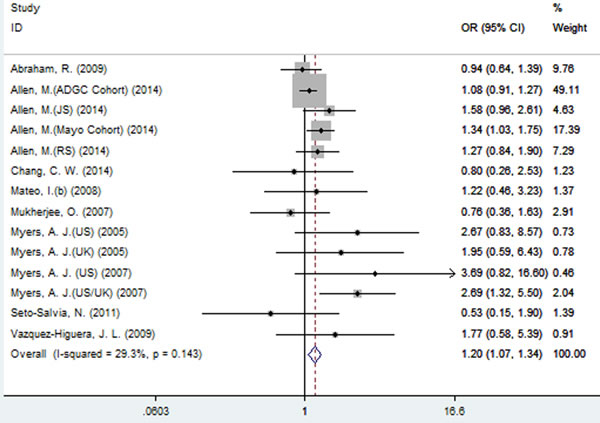
Figure 8: Forest plot for the meta-analysis of the association of SNP rs2471738 and AD risk under the additive model (TT vs. CC).
Meta-analysis results of the associations between SNPs rs3785883 and rs1467967 and AD risk
Using fixed-effect model, no significant association between SNP rs3785883 and AD risk was observed under all the four models (allelic: OR = 1.03, 95% CI = 0.99, 1.07, P = 0.179, Figure 9; dominant: OR = 1.02, 95% CI = 0.98, 1.07, P = 0.32; recessive: OR = 1.10, 95% CI = 0.97, 1.24, P = 0.144; additive: OR = 1.10, 95% CI = 0.97, 1.25, P = 0.126, Table 3).
Similarly, no significant association between SNP rs1467967 and AD risk was found under all the four models (fixed-effect, allelic: OR = 1.01, 95% CI = 0.98, 1.05, P = 0.449, Figure 10; dominant: OR = 1.01, 95% CI = 0.96, 1.05, P = 0.737; recessive: OR = 1.04, 95% CI = 0.97, 1.12, P = 0.276; additive: OR = 1.04, 95% CI = 0.97, 1.12, P = 0.301, Table 3).
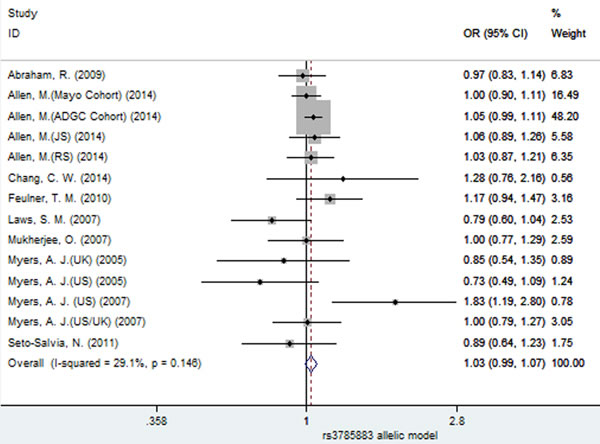
Figure 9: Forest plot for the meta-analysis of the association of SNP rs3785883 and AD risk under the allelic model (A vs. G).
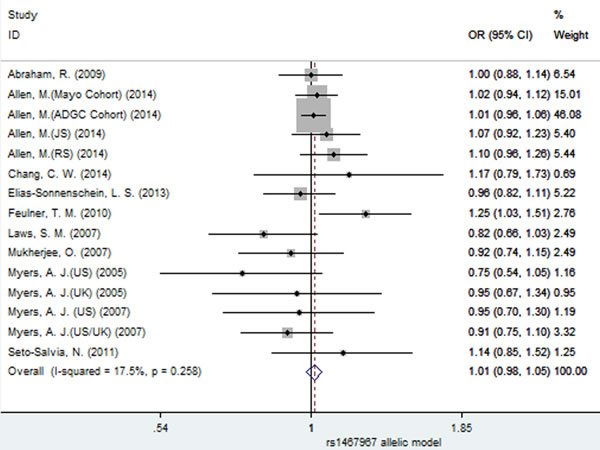
Figure 10: Forest plot for the meta-analysis of the association of SNP rs1467967 and AD risk under the allelic model (G vs. A).
Sensitivity analysis and evaluation of publication bias
Due to large heterogeneity between studies for rs2471738, we performed a sensitivity analysis by excluding a study [Allen, M. (JS), 2014; see Table 1] with departure from Hardy-Weinberg Equilibrium (HWE) in controls, we did not observe increased homogeneity across the rest studies (data not shown), suggesting that HWE deviation was not a source of between-study heterogeneity. The sensitivity analysis showed that for rs242557 and rs2471738 none of the studies included significantly changed the results under the allelic model (Figure 11A and 11B, respectively). The same results were observed for rs3785883/rs1467967 (Figure 12 A and 12B, respectively). Begg’s and Egger’s test were used to estimate the severity of publication bias with a P-value < 0.05 being considered statistically significant. No evidence of publication bias was found in any genetic model (Table 3).
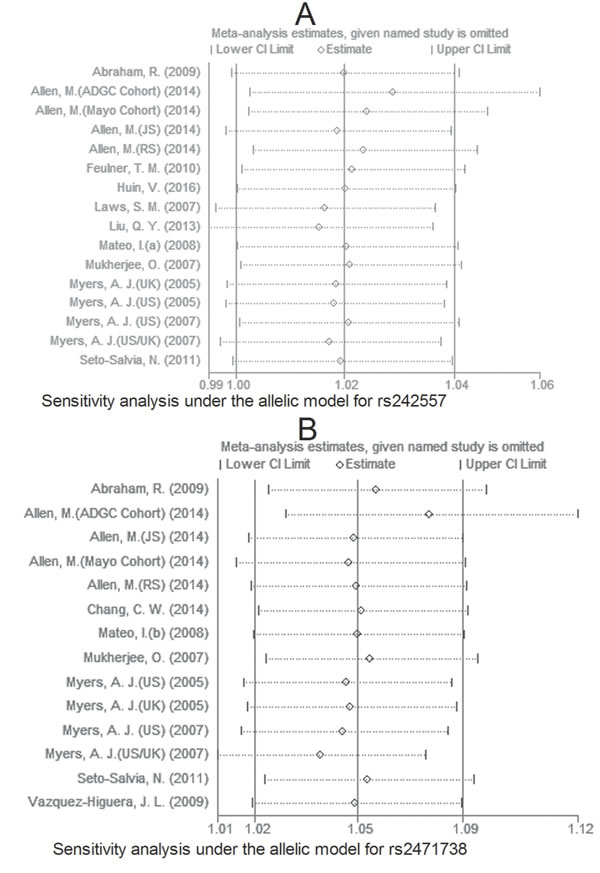
Figure 11: Sensitivity analysis for rs242557 A. and rs2471738 B. under the allelic model.
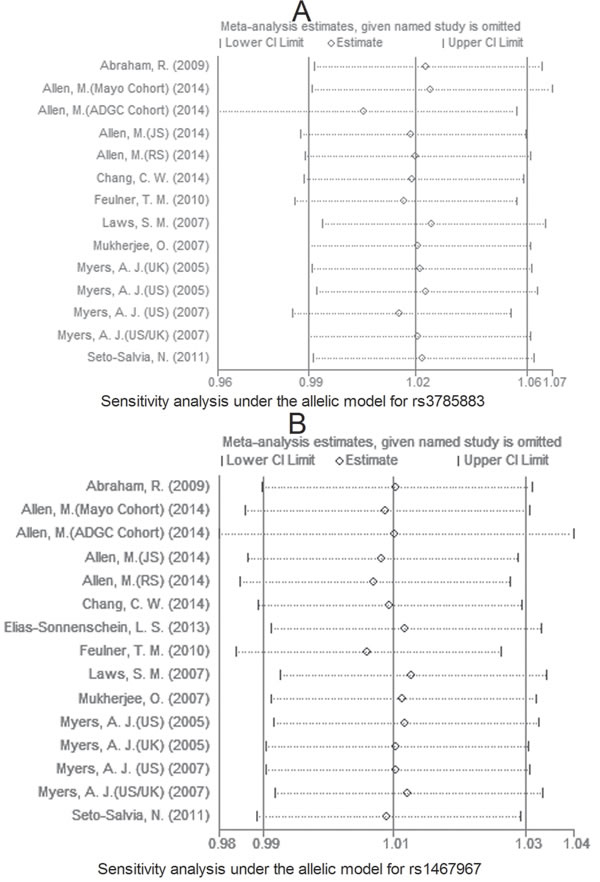
Figure 12: Sensitivity analysis for rs3785883 A. and rs1467967 B. under the allelic model.
DISCUSSION
Tau protein is specifically expressed in neurons, directly interacts with tubulin and mediates its assembly [18]. It was found that the MAPT rs242557 (within exon 1) SNP was significantly associated with late-onset AD in 1592 Han Chinese subjects [4], in the German population [5] and in the US series [7]. However, it was reported that this SNP was not significantly associated with AD risk [10, 11] in the UK series [7]. For the rs2471738 (within intron 9) SNP, study findings revealed that there was significant association in the US series [6, 7] and US/UK series [6], or no [19] in 293 AD patients and 396 healthy controls [15], in 361 AD patients and 358 controls [16]. For the rs3785883 (within intron 3) SNP, it was found that there was significant association [13], or no [5, 14, 20]. For the rs1467967 (within exon 1) SNP, it was showed that there was significant association [5], or no [7, 11, 21]. There were consistent results on the association between the rs7521 [6, 7, 11, 22] and rs9468 [11] (too little data) SNPs and AD risk. Thus, these four SNPs of the MAPT gene were a matter of controversy.
Therefore, we conducted this meta-analysis to explore the association between the MAPT SNPs and AD risk. In summary, results from this meta-analysis suggest that of these SNPs tested, rs242557 is significantly associated with increased AD risk under the dominant genetic model, and the rs2471738 SNP is significantly associated with increased AD risk under all the four genetic model. In the stratified analysis by APOE ε4 allele status, APOE ε4 allele carriers, but not APOE ε4 allele non-carriers, were showed to be significantly associated with increased AD risk. This result indicates that there appears to be a gene-gene interaction between the APOE and the MAPT genes, which could increase susceptibility to AD. More studies should, however, be conducted to assess the interaction.
Because of the moderate heterogeneity, we conducted sensitivity analyses to evaluate the effects of each study on the combined ORs by sequential removal of each eligible study. The sensitivity analysis showed that none of these studies changed the significance of the combined ORs under the allelic model. It was showed that Allele A of rs242557 with the H1p promoter variant had 2.7-fold greater transcriptional activity than allele G with the H1p promoter variant and 4.2-fold greater than allele G with the H2p promoter variant. The H1 haplotype increases the expression of total MAPT transcript [6]; allele A (AA + AG) of rs242557 was associated with CSF total tau levels elevated levels compared to non-carriers (GG) [5], indicating that SNP rs242557 might be associated with the increased expression levels of tau protein. Trabzuni, D. et al [23]. found that the H1c haplotype (tagged by rs242557) was not significantly associated with increased mRNA expression of the MAPT, suggesting that there are other things about possible consequence of this SNP on the MAPT, which is needed for further investigations. In the current meta-analysis, SNP rs3785883 was found not to be associated with AD risk under all the genetic models; in AD cases, however, there was higher levels of Total tau mRNA in those individuals who carry rs3785883 minor allele (AA or AG) than those with non-carriers (GG) with evidence of beta-amyloid deposition [24], suggesting that SNP rs3785883, which changes the expression of the marker protein of AD, but is not associated with AD risk, might be an complicated SNP of the MAPT gene.
There are some limitations to this meta-analysis. First, the total number of studies was not large enough for such analyses to give meaningful interpretation, and only published studies were included in the meta-analysis. To be made, however, this approach requires the authors of all of the studies to share their data. Second, there was evidence of moderate heterogeneity between studies, in particularly for rs2471738. Third, the present meta-analysis failed to consider the possibility of gene-gene or SNP-SNP interactions in which further investigations are needed. So it is quite important to have more studies and sample in the future so that more precise conclusion about the association between the SNPs of the MAPT gene and AD risk could be achieved.
In conclusion, our meta-analysis confirmed the following: SNPs rs242557 and rs2471738 might be associated with increased AD risk, but rs3785883 and rs1467967 not. More well-conducted studies with larger sample size are needed to confirm our conclusion.
MATERIALS AND METHODS
Search strategies
All of the potential eligible studies were screened based on the electronic databases (PubMed and Google Scholar) up to 1st Jun. 2017. Systematic searching was performed using the combination of “Alzheimer*”, “rs242557 OR rs3785883 OR rs2471738 OR rs1467967 OR rs75721 OR rs9468”.
Inclusion and exclusion criteria
Only studies published as full-length articles in peer-reviewed journals were considered in the analysis. The eligible studies must satisfy the following inclusion criteria: i) concerning the association between the MAPT gene (including SNPs rs242557, rs3785883, rs2471738, rs1467967, rs75721 and rs9468) and AD risk; ii) case-control study design; iii) sufficient information accessible (e.g. sample size for each study, allele or genotype frequencies of these SNPs); iv) cases meeting the clinical criteria for AD. The exclusion criteria include: a duplicated publication; a review; a case report; not reported the genotype frequencies; non-AD cases, a review; an irrelevant study; datum not available; an abstract; in neither English nor Chinese; inconsistent with most studies in major allele size.
Data extraction
Data extracted from the included studies were as follows: first author, year of publication, country, sample size of cases and controls, numbers of case and control genotypes, p-value for HWE in controls and Newcastle-Ottawa Scale (NOS) Quality Assessment Scale. The inclusion/exclusion criteria were applied by 2 (ZFT and WDL) independent reviewers. We used the NOS to assess the quality of the included studies. A quality score was calculated based on three major components. Each component of the criteria scored 1 if present or 0 if absent. The scores were summed and a higher score represents better methodological quality.
Meta-analysis
All statistical analyses were performed using Stata software (College Station, TX). The association between the MAPT SNPs and AD risk was evaluated by pooled ORs and corresponding 95% CIs. Four genetic models, including allelic (G vs. A), dominant (AA + AG vs. GG), recessive (AA vs. AG + GG) and additive (AA vs. GG), were used to estimate this association. Sensitivity analyses were performed to determine whether undue influence of a single study was present. The possibility of publication bias was assessed by Begg’s and Egger’s test (P < 0.05 was considered as representative of statistically significant publication bias).
ACKNOWLEDGMENTS
The research was supported by Zhejiang Provincial Natural Science Foundation of China under Grant No. LY15H090013 and Project of Public Welfare Technology and Applications of Lishui City under Grant No. 2016GYX26.
CONFLICTs OF INTEREST
The authors declare that they have no conflict of interests.
REFERENCES
1. Giacobini E, Gold G. Alzheimer disease therapy—moving from amyloid-beta to tau. Nat Rev Neurol. 2013; 9:677-686.
2. Scheltens P, Blennow K, Breteler MM, de Strooper B, Frisoni GB, Salloway S, Van der Flier WM. Alzheimer’s disease. The Lancet. 2016; 388:505-517.
3. Spillantini MG, Goedert M. Tau pathology and neurodegeneration. Lancet Neurol. 2013; 12:609-622.
4. Liu QY, Yu JT, Miao D, Ma XY, Wang HF, Wang W, Tan L. An exploratory study on STX6, MOBP, MAPT, and EIF2AK3 and late-onset Alzheimer’s disease. Neurobiol Aging. 2013; 34:1513-1519.
5. Laws SM, Friedrich P, Diehl-Schmid J, Muller J, Eisele T, Bauml J, Forstl H, Kurz A, Riemenschneider M. Fine mapping of the MAPT locus using quantitative trait analysis identifies possible causal variants in Alzheimer’s disease. Mol Psychiatry. 2007; 12:510-517.
6. Myers AJ, Pittman AM, Zhao AS, Rohrer K, Kaleem M, Marlowe L, Lees A, Leung D, McKeith IG, Perry RH, Morris CM, Trojanowski JQ, Clark C, et al. The MAPT H1c risk haplotype is associated with increased expression of tau and especially of 4 repeat containing transcripts. Neurobiol Dis. 2007; 25:561-570.
7. Myers AJ, Kaleem M, Marlowe L, Pittman AM, Lees AJ, Fung HC, Duckworth J, Leung D, Gibson A, Morris CM, de Silva R, Hardy J. The H1c haplotype at the MAPT locus is associated with Alzheimer’s disease. Hum Mol Genet. 2005; 14:2399-2404.
8. Feulner TM, Laws SM, Friedrich P, Wagenpfeil S, Wurst SH, Riehle C, Kuhn KA, Krawczak M, Schreiber S, Nikolaus S, Forstl H, Kurz A, Riemenschneider M. Examination of the current top candidate genes for AD in a genome-wide association study. Mol Psychiatry. 2010; 15:756-766.
9. Huin V, Deramecourt V, Caparros-Lefebvre D, Maurage CA, Duyckaerts C, Kovari E, Pasquier F, Buee-Scherrer V, Labreuche J, Behal H, Buee L, Dhaenens CM, Sablonniere B. The MAPT gene is differentially methylated in the progressive supranuclear palsy brain. Mov Disord. 2016; 31:1883-1890.
10. Mateo I, Sanchez-Juan P, Rodriguez-Rodriguez E, Infante J, Vazquez-Higuera JL, Garcia-Gorostiaga I, Berciano J, Combarros O. Synergistic effect of heme oxygenase-1 and tau genetic variants on Alzheimer’s disease risk. Dement Geriatr Cogn Disord. 2008; 26:339-342.
11. Abraham R, Sims R, Carroll L, Hollingworth P, O’Donovan MC, Williams J, Owen MJ. An association study of common variation at the MAPT locus with late-onset Alzheimer’s disease. Am J Med Genet B Neuropsychiatr Genet. 2009; 150B:1152-1155.
12. Seto-Salvia N, Clarimon J, Pagonabarraga J, Pascual-Sedano B, Campolongo A, Combarros O, Mateo JI, Regana D, Martinez-Corral M, Marquie M, Alcolea D, Suarez-Calvet M, Molina-Porcel L, et al. Dementia risk in Parkinson disease: disentangling the role of MAPT haplotypes. Arch Neurol. 2011; 68:359-364.
13. Allen M, Kachadoorian M, Quicksall Z, Zou F, Chai HS, Younkin C, Crook JE, Pankratz VS, Carrasquillo MM, Krishnan S, Nguyen T, Ma L, Malphrus K, et al. Association of MAPT haplotypes with Alzheimer’s disease risk and MAPT brain gene expression levels. Alzheimers Res Ther. 2014; 6:39.
14. Chang CW, Hsu WC, Pittman A, Wu YR, Hardy J, Fung HC. Structural study of the microtubule-associated protein tau locus of Alzheimer’s disease in Taiwan. Biomed J. 2014; 37:127-132.
15. Mateo I, Sanchez-Juan P, Rodriguez-Rodriguez E, Infante J, Fernandez-Viadero C, Pena N, Berciano J, Combarros O. 14-3-3 zeta and tau genes interactively decrease Alzheimer’s disease risk. Dement Geriatr Cogn Disord. 2008; 25:317-320.
16. Mukherjee O, Kauwe JS, Mayo K, Morris JC, Goate AM. Haplotype-based association analysis of the MAPT locus in late onset Alzheimer’s disease. BMC Med Genet. 2007; 8:3.
17. Wider C, Ross OA, Nishioka K, Heckman MG, Vilarino-Guell C, Jasinska-Myga B, Erketin-Taner N, Rademakers R, Graff-Radford NR, Mash DC, Papapetropoulos S, Duara R, Uchikado H, et al. An evaluation of the impact of MAPT, SNCA and APOE on the burden of Alzheimer’s and Lewy body pathology. J Neurol Neurosurg Psychiatry. 2012; 83:424-429.
18. Zhou F, Chen S, Xiong J, Li Y, Qu L. Luteolin Reduces Zinc-Induced Tau Phosphorylation at Ser262/356 in an ROS-Dependent Manner in SH-SY5Y Cells. Biol Trace Elem Res. 2012; 149:273-279.
19. Vazquez-Higuera JL, Mateo I, Sanchez-Juan P, Rodriguez-Rodriguez E, Pozueta A, Infante J, Berciano J, Combarros O. Genetic interaction between tau and the apolipoprotein E receptor LRP1 Increases Alzheimer’s disease risk. Dement Geriatr Cogn Disord. 2009; 28:116-120.
20. Peterson D, Munger C, Crowley J, Corcoran C, Cruchaga C, Goate AM, Norton MC, Green RC, Munger RG, Breitner JC, Welsh-Bohmer KA, Lyketsos C, Tschanz J, et al. Variants in PPP3R1 and MAPT are associated with more rapid functional decline in Alzheimer’s disease: the Cache County Dementia Progression Study. Alzheimers Dement. 2014; 10:366-371.
21. Elias-Sonnenschein LS, Helisalmi S, Natunen T, Hall A, Paajanen T, Herukka SK, Laitinen M, Remes AM, Koivisto AM, Mattila KM, Lehtimaki T, Verhey FR, Visser PJ, et al. Genetic loci associated with Alzheimer’s disease and cerebrospinal fluid biomarkers in a Finnish case-control cohort. PLoS One. 2013; 8:e59676.
22. Seshadri S, Fitzpatrick AL, Ikram MA, DeStefano AL, Gudnason V, Boada M, Bis JC, Smith AV, Carassquillo MM, Lambert JC, Harold D, Schrijvers EM, Ramirez-Lorca R, et al. Genome-wide analysis of genetic loci associated with Alzheimer disease. JAMA. 2010; 303:1832-1840.
23. Trabzuni D, Wray S, Vandrovcova J, Ramasamy A, Walker R, Smith C, Luk C, Gibbs JR, Dillman A, Hernandez DG, Arepalli S, Singleton AB, Cookson MR, et al. MAPT expression and splicing is differentially regulated by brain region: relation to genotype and implication for tauopathies. Hum Mol Genet. 2012; 21:4094-4103.
24. Kauwe JS, Cruchaga C, Mayo K, Fenoglio C, Bertelsen S, Nowotny P, Galimberti D, Scarpini E, Morris JC, Fagan AM, Holtzman DM, Goate AM. Variation in MAPT is associated with cerebrospinal fluid tau levels in the presence of amyloid-beta deposition. Proc Natl Acad Sci U S A. 2008; 105:8050-8054.