
Introduction
Colorectal cancer (CRC) is one of the most commonly diagnosed malignancies and a major cause of cancer-associated mortality all over the world [1]. The most reliable procedure for diagnosis is mainly based on colonoscopy, which is invasive and unpleasant for patients to undergo [2]. There is thus an urgent need for a noninvasive biomarker that can detect CRC with high precision. In addition, the mortality of CRC remains high due to the late diagnosis or lack of an effective therapeutic option [3, 4]. No effective prognostic molecular marker that can predict the clinical outcome and then provide guidance for treatment selection has been developed [5]. Consequently, there is a great need to explore new efficient methods for CRC diagnosis along with prognosis.
MicroRNAs (miRNAs) are small, endogenous, noncoding RNAs that can regulate the expression of genes at the post-transcriptional level [6]. Increasing evidence has demonstrated that miRNAs play vital roles in multiple biological processes, such as cell growth, differentiation, apoptosis, invasion, and metastasis [7]. Given their critical involvement in the development of tumors via oncogenic or tumor-suppressive properties, altered profiles of miRNAs have been shown to be related to carcinogenesis and tumor progression [8]. Hence, miRNAs may be useful biomarkers in the early detection of cancer and for predicting therapeutic efficacy as well as prognosis [9, 10].
miR-21 stands out as the most representative miRNA biomarker as it has been extensively explored in a range of studies on numerous cancers [11]. Considerable research has been conducted on the use of miR-21 expression to distinguish between CRC patients and normal controls for a range of different sample sourceses, suggesting the great promise of miR-21 as a novel biomarker in screening CRC. Meanwhile, substantial evidence has also revealed that miR-21 might be a useful predictor of the clinical outcome as its expression level is significantly related to the prognosis of CRC patients.
However, the results of studies on miR-21 reported to date remain inconclusive, which may be due to small sample sizes, different disease statuses, different sample sources, different detection methods, and other uncontrolled factors. Although several published meta-analyses have been conducted in response to these conflicting results, there are still limitations to the obtained findings. Most meta-analyses merely focused on the utility of miR-21 as a potential marker in the diagnosis or prognosis of CRC [12-16]. In addition, they separately investigated the value of diagnosis or prognosis in serum, plasma, or feces [12, 13, 15, 17]. Furthermore, some of them were conducted using a relatively small number of studies [12, 14-18]. Moreover, ignoring the heterogenicity in different microRNAs or different cancer types, many researchers merged miR-21 with various other microRNAs to draw conclusions on the value of all microRNAs in CRC [19-22], while some investigators included studies of miR-21 for CRC along with studies for various other cancers to determine the value of miR-21 in cancer [17, 23-28], which discussed too little in our concerned topic. Finally, most of the published meta-analyses focused on the miR-21 biomarker alone [12, 13, 15-18], although systematic meta-analyses that evaluate combinations of biomarkers may provide more useful information about the potential value of future biomarkers. Combined biomarkers or combination biomarkers, which are combinations of several markers, have been shown to improve the prediction accuracy compared with a single biomarker [29, 30] and were thus identified as having great potential for the diagnosis or prognosis of CRC.
Considering the limits of existing publications, we conducted a more integrative meta-analysis of miR-21 for CRC based on all relevant reported studies to obtain a better understanding of the diagnostic and prognostic efficiency of miR-21 in CRC. Furthermore, by focusing not only on a single biomarker, we discussed whether combination markers are more effective than individual ones.
Results
Selection of studies
The flow diagram for the literature search is presented in Figure 1. The initial search from the selected literature databases and other sources returned a total of 968 articles. After careful exclusion of inappropriate ones in each step, 57 published studies were finally included in this meta-analysis, including 25 studies for diagnostic meta-analysis and 32 for prognostic meta-analysis. Among the studies for diagnosis, 16 studies were about miR-21 alone [18, 31-42] and 9 were about miR-21-related combination markers [31, 32, 35, 36, 43, 44]. With respect to prognosis, 10 studies were connected with disease-free survival (DFS) [45-51] and 22 were related to overall survival (OS) [18, 36, 37, 45-47, 49-59].
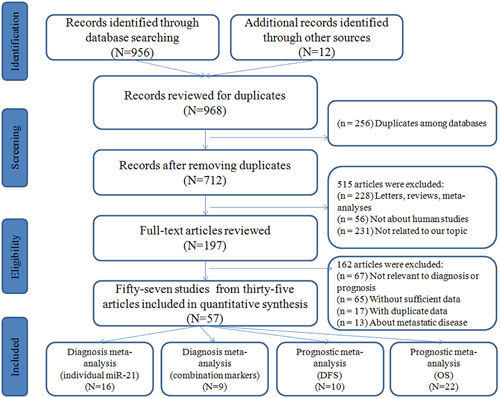
Figure 1: Flow diagram of the study selection process.
Diagnostic meta-analysis
Diagnostic meta-analysis of miR-21 alone in CRC
Study characteristics and quality assessment
A total of 15 publications on 16 studies involving 1270 cases and 944 controls were analyzed. The main features of all of the 16 included studies are shown in Table 1A. The expression of miR-21 was detected using quantitative real-time reverse transcription PCR (qRT-PCR) in all studies. A total of 11 studies were performed on Asian populations and 5 on Caucasian ones. Sample sources were classified as serum (n = 5), plasma (n = 6), feces (n = 4), and tissue (n = 1). Assessments of the quality of these studies are also given in Table 1A, suggesting that overall they were of moderate to high quality.
Table 1A: The main features of the included studies on individual miR-21
Author |
Year |
Country |
Ethnicity |
Case/Control |
Sample |
AUC |
Se |
Sp |
QUADAS |
Koga et al |
2010 |
Japan |
Asian |
197/119 |
Feces |
Na |
14.7% |
91.6% |
4 |
Wu et al |
2010 |
China |
Asian |
27/48 |
Feces |
Na |
50.0% |
83.0% |
4 |
Wu et al |
2012 |
China |
Asian |
88/101 |
Feces |
0.64 |
55.7% |
73.3% |
4 |
Kanaan et al |
2012 |
America |
Caucasian |
30/30 |
Plasma |
0.820 |
90.0% |
90.0% |
4 |
Kanaan et al |
2012 |
America |
Caucasian |
20/20 |
Plasma |
0.910 |
81.0% |
94.0% |
4 |
Wang et al |
2012 |
China |
Asian |
32/39 |
Serum |
0.85 |
87.5% |
74.4% |
5 |
Kuriyama et al |
2012 |
Japan |
Asian |
138/126 |
Feces |
0.80 |
39.0% |
97.6% |
6 |
Luo et al |
2013 |
Germany |
Caucasian |
80/144 |
Plasma |
0.653 |
51.7% |
80.7% |
3 |
Liu et al |
2013 |
China |
Asian |
200/80 |
Serum |
0.802 |
65.0% |
85.0% |
6 |
Toiyama et al |
2013 |
Japan |
Asian |
186/53 |
Serum |
0.927 |
82.8% |
90.6% |
5 |
Kawata et al |
2014 |
Japan |
Asian |
88/11 |
Serum |
0.798 |
61.4% |
90.9% |
5 |
Zhang et al |
2014 |
China |
Asian |
41/30 |
Plasma |
0.657 |
51.2% |
79.0% |
6 |
Zanutto et al |
2014 |
Italy |
Caucasian |
29/29 |
Plasma |
0.647 |
58.0% |
58.0% |
5 |
Basati et al |
2014 |
Iran |
Asian |
40/40 |
Serum |
0.87 |
77.0% |
78.0% |
5 |
Omrane et al |
2014 |
France |
Caucasian |
25/25 |
Tissue |
0.746 |
68.0% |
72.0% |
4 |
Du et al |
2014 |
China |
Asian |
49/49 |
Plasma |
0.877 |
76.2% |
93.2% |
5 |
Diagnostic accuracy of l miR-21 alone in CRC
Forest plots for the enrolled studies on the pooled sensitivity and specificity are shown in Figure 2. Significant heterogeneity was observed between studies for the high I2 values in sensitivity (94.58%) and specificity (84.41%). The overall combined sensitivity, specificity, and the diagnostic odds ratio (DOR) were 0.64 (95% CI: 0.53-0.74), 0.85 (0.79-0.90), and 10.33 (5.85-18.24), respectively. The DOR value meant that someone who was found to be positive for CRC with a high level of miR-21 had a 10.33-fold higher chance ofactually sufferring from CRC compared with someone with a negative CRC result. The summary receiver operator characteristic (SROC) curve (Figure 4A) was plotted and the corresponding area under the SROC curve (AUC) was calculated to be 0.85 (0.81-0.87), revealing moderate diagnostic accuracy overall.
The pooled positive likelihood ratio (PLR) and negative likelihood ratio (NLR), which are deemed to be more valuable than sensitivity or specificity for clinical applications, were also calculated, the results for which were 4.33 (3.04-6.17) and 0.42 (0.31-0.57), respectively. The combined PLR indicated that patients with CRC had a nearly four-fold greater chance of having an elevated miR-21 compared with patients without CRC. The pooled NLR meant that the probability of the patient having CRC is 42% if the miR-21 is negative.
Table 1B: The main features of the included studies on miR-21-related combination markers
Author |
Year |
Country |
Ethnicity |
Case/ Control |
Sample |
miRNA list |
AUC |
Se |
Sp |
QUADAS |
Wu et al |
2010 |
China |
Asian |
27/48 |
Feces |
miR-21,miR-92 |
Na |
65.0% |
70.0% |
3 |
Wu et al |
2010 |
China |
Asian |
32/26 |
Feces |
miR-21,miR-92 |
Na |
63.0% |
54.0% |
3 |
Koga et al |
2010 |
Japan |
Asian |
197/119 |
Feces |
miR-21, miR-17-92, miR-135 |
Na |
74.1% |
79.0% |
3 |
Wu et al |
2012 |
China |
Asian |
88/101 |
Feces |
miR-21,miR-92a |
Na |
81.8% |
57.4% |
4 |
Kanaan et al |
2012 |
America |
Caucasian |
15/26 |
Plasma |
miR-21,miR-331, miR-15b |
Na |
93.0% |
74.0% |
4 |
Liu et al |
2013 |
China |
Asian |
200/80 |
Serum |
miR-21,miR-92 |
0.847 |
68.0% |
91.2% |
5 |
Luo et al |
2013 |
Germany |
Caucasian |
80/144 |
Plasma |
miR panels |
0.745 |
71.8% |
75.0% |
4 |
Wang et al |
2014 |
China |
Asian |
30/30 |
Serum |
miR-21, let-7g, miR-31, miR-92a, miR-181b, miR-203 |
0.900 |
83.3% |
96.7% |
5 |
Wang et al |
2014 |
China |
Asian |
83/59 |
Serum |
miR-21, let-7g, miR-31, miR-92a, miR-181b, miR-203 |
0.923 |
96.4% |
88.1% |
5 |
Table 1C: The main features of the included studies for the prognostic meta-analysis
Author |
Year |
Country |
Ethnicity |
Type |
Sample |
N |
Age |
Stage |
Survival results |
Follow-up(months) |
HR (95% CI) |
Kulda et al |
2010 |
Czech |
Caucasian |
CRC |
tissue |
46 |
62.8 |
I-IV |
DFS |
45.2 |
1.88(0.74,4.77) |
Shibuya et al |
2010 |
Japan |
Asian |
CRC |
tissue |
156 |
65 |
I-IV |
DFS |
44 |
2.81(1.53,5.14) |
Nielsen et al |
2011 |
Denmark |
Caucasian |
CC |
tissue |
129 |
70 |
II |
DFS |
≧60 |
1.28(1.06,1.55) |
Nielsen et al |
2011 |
Denmark |
Caucasian |
RC |
tissue |
67 |
70 |
II |
DFS |
≧60 |
0.96(0.81,1.15) |
Zhang et al |
2013 |
China |
Asian |
CC |
tissue |
138 |
65 |
II |
DFS |
66 |
1.98(0.95,4.15) |
Zhang et al |
2013 |
China |
Asian |
CC |
tissue |
137 |
65 |
II |
DFS |
66 |
1.88(0.95,3.75) |
Zhang et al |
2013 |
China |
Asian |
CC |
tissue |
460 |
65 |
II |
DFS |
66 |
1.79(1.22,2.62) |
Menendez et al |
2013 |
Spain |
Caucasian |
CRC |
Serum |
102 |
71.6 |
I-IV |
DFS |
23 |
0.51(0.25,1.06) |
Fukushima et al |
2015 |
Japan |
Asian |
CRC |
tissue |
306 |
65 |
I-IV |
DFS |
48 |
2.94(1.68,5.36) |
Bullock et al |
2015 |
UK |
Caucasian |
CRC |
tissue |
50 |
72 |
I-IV |
DFS |
73 |
2.68(1.21,5.93) |
Schetter et al |
2008 |
America |
Caucasian |
CC |
tissue |
71 |
64.4 |
I-IV |
OS |
80 |
2.70(1.30,5.50) |
Schetter et al |
2008 |
China |
Asian |
CC |
tissue |
103 |
55.8 |
I-IV |
OS |
84.6 |
2.40(1.40,4.10) |
Kulda et al |
2010 |
Czech |
Caucasian |
CRC |
tissue |
46 |
62.8 |
I-IV |
OS |
45.2 |
0.15(0.02,1.33) |
Shibuya et al |
2010 |
Japan |
Asian |
CRC |
tissue |
156 |
65 |
I-IV |
OS |
44 |
2.69(1.70,4.25) |
Nielsen et al |
2011 |
Denmark |
Caucasian |
CC |
tissue |
129 |
70 |
II |
OS |
≧60 |
1.17(1.02,1.34) |
Nielsen et al |
2011 |
Denmark |
Caucasian |
RC |
tissue |
67 |
70 |
II |
OS |
≧60 |
0.97(0.83,1.13) |
Faltejskova et al |
2012 |
Czech |
Caucasian |
CRC |
tissue |
44 |
67 |
I-IV |
OS |
84 |
1.81(0.56,5.83) |
Frifeldt et al |
2012 |
Denmark |
Caucasian |
CC |
tissue |
520 |
71.9 |
II |
OS |
84 |
1.08(0.97,1.22) |
Zhang et al |
2013 |
China |
Asian |
CRC |
tissue |
79 |
62.9 |
I-IV |
OS |
65.9 |
1.92(0.74,4.97) |
Menendez et al |
2013 |
Spain |
Caucasian |
CRC |
Serum |
102 |
71.6 |
I-IV |
OS |
23 |
0.50(0.25,1.02) |
Liu et al |
2013 |
China |
Asian |
CRC |
Serum |
166 |
57.09 |
I-IV |
OS |
36.4 |
1.58(0.77-3.21) |
Toiyama et al |
2013 |
Japan |
Asian |
CRC |
tissue |
153 |
67.5 |
I-IV |
OS |
44 |
0.59(0.21,1.63) |
Toiyama et al |
2013 |
Japan |
Asian |
CRC |
Serum |
153 |
67.5 |
I-IV |
OS |
44 |
4.12(1.10,15.4) |
Chen et al |
2013 |
China |
Asian |
CRC |
tissue |
195 |
66 |
I-IV |
OS |
60 |
2.56(1.43,4.57) |
Bovell et al |
2013 |
America |
Caucasian |
CRC |
tissue |
55 |
65 |
IV |
OS |
198 |
3.25(1.37,7.72) |
Oue et al |
2014 |
Japan |
Asian |
CC |
tissue |
87 |
63 |
II-III |
OS |
54 |
3.13(1.20,8.17) |
Oue et al |
2014 |
Genmany |
Caucasian |
CC |
tissue |
145 |
70 |
II |
OS |
51.6 |
2.65(1.06,6.66) |
Hansen et al |
2014 |
Denmark |
Caucasian |
CC |
tissue |
554 |
74 |
II-IV |
OS |
60 |
1.08(0.89,1.30) |
Fukushima et al |
2015 |
Japan |
Asian |
CRC |
tissue |
306 |
65 |
I-IV |
OS |
48 |
2.88(1.70,5.08) |
Bullock et al |
2015 |
UK |
Caucasian |
CRC |
tissue |
50 |
72 |
I-IV |
OS |
73 |
2.47(1.19,5.55) |
Kang et al |
2015 |
Korea |
Asian |
CC |
tissue |
173 |
63 |
II-III |
OS |
80 |
0.43(0.14,1.27) |
Kang et al |
2015 |
Korea |
Asian |
RC |
tissue |
104 |
63 |
II-III |
OS |
80 |
2.05(0.56,7.51) |
AUC: area under the curve; Se: sensitivity; Sp: specificity; QUADAS: quality assessment of diagnostic accuracy studies. This scoring system comprises seven questions, requiring an answer of “yes,” “no,” or “unclear.”
An answer of “yes” gets a score of 1, while an answer of “no” or “unclear” gets a score of 0; miR panels: miR-18a, miR-20a, miR-21, miR-29a, miR-92a, miR-106b, miR-133a, miR-143, miR-145, miR-342-3p, miR-532-3p, miR-181b; NA: not available; N: number of participants; DFS: disease-free survival; OS: overall survival; HR: hazard ratio; 95% CI: 95% confidence interval.
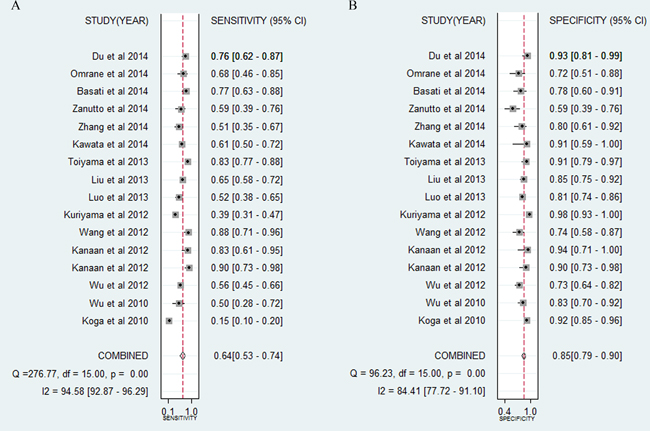
Figure 2: Forest plots of sensitivities and specificities of individual miR-21 in the diagnosis of CRC.
Threshold effect
The threshold effect has been considered to result from the differences between sensitivity and specificity. In the present study, Spearman’s correlation coefficient of sensitivity and specificity was selected as a representative way of exploring the threshold effect. According to the analysis, Spearman’s correlation coefficient was 0.068, with a P value of 0.803 (P > 0.05), suggesting that there was no heterogeneity from the threshold effect.
Subgroup and meta-regression analyses
In this study, subgroup analyses were conducted to explore the possible sources of heterogeneity. We found that the pooled sensitivity, specificity, and AUC of the studies were 0.61 (95% CI: 0.46-0.74), 0.87 (0.81-0.91), and 0.85 (0.82-0.88) for Asian populations versus 0.71 (0.54-0.84), 0.82 (0.69-0.90), and 0.84 (0.80-0.87) for Caucasian sones.
Subgroup analysis by sample source revealed that there was no significant difference in the diagnostic accuracy between studies with plasma and serum, with sensitivity of 0.69 (95% CI: 0.54-0.80) versus 0.75 (0.65-0.83), specificity of 0.86 (0.75-0.92) versus 0.84 (0.78-0.88), and AUC of 0.85 (0.82-0.88) versus 0.87 (0.84-0.90). However, both of these exhibited higher diagnostic accuracy than studies with feces, for which the pooled sensitivity, specificity, and AUC were 0.37 (0.21-0.57), 0.89 (0.76-0.96), and 0.72 (0.68-0.76). With respect to the subgroup analysis, to determine the difference between blood-based and feces-based samples, we found that the diagnostic sensitivity and AUC for circulating samples (Figure 4C) were significantly higher than for fecal samples, while the diagnostic specificity for fecal samples was higher than for circulating ones. Overall, circulating samples were more sensitive than fecal samples for detecting CRC. In particular, serum miR-21 assays exhibited slightly higher overall diagnostic power than plasma miR-21.
Pooled studies with a small sample size exhibited higher diagnostic sensitivity of 0.71 (95% CI: 0.62-0.79) compared with studies with a large sample size, for which the value was 0.51 (0.32-0.70); in contrast, a large sample size was associated with specificity of 0.88 (0.80-0.94) compared with the value for a small sample size of 0.82 (0.74-0.88). The overall predictive accuracy in AUC was found to be similar between small and large sample sizes, for which the values were 0.83 (0.80-0.86) and 0.84 (0.81-0.87).
Meta-regression analysis indicated that sample source (P > 0.10), ethnicity (P > 0.10), and sample size (P > 0.10) did not significantly affect the pooled results. Therefore, meta-regression could not enable us to identify the variable sources that may contribute to the heterogeneity of the diagnostic accuracy among the included studies.
Table 2: Results of subgroup and meta-regression analyses in the diagnosis meta-analysis
Subgroup |
Number of studies |
Se (95% CI) |
Sp (95% CI) |
AUC (95% CI) |
Meta-regression (p-value) |
|
Individual |
Ethnicity |
0.6504 |
||||
Caucasian |
5 |
0.71(0.54-0.84) |
0.82(0.69-0.90) |
0.84(0.80-0.87) |
||
Asian |
11 |
0.61(0.46-0.74) |
0.87(0.81-0.91) |
0.85(0.82-0.88) |
||
Sample size |
0.6458 |
|||||
<100 |
10 |
0.51(0.32-0.70) |
0.88(0.80-0.94) |
0.83(0.80-0.86) |
||
>100 |
6 |
0.71(0.62-0.79) |
0.82(0.74-0.88) |
0.84(0.81-0.87) |
||
Sample type 1 |
0.1730 |
|||||
Plasma |
6 |
0.69(0.54-0.80) |
0.86(0.75-0.92) |
0.85(0.82-0.88) |
||
Serum |
5 |
0.75(0.65-0.83) |
0.84(0.78-0.88) |
0.87(0.84-0.90) |
||
Feces |
4 |
0.37(0.21-0.57) |
0.89(0.76-0.96) |
0.72(0.66-0.76) |
||
Tissue |
1 |
0.68 |
0.72 |
0.746 |
||
Sample type 2 |
||||||
Circulation |
11 |
0.72(0.63-0.79) |
0.84(0.78-0.89) |
0.86(0.83-0.89) |
||
Feces |
4 |
0.37(0.21-0.57) |
0.89(0.76-0.96) |
0.72(0.66-0.76) |
||
Tissue |
1 |
0.68 |
0.72 |
0.746 |
||
Combination |
Sample type |
0.0119 |
||||
Circulation |
5 |
0.85(0.70-0.93) |
0.86(0.77-0.92) |
0.92(0.89-0.94) |
||
Feces |
4 |
0.73(0.65-0.80) |
0.66(0.53-0.78) |
0.76(0.72-0.80) |
||
Sample size |
0.8999 |
|||||
<100 |
4 |
0.73(0.60-0.83) |
0.77(0.53-0.91) |
0.80(0.76-0.83) |
||
>100 |
5 |
0.81(0.67-0.89) |
0.80(0.68-0.89) |
0.87(0.84-0.90) |
||
Ethnicity |
0.0147 |
|||||
Caucasian |
2 |
-- |
-- |
-- |
||
Asian |
7 |
0.78(0.67-0.87) |
0.81(0.66-0.90) |
0.86(0.83-0.89) |
||
Number of miRNAs |
0.0437 |
|||||
two |
4 |
0.71(0.63-0.78) |
0.73(0.51-0.87) |
0.76(0.72-0.79) |
||
two more |
5 |
0.85(0.72-0.92) |
0.83(0.75-0.88) |
0.89(0.86-0.92) |
Sensitivity analysis and publication bias
Sensitivity analysis identified five studies that deviated from the others [31, 36, 37, 42]. After removing them, the I2 values for sensitivity and specificity dropped from 94.58% to 73.20% and from 84.41% to 47.99%, respectively. However, there were no significant changes for the newly pooled results.
To evaluate publication bias, Deeks’ funnel plot was selected. The funnel plots exhibited no symmetry (Figure 6A) for all enrolled studies and Deeks’ test returned a P value of 0.36, revealing no obvious publication bias in this analysis.
Diagnostic meta-analysis of miR-21-related combination markers in CRC
Study characteristics and quality assessment
In the nine reported studies on miR-21-related combination markers, a total of 752 patients and 633 normal participants were available for this diagnostic meta-analysis. Table 1B shows the main characteristics of the nine relevant studies. Among these studies, seven were on Asians and two were on Caucasians. Regarding the sample sources, four studies focused on feces, while the remaining five focused on combination markers in blood. All studies measured the expression of combination markers by qRT-PCR. The assessment of the quality of each study indicated that the included studies were suitable for quantitative synthesis.
Diagnostic accuracy of miR-21-related combination markers in CRC
The forest plot (Figure 3) indicated that the overall combined results for sensitivity and specificity were 0.79 (95% CI: 0.69-0.86) and 0.79 (0.68-0.87). Significant heterogeneity was observed since the Q value was 37.84 (P < 0.01) and I2 was 78.86% (65.52-92.20) for sensitivity, while the Q value was 69.02 (P < 0.01) and I2 was 88.41% (82.19-94.62) for specificity. Other parameters for all of the results together were also exported: pooled PLR was 3.79 (2.30-6.23), NLR was 0.27 (0.17-0.42), and DOR was 14.15 (5.93-33.76). The AUC (Figure 4B) was 0.86 (0.83-0.89), indicating relatively high predictive power.
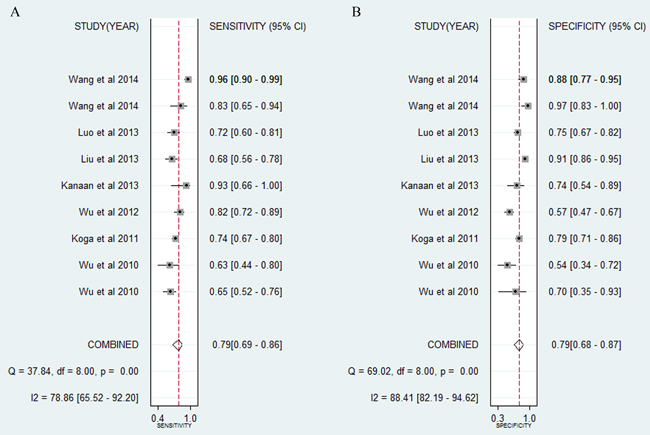
Figure 3: Forest plots of sensitivities and specificities of miR-21-related combination markers in the diagnosis of CRC.
Threshold effect
Spearman’s rank correlation was also studied. The results identified no heterogeneity resulting from the threshold effect, from a Spearman’s correlation coefficient of −0.433 with P = 0.244.
Subgroup and meta-regression analyses
Pooled studies on a large sample size exhibited higher diagnostic accuracy than studies on a small sample size, with sensitivity of 0.81 (95% CI: 0.67-0.89) versus 0.73 (0.60-0.83), specificity of 0.80 (0.68-0.89) versus 0.77 (0.53-0.91), and AUC of 0.87 (0.84-0.90) versus 0.80 (0.76-0.83). Subgroup analysis by the number of biomarkers suggested that two more combination markers offered more powerful diagnostic value of CRC than two combination markers, with sensitivity of 0.85 (95% CI: 0.72-0.92) versus 0.71 (0.63-0.78), specificity of 0.83 (0.75-0.88) versus 0.73 (0.51-0.87), and AUC of 0.89 (0.86-0.92) versus 0.76 (0.72-0.79). Furthermore, circulating miRNA combination markers (Figure 4D) had a higher level of predictive power than combination markers in feces, with sensitivity of 0.85 (95% CI: 0.70-0.93) versus 0.73 (0.65-0.80), specificity of 0.86 (0.77-0.92) versus 0.66 (0.53-0.78), and AUC of 0.92 (0.89-0.94) versus 0.76 (0.72-0.80). Among the nine studies, seven studies detected the miR-21 expression in Asian populations. Hence, subgroup analysis was also performed by Asian populations. The pooled sensitivity, specificity, and AUC were 0.78 (95% CI: 0.67-0.87), 0.81 (0.66-0.90), and 0.86 (0.83-0.89).
As suggested by Table 2, the results of the meta-regression were consistent with the conclusion provided by the subgroup analysis. The meta-regression analysis suggested that sample source (P < 0.05), ethnicity (P < 0.05), and number of combination markers (P < 0.05) might be variable sources of heterogeneity in the diagnostic accuracy across the eligible studies.
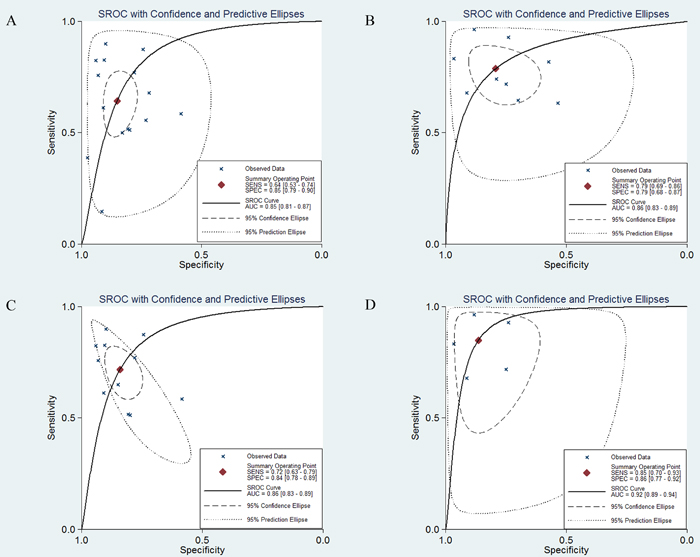
Figure 4: SROC curves in the diagnosis of CRC. A. SROC curve for miR-21 alone. B. SROC curve for miR-21-related combination markers. C. SROC curve for miR-21 alone in circulating samples. D. SROC curve for miR-21-related combination markers in circulating samples.
Sensitivity analysis and publication bias
We conducted a sensitivity analysis, but failed to determine the sources of heterogeneity from the results. Deeks’ test returned a P value of 0.77, suggesting a low likelihood of publication bias in the diagnostic meta-analysis for miR-21-related combination markers (Figure 6B).
Prognostic meta-analysis
Study characteristics and quality assessment
A total of 1591 participants from 10 studies and 3458 participants from 22 studies were included in the study evaluating OS and PFS, respectively. The main characteristics of the included studies are presented in Table 1C. These eligible studies all involved a retrospective design and focused on patients from nine countries. The ethnic backgrounds of the patients were classified as Asian or Caucasian. Tissue samples were used in 28 studies, while 4 studies used serum samples. Most studies investigated miR-21 by qRT-PCR. The results of quality assessment are listed in Tables S1A and S1B.
Correlation between miR-21 expression and DFS
For studies evaluating DFS, clear heterogeneity was found among the studies on miR-21 (P < 0.05, I2 = 77.7%). Consequently, we calculated the combined HR and the corresponding 95% CI based on a random model, which was 1.60 (95% CI: 1.20-2.15, P < 0.01) for all of the studies (Figure 5A), indicating that elevated miR-21 expression predicted a shorter DFS for patients with CRC.
Then, a meta-regression analysis was conducted to reveal the source of the heterogeneity. It revealed that ethnicity, sample source, and cancer type may have contributed to the heterogeneity.
Interestingly, when it came to the subgroup analysis by ethnicity, it was revealed that the combined HR of DFS was 2.15 (95% CI: 1.68-2.74, P < 0.01) in Asian populations with CRC versus 1.16 (0.84-1.62, P = 0.37) in Caucasians. Among the ten studies, nine explored the correlation between tissue miR-21 and prognosis. Hence, we also analyzed the studies by tissue. It was concluded that a high level of tissue miR-21 indicated a shorter DFS with combined HR of 1.76 (1.31-2.36, P < 0.01) for CRC patients. In addition, the combined HR was 1.86 (0.96-3.60, P = 0.06) in CRC patients and 1.50 (1.20-1.89, P < 0.01) in patients with colon cancer (CC).
In the sensitivity analysis, after excluding the studies by Nielsen et al. [47] and Menendez et al. [49], the heterogeneity was clearly reduced (I2 = 54.6%, P = 0.031) and the newly derived combined HR was 1.95 (1.48-2.58, P < 0.01).
Table 3: Results of subgroup and meta-regression analyses in the prognostic meta-analysis
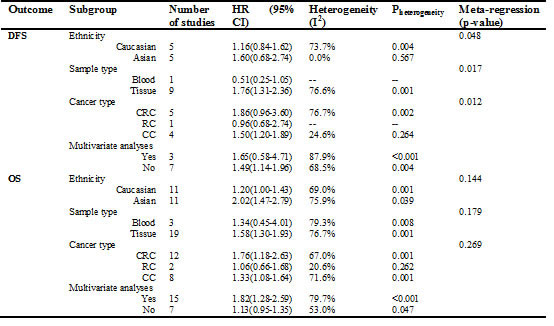
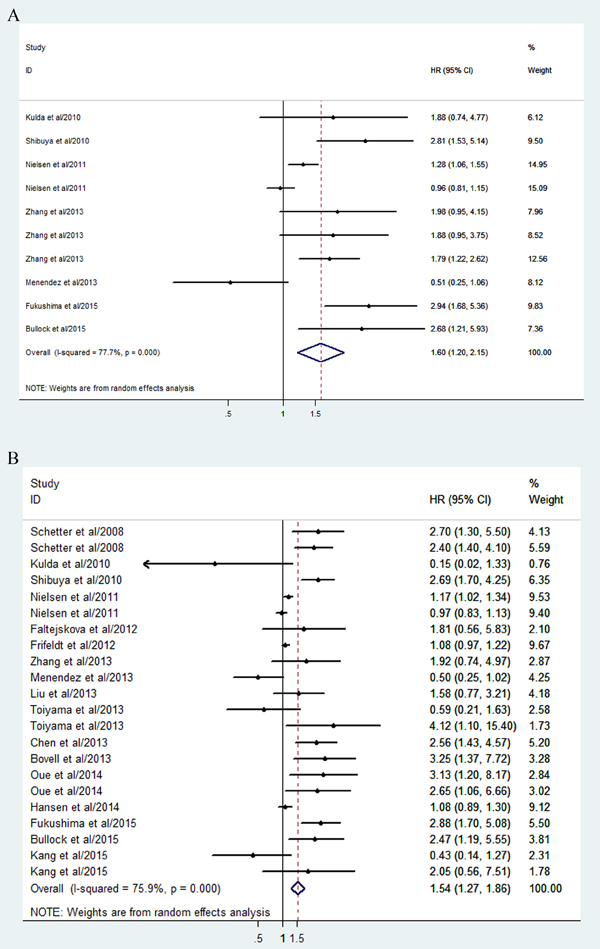
Figure 5: Forest plots of the correlation between miR-21 expression level and CRC prognosis. A. Forest plot of DFS. B. Forest plot of OS.
Correlation between miR-21 expression and OS
For studies evaluating OS, a random model was selected as well due to the heterogeneity across studies (P < 0.05, I2 = 75.9%). It indicated that higher miR-21 expression predicted shorter OS in CRC (HR: 1.54; 95% CI, 1.27-1.86, P < 0.01) (Figure 5B).
The meta-regression revealed no significant results on the source of the heterogeneity between studies, with respect to ethnicity, sample source, and cancer type. In the subgroup analysis, it was concluded that the combined HR for OS was 2.02 (95% CI: 1.47-2.79, P < 0.01) in Asians versus 1.20 (1.00-1.43, P = 0.05) in Caucasians. As regards sample source, the combined HR for OS was 1.58 (1.30-1.93, P = 0.61) in tissue sample and 1.34 (0.45-4.01, P < 0.01) in serum. When we grouped the meta-analysis by cancer type, we found that the combined HR for OS was 1.33 (1.08-1.64, p = 0.007) in colon cancer, 1.76 (1.18-2.63, p = 0.006) in CRC, and 1.06 (0.66-1.68, p = 0.818) in rectal cancer (RC).
Sensitivity analysis was also conducted, from the results of which we found that, when five studies were discarded [46, 50, 52, 55, 56], the outcome of the sensitivity analysis was more stable (I2 dropped from 75.9% to 61.9%, P < 0.01).
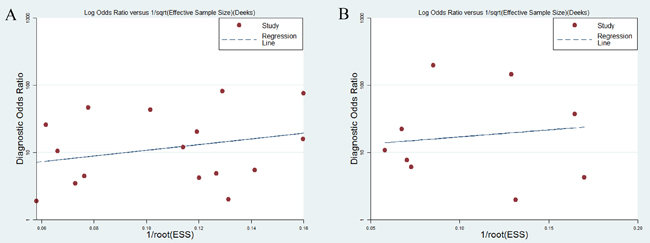
Figure 6: Deeks’ funnel plots for the assessment of potential bias in the meta-analysis for diagnosis. A. Funnel plot of the studies on miR-21 alone. B. Funnel plot of the studies on miR-21-related combination markers.
Publication bias
Finally, Begg’s funnel plot and Egger’s test were applied to assess publication bias (Figures 7A and 7B). The P values of Egger’s regression intercept for DFS and OS were 0.069 and 0.02, respectively, suggesting no obvious publication bias in the quantitative synthesis for evaluating DFS, while publication bias did exist in the meta-analysis for assessing OS.
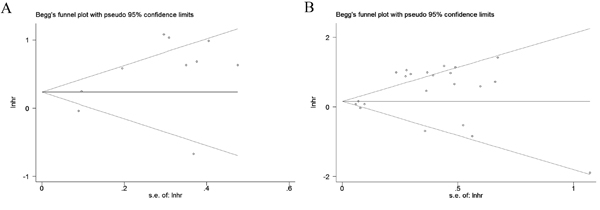
Figure 7: Begg’s funnel plots for the assessment of publication bias in the meta-analysis for prognosis. A. Funnel plot of the studies for DFS. B. Funnel plot of the studies for OS.
Discussion
Tumor biomarkers are critical for diagnosing cancer, predicting its outcome, and selecting an appropriate therapeutic method [60]. Biomarkers that can not only play important roles in early detection of CRC but also predict patients’ outcome should be a greater focus of attention in clinical research [61]. Given their involvement in various important biological processes, including cell growth, differentiation, apoptosis, cancer development, and metastasis, miRNAs may be considered perfect diagnostic, therapeutic, and prognostic biomarkers for CRC [9]. As one of the most researched miRNAs, miR-21 has a high degree of stability and thus has great potential as a biomarker for CRC [62]. Nevertheless, a series of quantitative analyses were conducted to investigate its diagnostic or prognostic value, which generated some conflicting results across the studies. The inconsistent findings prompted us to carry out this comprehensive and up-to-date research, to investigate the diverse values of miR-21 in a clinical context, including its diagnostic and prognostic abilities in CRC.
The present meta-analysis for individual miR-21 in CRC indicated that miR-21 presented diagnostic sensitivity of 64%, specificity of 85%, and AUC of 0.85. These three representative parameters confirmed the accuracy of miR-21 as a promising noninvasive predictor for examining CRC. Nevertheless, the values for PLR (4.33) and NLR (0.42) in this study suggested caution regarding the diagnostic power of miR-21 alone for screening CRC patients, as PLR > 10 and NLR < 0.1 are the thresholds representing high accuracy. Significant heterogeneity was discovered for all parameters of diagnosis, including sensitivity, specificity, PLR, NLR, and DOR. The threshold effect, subgroup, meta-regression, and sensitivity analyses are necessary approaches to explore potential heterogeneity. Given Spearman’s correlation coefficient of 0.068 with a P value of 0.803 (P > 0.05), no heterogeneity due to the threshold effect was confirmed. Meanwhile, meta-regression failed to identify potential sources that may contribute to the heterogeneity of the diagnostic accuracy among the included studies. With regard to the subgroup analysis, we concluded that miR-21 in Asian populations has similar diagnostic accuracy to miR-21 in Caucasian ones. In addition, the specimen type may influence the diagnostic accuracy. Specifically, it was revealed that blood-based (plasma or serum) assays had significantly better overall diagnostic accuracy than feces-based ones, although feces-based assays exhibited a high level of diagnostic specificity. Importantly, circulating miR-21 was considered to be more suitable for detecting CRC, given its abundance and the stability of its expression in circulating samples during the diagnosing process [63]. In addition, consistent with previous meta-analyses [20], serum miR-21 exhibited stronger performance for distinguishing CRC patients from healthy people compared with that in plasma, given values of sensitivity of 0.75 versus 0.69, specificity of 0.84 versus 0.86, and AUC of 0.87 versus 0.85. Thus, we recommended serum as the most suitable specimen type in the following diagnostic studies.
From the perspective of cancer evolution, a single biomarker is unlikely to dictate the complicated evolutionary process at the systemic level. Based on the hypothesis that combination biomarkers will help to explain the internal mechanisms of CRC as well as the external factors influencing it, we carried out a meta-analysis for miR-21-related combination markers in CRC to check whether they were better than miR-21 alone in diagnosing CRC. The pooled results for sensitivity, specificity, PLR, NLR, DOR, and AUC were 0.79, 0.79, 3.79, 0.27, 14.15, and 0.86, suggesting that the diagnostic performance was relatively high. According to the results, a large sample size, two more combination markers, and blood-based miRNA assays exhibited higher diagnostic power than a small sample size, two combination markers, and feces-based miRNA assays, respectively. When compared with the results for miR-21 alone among the different sample sources, circulating miR-21-related combination markers exhibited a higher level of predictive power compared with circulating individual miR-21 assays, with sensitivity of 0.85 versus 0.72, specificity of 0.86 versus 0.84, and AUC of 0.92 versus 0.86. In conclusion, combination markers exhibited high diagnostic value and could be applied in a clinical context, overcoming the insufficient power of a single marker.
The prognostic meta-analyses suggested that miR-21 expression level is a potential marker for predicting survival outcomes in CRC patients. Our results showed that patients with an elevated level of miR-21 may be associated with an increased risk of poor survival, which was 1.60-fold higher for DFS and 1.54-fold higher for OS upon comparison with patients with low miR-21 expression. In particular, the predictive efficacy for DFS and OS was more significant in Asians than in Caucasians. In addition, tissue miR-21 was widely applied to predict the survival outcome in CRC and the results proved the practicability of it as a suitable prognostic biomarker. Meanwhile, circulating miR-21 was also identified as a noninvasive prognostic marker for CRC, although it showed a lower risk of poor survival compared with tissue miR-21. However, significant heterogeneity remained in the meta-analyses of the data for DFS, which can be explained by ethnicity, sample source, and cancer type in the meta-regression. In contrast, this study failed to reveal the factors behind the heterogeneity among the studies for OS. Sensitivity analyses succeeded in identifying several outlier studies, in the analyses of both DFS and OS. Nonetheless, we believe that miR-21 may be a useful biomarker associated with survival outcome.
Although we conducted subgroup, meta-regression, and sensitivity analyses, the heterogeneity in our study was still not fully explained. The heterogeneity across studies was probably due to different baseline characteristics with regard to the distributions of age and gender, histological type, tumor stage, detection approach, and follow-up period. A lack of standardized reporting made it difficult to extract the detailed information about baseline characteristics. In addition, different cut-off points may have contributed to the potential heterogeneity to a certain degree. Furthermore, in the multivariate analysis of the clinicopathological factors for survival, the diversification of adjusted factors in each group may contribute to inaccuracies associated with HR estimation.
Recently, accumulating research has revealed miR-21 to be a promising predictor for CRC detection and prognosis. Our results in this study also supported this conclusion. However, there are still some factors that restrict its application to clinical practice. First, an appropriate standard cut-off value for miR-21 expression is required for the accurate determination of diagnosis and prognosis. The lack of a clear cut-off and the variety of selected cut-off points in different studies are considered to be potential sources of heterogeneity [64]. Second, a consensus should be reached about the standard detection method in terms of the extraction of total RNA and the selection of internal reference RNA for normalization. Although qRT-PCR was the most widely selected method for measuring miR-21 expression, in situ hybridization (ISH) was also used in some studies. Different laboratories also used different internal reference RNA. There is thus a need for further studies on this issue in order to reach agreement on the procedure used for normalization. Third, there is the question of which sample type (plasma, serum, feces, or tissue) should be used. In our study, it was revealed that circulating (especially serum) miR-21 may be a promising marker for detecting CRC, while tissue miR-21 may serve as a useful marker for predicting the survival outcome. Meanwhile, we supposed that tissue miR-21 could predict the overall survival and circulating miR-21 may act as an auxiliary marker, monitoring the level of miR-21 in the body. Besides that, ethnic differences must be considered as the clinical value of miR-21 may vary with patient ethnicity [56]. From our results, we also realized the difference. Another question is as follows: Which has greater clinical utility, single miR-21 or a combination of miR-21 with other miRNAs? According to our findings, miR-21 was significant but not strong enough to discriminate CRC patients from normal controls, while miR-21-related combination markers improved the diagnostic accuracy in blood-based samples. In addition, two more combination markers exhibited higher diagnostic accuracy than two combination markers. Thus, it still remains an open question which and how many miRNAs should be combined with miR-21 for improving the diagnostic power. Finally, researchers have considered using combination markers instead of a single miRNA to increase the power for predicting prognosis. For example, Zhang et al. [48] used a six-miRNA signature including miR-21 in CRC patients, which was shown to be an effective prognostic tool for survival compared with miR-21 alone. Similar conclusions were drawn by Bullock et al. [51]. However, we failed to collect a sufficient number of studies to evaluate the combination biomarkers for their correlations with survival. More high-quality research on this issue is now urgently needed.
Our study has several important strengths compared with the previous meta-analyses. First, we conducted more comprehensive research for estimating the diverse roles of miR-21 in CRC patients. Both diagnostic and prognostic meta-analyses were performed based on sufficient numbers of publications. Next, the clinical values of different sample sources, namely, plasma, serum, feces, and tissue, were investigated, with the aim of identifying the most suitable one for clinical application. In addition, considering the differences in the selected clinical end point in different observational cohorts, the prognostic value of miR-21 for both OS and DFS was evaluated. Moreover, we discussed the diagnostic value of miR-21-related combination markers for the first time. It was revealed that the combination of miR-21 with other miRNAs improved the diagnostic power, which may provide a new path for progress in a clinical context. Finally, several interesting results arose from our meta-analysis, which established a foundation for future observational cohorts and clinical trials. Taking these findings together, although several meta-analyses have already identified miR-21 as a predictor for CRC diagnosis or prognosis, our integrative study is the most accurate and comprehensive one yet.
However, there were also several limitations in our work. First, most of the publications in the diagnostic meta-analyses included healthy participants as controls and were not blind in design. This form of design limits the diagnostic performance. Second, we analyzed data from published studies instead of individual patient data (IPD), which placed restrictions on analyzing all the data in a consistent manner [65]. Third, in the meta-analysis of combination markers, we failed to investigate each component in the combination regarding its diagnostic accuracy with CRC independently, which may generate potential heterogeneity when combining them. Moreover, the sample size for the meta-analysis of combination markers was small and the conclusion thus needs further validation. In addition, only Asians and Caucasians were included in the analyses, so no African populations were enrolled. Furthermore, unpublished studies would likely include increased proportions of negative results, but by definition we were not aware of them and could not include them here. Moreover, we did not extend the search to non-English publications, which could also result in bias as positive results tend to be accepted by English-language journals more easily. Finally, clear publication bias was found in the studies for OS, while Egger’s regression intercept in DFS returned a P value of 0.069, showing a tendency for statistical significance.
In conclusion, this meta-analysis comprehensively investigated the application of miR-21 for determining the diagnosis and prognosis of patients with CRC. This study revealed that circulating miR-21 has promise as a predictor for detecting CRC, while tissue miR-21 is a useful marker for predicting CRC survival. Combination miRNA biomarkers have also emerged as a new alternative for clinical application. Nonetheless, further large-scale prospective studies are warranted to develop integrative diagnostic and prognostic models with more appropriate and better prediction capacity.
Materials and methods
This study was carried out and reported on the basis of the standards formulated in Preferred Reporting Items for Systematic Reviews and Meta-analyses (PRISMA) [66].
Literature search strategy
Articles published up to May 29, 2016, which were associated with the diagnostic or prognostic application of miR-21 for CRC, were searched based on PubMed, Embase, Cochrane Library, and Web of Science. The search terms used for literature retrieval were as follows: (“colorectal cancer” OR “colorectal tumor’’ OR “colorectal carcinoma” OR “CRC” OR “rectal cancer” OR “rectal tumor” OR “rectal carcinoma” OR “colon cancer” OR “colon tumor” OR “colon carcinoma”) AND (“microRNA-21” OR “miR-21” OR “miRNA-21”). In addition, we also examined the reference lists in identified articles to find any additional relevant studies. Two investigators (Peng and Zhang) independently carried out the literature search and the following tasks.
Eligibility criteria
The main criteria considered for the enrollment of studies were as follows: (1) they reported research on patients with CRC; (2) they detected miR-21 expression in plasma, serum, feces, or tissues; (3) they made a definitive diagnosis of CRC with the gold standard; (4) they undertook a thorough inquiry into the relationship between miR-21 and CRC detection or DFS or OS; and (5) they provided sufficient data for calculating the rates of true positive (TP), false positive (FP), false negative (FN), and true negative (TN) for diagnostic meta-analysis or HR for prognostic meta-analysis.
Studies were excluded if they were (1) not relevant to our study topic; (2) published in the form of letters, reviews, editorials, or case reports; (3) duplicate publications; (4) non-English publications; or (5) involved unqualified data.
Data extraction
Two reviewers (Peng and Zhang) independently collected the relevant data from the articles based on standardized forms. Any disagreement on whether a particular study should be included was settled by consulting with a third reviewer (Min) and then reaching a consensus. The following information from the diagnostic and prognostic studies was extracted: name of the first author; time of publication; country of research; ethnicity of research population; number of participants; source of samples; and diagnostic results including sensitivity, specificity, TP, FP, FN, and TN; or prognostic results including follow-up time and HR estimates with 95% CIs for DFS or OS. If HRs or their corresponding 95% CIs for DFS or OS were not directly given in the included articles, they were extracted using Kaplan-Meier survival curves by a method previously introduced by Tierney et al. [67].
Quality assessment
Quality Assessment of Diagnostic Accuracy Studies 2 (QUADAS-2) was applied to judge the quality of selected publications enrolled in the diagnostic study [68]. For prognostic studies, methodological quality was assessed by following the guidelines of the Newcastle-Ottawa Scale [69].
Statistical analysis
For the diagnostic meta-analyses, the numbers of patients with TP, FP, FN, and TN test results were retrieved directly or via recalculation based on the combination of the reported diagnostic estimates and the sample size in the included study. All of the pooled parameters were estimated by the bivariate meta-analysis model [70], including (1) sensitivity, (2) specificity, (3) positive likelihood ratio (PLR), (4) negative likelihood ratio (NLR), and (5) diagnostic odds ratio (DOR). The summary receiver operator characteristic (SROC) curve was established based on the sensitivity and specificity of every study [71]. In addition, we calculated the corresponding area under the SROC curve (AUC), which is commonly applied for quantifying the diagnostic power. Furthermore, heterogeneity across studies was assessed using the I2 statistic [72]. Possible sources of heterogeneity were explored by conducting subgroup, meta-regression, and sensitivity analyses [73]. Finally, Deeks’ funnel plot was adopted to evaluate the publication bias of the included studies; P < 0.05 indicates significant publication bias [74].
With respect to the prognostic meta-analyses, all of the HRs and their 95% CIs were combined to calculate the pooled impact of miR-21 expression on the survival of CRC patients. Cochran’s Q test (significant at P < 0.05) and I2 statistics (ranging from 0% to 100%) were used to check the heterogeneity of the pooled results [75]. A fixed-effect model was selected when homogeneity was fine (P > 0.05, I2 < 50%); otherwise, a random-effect model was used [76]. Meta-regression, subgroup, and sensitivity analyses were carried out to identify the potential sources of heterogeneity. Finally, Begg’s funnel plots were selected to evaluate the included studies for the possibility of publication bias [77].
The statistical analyses were completed using STATA (version 12.0) and Meta-DiSc statistical software (version 1.4) [78]. Values of P < 0.05 were deemed to represent statistical significance.
ACKNOWLEDGMENTS AND FUNDING
This manuscript is supported by the Second Affiliated Hospital of Soochow University Preponderant Clinic Discipline Group Project Funding (XKQ2015005) and Project of Suzhou Science and Technology Development Plan (SYS201342).
CONFLICTS OF INTEREST
There are no conflicts of interest.
REFERENCES
1. Ferlay J, Soerjomataram I, Dikshit R, Eser S, Mathers C, Rebelo M, Parkin DM, Forman D, Bray F. Cancer incidence and mortality worldwide: sources, methods and major patterns in GLOBOCAN 2012. International journal of cancer. 2015; 136:E359-386.
2. Castells A. Choosing the optimal method in programmatic colorectal cancer screening: current evidence and controversies. Therapeutic advances in gastroenterology. 2015; 8:221-233.
3. Pourhoseingholi MA. Increased burden of colorectal cancer in Asia. World journal of gastrointestinal oncology. 2012; 4:68-70.
4. Siegel R, Naishadham D, Jemal A. Cancer statistics, 2013. CA Cancer J Clin. 2013; 63:11-30.
5. Walther A, Johnstone E, Swanton C, Midgley R, Tomlinson I, Kerr D. Genetic prognostic and predictive markers in colorectal cancer. Nature reviews Cancer. 2009; 9:489-499.
6. Bartel DP. MicroRNAs: genomics, biogenesis, mechanism, and function. Cell. 2004; 116:281-297.
7. Bartel DP. MicroRNAs: target recognition and regulatory functions. Cell. 2009; 136:215-233.
8. Di Leva G, Garofalo M, Croce CM. MicroRNAs in cancer. Annual review of pathology. 2014; 9:287-314.
9. Ferracin M, Veronese A, Negrini M. Micromarkers: miRNAs in cancer diagnosis and prognosis. Expert review of molecular diagnostics. 2010; 10:297-308.
10. Nana-Sinkam P, Croce CM. MicroRNAs in diagnosis and prognosis in cancer: what does the future hold? Pharmacogenomics. 2010; 11:667-669.
11. Huang Y, Yang YB, Zhang XH, Yu XL, Wang ZB, Cheng XC. MicroRNA-21 gene and cancer. Medical oncology. 2013; 30:376.
12. Yu W, Wang Z, Shen LI, Wei Q. Circulating microRNA-21 as a potential diagnostic marker for colorectal cancer: A meta-analysis. Molecular and clinical oncology. 2016; 4:237-244.
13. Chen Z, Liu H, Jin W, Ding Z, Zheng S, Yu Y. Tissue microRNA-21 expression predicted recurrence and poor survival in patients with colorectal cancer - a meta-analysis. OncoTargets and therapy. 2016; 9:2615-2624.
14. Jiang JX, Zhang N, Liu ZM, Wang YY. Detection of microRNA-21 expression as a potential screening biomarker for colorectal cancer: a meta-analysis. Asian Pacific journal of cancer prevention. 2014; 15:7583-7588.
15. Shan L, Ji Q, Cheng G, Xia J, Liu D, Wu C, Zhu B, Ding Y. Diagnostic value of circulating miR-21 for colorectal cancer: a meta-analysis. Cancer biomarkers. 2015; 15:47-56.
16. Xia X, Yang B, Zhai X, Liu X, Shen K, Wu Z, Cai J. Prognostic role of microRNA-21 in colorectal cancer: a meta-analysis. PloS one. 2013; 8:e80426.
17. Wang Y, Gao X, Wei F, Zhang X, Yu J, Zhao H, Sun Q, Yan F, Yan C, Li H, Ren X. Diagnostic and prognostic value of circulating miR-21 for cancer: a systematic review and meta-analysis. Gene. 2014; 533:389-397.
18. Zhang H, Li P, Ju H, Pesta M, Kulda V, Jin W, Cai M, Liu C, Wu H, Xu J, Ye Y, Zhang G, Xu E, et al. Diagnostic and prognostic value of microRNA-21 in colorectal cancer: an original study and individual participant data meta-analysis. Cancer epidemiology, biomarkers & prevention. 2014; 23:2783-2792.
19. Yan L, Zhao W, Yu H, Wang Y, Liu Y, Xie C. A Comprehensive Meta-Analysis of MicroRNAs for Predicting Colorectal Cancer. Medicine. 2016; 95:e2738.
20. Zeng W, Tu Y, Zhu Y, Wang Z, Li C, Lao L, Wu G. Predictive power of circulating miRNAs in detecting colorectal cancer. Tumour biology. 2015; 36:2559-2567.
21. Yang X, Zhong J, Ji Y, Li J, Jian Y, Zhang J, Yang W. The expression and clinical significance of microRNAs in colorectal cancer detecting. Tumour biology. 2015; 36:2675-2684.
22. Rokkas T, Kothonas F, Rokka A, Koukoulis G, Symvoulakis E. The role of circulating microRNAs as novel biomarkers in diagnosing colorectal cancer: a meta-analysis. European journal of gastroenterology & hepatology. 2015; 27:819-825.
23. Wu K, Li L, Li S. Circulating microRNA-21 as a biomarker for the detection of various carcinomas: an updated meta-analysis based on 36 studies. Tumour biology. 2015; 36:1973-1981.
24. Wang W, Li J, Zhu W, Gao C, Jiang R, Li W, Hu Q, Zhang B. MicroRNA-21 and the clinical outcomes of various carcinomas: a systematic review and meta-analysis. BMC cancer. 2014; 14:819.
25. Yin C, Zhou X, Dang Y, Yan J, Zhang G. Potential Role of Circulating MiR-21 in the Diagnosis and Prognosis of Digestive System Cancer: A Systematic Review and Meta-Analysis. Medicine. 2015; 94:e2123.
26. Yang Y, Qian J, Chen Y, Pan Y. Prognostic role of circulating microRNA-21 in cancers: evidence from a meta-analysis. Tumour biology. 2014; 35:6365-6371.
27. Fu X, Han Y, Wu Y, Zhu X, Lu X, Mao F, Wang X, He X, Zhao Y, Zhao Y. Prognostic role of microRNA-21 in various carcinomas: a systematic review and meta-analysis. European journal of clinical investigation. 2011; 41:1245-1253.
28. Zhou X, Wang X, Huang Z, Wang J, Zhu W, Shu Y, Liu P. Prognostic value of miR-21 in various cancers: an updating meta-analysis. PloS one. 2014; 9:e102413.
29. Gibot S, Bene MC, Noel R, Massin F, Guy J, Cravoisy A, Barraud D, De Carvalho Bittencourt M, Quenot JP, Bollaert PE, Faure G, Charles PE. Combination biomarkers to diagnose sepsis in the critically ill patient. American journal of respiratory and critical care medicine. 2012; 186:65-71.
30. Zhang X, Guo J, Fan S, Li Y, Wei L, Yang X, Jiang T, Chen Z, Wang C, Liu J, Ping Z, Xu D, Wang J, et al. Screening and identification of six serum microRNAs as novel potential combination biomarkers for pulmonary tuberculosis diagnosis. PloS one. 2013; 8:e81076.
31. Koga Y, Yasunaga M, Takahashi A, Kuroda J, Moriya Y, Akasu T, Fujita S, Yamamoto S, Baba H, Matsumura Y. MicroRNA expression profiling of exfoliated colonocytes isolated from feces for colorectal cancer screening. Cancer prevention research. 2010; 3:1435-1442.
32. Wu CW, Ng SS, Dong YJ, Ng SC, Leung WW, Lee CW, Wong YN, Chan FK, Yu J, Sung JJ. Detection of miR-92a and miR-21 in stool samples as potential screening biomarkers for colorectal cancer and polyps. Gut. 2012; 61:739-745.
33. Kanaan Z, Rai SN, Eichenberger MR, Roberts H, Keskey B, Pan J, Galandiuk S. Plasma miR-21: a potential diagnostic marker of colorectal cancer. Annals of surgery. 2012; 256:544-551.
34. Wang B, Zhang Q. The expression and clinical significance of circulating microRNA-21 in serum of five solid tumors. Journal of cancer research and clinical oncology. 2012; 138:1659-1666.
35. Luo X, Stock C, Burwinkel B, Brenner H. Identification and evaluation of plasma microRNAs for early detection of colorectal cancer. PloS one. 2013; 8:e62880.
36. Liu GH, Zhou ZG, Chen R, Wang MJ, Zhou B, Li Y, Sun XF. Serum miR-21 and miR-92a as biomarkers in the diagnosis and prognosis of colorectal cancer. Tumour biology. 2013; 34:2175-2181.
37. Toiyama Y, Takahashi M, Hur K, Nagasaka T, Tanaka K, Inoue Y, Kusunoki M, Boland CR, Goel A. Serum miR-21 as a diagnostic and prognostic biomarker in colorectal cancer. Journal of the National Cancer Institute. 2013; 105:849-859.
38. Ogata-Kawata H, Izumiya M, Kurioka D, Honma Y, Yamada Y, Furuta K, Gunji T, Ohta H, Okamoto H, Sonoda H, Watanabe M, Nakagama H, Yokota J, et al. Circulating exosomal microRNAs as biomarkers of colon cancer. PloS one. 2014; 9:e92921.
39. Zanutto S, Pizzamiglio S, Ghilotti M, Bertan C, Ravagnani F, Perrone F, Leo E, Pilotti S, Verderio P, Gariboldi M, Pierotti MA. Circulating miR-378 in plasma: a reliable, haemolysis-independent biomarker for colorectal cancer. British journal of cancer. 2014; 110:1001-1007.
40. Basati G, Emami Razavi A, Abdi S, Mirzaei A. Elevated level of microRNA-21 in the serum of patients with colorectal cancer. Medical oncology. 2014; 31:205.
41. Omrane I, Kourda N, Stambouli N, Privat M, Medimegh I, Arfaoui A, Uhrhammer N, Bougatef K, Baroudi O, Bouzaienne H, Marrakchi R, Bignon YJ, Benammar-Elgaaied A. MicroRNAs 146a and 147b biomarkers for colorectal tumor’s localization. BioMed research international. 2014; 2014:584852.
42. Du M, Liu S, Gu D, Wang Q, Zhu L, Kang M, Shi D, Chu H, Tong N, Chen J, Adams TS, Zhang Z, Wang M. Clinical potential role of circulating microRNAs in early diagnosis of colorectal cancer patients. Carcinogenesis. 2014; 35:2723-2730.
43. Kanaan Z, Roberts H, Eichenberger MR, Billeter A, Ocheretner G, Pan J, Rai SN, Jorden J, Williford A, Galandiuk S. A plasma microRNA panel for detection of colorectal adenomas: a step toward more precise screening for colorectal cancer. Annals of surgery. 2013; 258:400-408.
44. Wang J, Huang SK, Zhao M, Yang M, Zhong JL, Gu YY, Peng H, Che YQ, Huang CZ. Identification of a circulating microRNA signature for colorectal cancer detection. PloS one. 2014; 9:e87451.
45. Kulda V, Pesta M, Topolcan O, Liska V, Treska V, Sutnar A, Rupert K, Ludvikova M, Babuska V, Holubec L Jr, Cerny R. Relevance of miR-21 and miR-143 expression in tissue samples of colorectal carcinoma and its liver metastases. Cancer genetics and cytogenetics. 2010; 200:154-160.
46. Shibuya H, Iinuma H, Shimada R, Horiuchi A, Watanabe T. Clinicopathological and prognostic value of microRNA-21 and microRNA-155 in colorectal cancer. Oncology. 2010; 79:313-320.
47. Nielsen BS, Jorgensen S, Fog JU, Sokilde R, Christensen IJ, Hansen U, Brunner N, Baker A, Moller S, Nielsen HJ. High levels of microRNA-21 in the stroma of colorectal cancers predict short disease-free survival in stage II colon cancer patients. Clinical & experimental metastasis. 2011; 28:27-38.
48. Zhang JX, Song W, Chen ZH, Wei JH, Liao YJ, Lei J, Hu M, Chen GZ, Liao B, Lu J, Zhao HW, Chen W, He YL, et al. Prognostic and predictive value of a microRNA signature in stage II colon cancer: a microRNA expression analysis. The Lancet Oncology. 2013; 14:1295-1306.
49. Menendez P, Padilla D, Villarejo P, Palomino T, Nieto P, Menendez JM, Rodriguez-Montes JA. Prognostic implications of serum microRNA-21 in colorectal cancer. Journal of surgical oncology. 2013; 108:369-373.
50. Fukushima Y, Iinuma H, Tsukamoto M, Matsuda K, Hashiguchi Y. Clinical significance of microRNA-21 as a biomarker in each Dukes’ stage of colorectal cancer. Oncology reports. 2015; 33:573-582.
51. Bullock MD, Pickard K, Mitter R, Sayan AE, Primrose JN, Ivan C, Calin GA, Thomas GJ, Packham GK, Mirnezami AH. Stratifying risk of recurrence in stage II colorectal cancer using deregulated stromal and epithelial microRNAs. Oncotarget. 2015; 6:7262-7279. doi: 10.18632/oncotarget.3225.
52. Schetter AJ, Leung SY, Sohn JJ, Zanetti KA, Bowman ED, Yanaihara N, Yuen ST, Chan TL, Kwong DL, Au GK, Liu CG, Calin GA, Croce CM, et al. MicroRNA expression profiles associated with prognosis and therapeutic outcome in colon adenocarcinoma. Jama. 2008; 299:425-436.
53. Faltejskova P, Besse A, Sevcikova S, Kubiczkova L, Svoboda M, Smarda J, Kiss I, Vyzula R, Slaby O. Clinical correlations of miR-21 expression in colorectal cancer patients and effects of its inhibition on DLD1 colon cancer cells. International journal of colorectal disease. 2012; 27:1401-1408.
54. Kjaer-Frifeldt S, Hansen TF, Nielsen BS, Joergensen S, Lindebjerg J, Soerensen FB, dePont Christensen R, Jakobsen A, Danish Colorectal Cancer G. The prognostic importance of miR-21 in stage II colon cancer: a population-based study. British journal of cancer. 2012; 107:1169-1174.
55. Chen TH, Chang SW, Huang CC, Wang KL, Yeh KT, Liu CN, Lee H, Lin CC, Cheng YW. The prognostic significance of APC gene mutation and miR-21 expression in advanced-stage colorectal cancer. Colorectal disease. 2013; 15:1367-1374.
56. Bovell LC, Shanmugam C, Putcha BD, Katkoori VR, Zhang B, Bae S, Singh KP, Grizzle WE, Manne U. The prognostic value of microRNAs varies with patient race/ethnicity and stage of colorectal cancer. Clinical cancer research. 2013; 19:3955-3965.
57. Oue N, Anami K, Schetter AJ, Moehler M, Okayama H, Khan MA, Bowman ED, Mueller A, Schad A, Shimomura M, Hinoi T, Aoyagi K, Sasaki H, et al. High miR-21 expression from FFPE tissues is associated with poor survival and response to adjuvant chemotherapy in colon cancer. International journal of cancer. 2014; 134:1926-1934.
58. Hansen TF, Kjaer-Frifeldt S, Christensen RD, Morgenthaler S, Blondal T, Lindebjerg J, Sorensen FB, Jakobsen A. Redefining high-risk patients with stage II colon cancer by risk index and microRNA-21: results from a population-based cohort. British journal of cancer. 2014; 111:1285-1292.
59. Kang WK, Lee JK, Oh ST, Lee SH, Jung CK. Stromal expression of miR-21 in T3-4a colorectal cancer is an independent predictor of early tumor relapse. BMC gastroenterology. 2015; 15:2.
60. Wu L, Qu X. Cancer biomarker detection: recent achievements and challenges. Chemical Society reviews. 2015; 44:2963-2997.
61. Mabert K, Cojoc M, Peitzsch C, Kurth I, Souchelnytskyi S, Dubrovska A. Cancer biomarker discovery: current status and future perspectives. International journal of radiation biology. 2014; 90:659-677.
62. Ren A, Dong Y, Tsoi H, Yu J. Detection of miRNA as non-invasive biomarkers of colorectal cancer. International journal of molecular sciences. 2015; 16:2810-2823.
63. Mitchell PS, Parkin RK, Kroh EM, Fritz BR, Wyman SK, Pogosova-Agadjanyan EL, Peterson A, Noteboom J, O’Briant KC, Allen A, Lin DW, Urban N, Drescher CW, et al. Circulating microRNAs as stable blood-based markers for cancer detection. Proceedings of the National Academy of Sciences of the United States of America. 2008; 105:10513-10518.
64. Hollander N, Sauerbrei W, Schumacher M. Confidence intervals for the effect of a prognostic factor after selection of an ‘optimal’ cutpoint. Statistics in medicine. 2004; 23:1701-1713.
65. Huang Y, Tang J, Tam WW, Mao C, Yuan J, Di M, Yang Z. Comparing the Overall Result and Interaction in Aggregate Data Meta-Analysis and Individual Patient Data Meta-Analysis. Medicine. 2016; 95:e3312.
66. Moher D, Liberati A, Tetzlaff J, Altman DG, Group P. Preferred reporting items for systematic reviews and meta-analyses: the PRISMA statement. Annals of internal medicine. 2009; 151:264-269, W264.
67. Tierney JF, Stewart LA, Ghersi D, Burdett S, Sydes MR. Response to: Practical methods for incorporating summary time-to-event data into meta. Authors’ reply. Trials. 2013; 14:391.
68. Whiting PF, Rutjes AW, Westwood ME, Mallett S, Deeks JJ, Reitsma JB, Leeflang MM, Sterne JA, Bossuyt PM, Group Q. QUADAS-2: a revised tool for the quality assessment of diagnostic accuracy studies. Annals of internal medicine. 2011; 155:529-536.
69. Stang A. Critical evaluation of the Newcastle-Ottawa scale for the assessment of the quality of nonrandomized studies in meta-analyses. European journal of epidemiology. 2010; 25:603-605.
70. Reitsma JB, Glas AS, Rutjes AW, Scholten RJ, Bossuyt PM, Zwinderman AH. Bivariate analysis of sensitivity and specificity produces informative summary measures in diagnostic reviews. Journal of clinical epidemiology. 2005; 58:982-990.
71. Jones CM, Athanasiou T. Summary receiver operating characteristic curve analysis techniques in the evaluation of diagnostic tests. The Annals of thoracic surgery. 2005; 79:16-20.
72. Higgins JP, Thompson SG, Deeks JJ, Altman DG. Measuring inconsistency in meta-analyses. Bmj. 2003; 327:557-560.
73. Song F, Sheldon TA, Sutton AJ, Abrams KR, Jones DR. Methods for exploring heterogeneity in meta-analysis. Evaluation & the health professions. 2001; 24:126-151.
74. Deeks JJ, Macaskill P, Irwig L. The performance of tests of publication bias and other sample size effects in systematic reviews of diagnostic test accuracy was assessed. Journal of clinical epidemiology. 2005; 58:882-893.
75. Higgins JP, Thompson SG. Quantifying heterogeneity in a meta-analysis. Statistics in medicine. 2002; 21:1539-1558.
76. Biggerstaff BJ, Tweedie RL. Incorporating variability in estimates of heterogeneity in the random effects model in meta-analysis. Statistics in medicine. 1997; 16:753-768.
77. Egger M, Davey Smith G, Schneider M, Minder C. Bias in meta-analysis detected by a simple, graphical test. Bmj. 1997; 315:629-634.
78. Zamora J, Abraira V, Muriel A, Khan K, Coomarasamy A. Meta-DiSc: a software for meta-analysis of test accuracy data. BMC medical research methodology. 2006; 6:31.