
INTRODUCTION
Xp11 translocation renal cell carcinoma (RCC) is characterized by chromosome translocations involving the TFE3 gene at the Xp11 breakpoint [1, 2]. TFE3 is a member of the microphthalmia-associated family of basic helix-loop-helix leucine zipper transcription factors and is involved in transforming growth factor (TGF)-β-induced transcription during cell growth, and proliferation [3]. Fusion partners of TFE3 include PRCC, PSF (SFPQ1), NonO, ASPL (ASPSCR1), CLTC and DVL2 [4, 5] and some studies have indicated that translocation RCCs with different translocations show different morphologic features [6, 7]. Therapies targeting vascular endothelial growth factor receptor and mammalian target of rapamycin may benefit patients with Xp11 translocation RCC [8, 9]; the MET signaling pathway is another possible target, since it is activated by ASPL-TFE3 fusion [10]. Although translocation RCC was initially described in children and has a relatively indolent course [3], recent studies have identified RCCs with TFE3 rearrangement in adults have shown a more aggressive course [6, 11, 12]. Therefore, differentiating Xp11 translocation RCC from other subtypes is of clinical importance and more than of academic interest.
Xp11 translocation RCC is primarily identified by immunohistochemical detection of TFE3 protein and fluorescence in situ hybridization (FISH) detection of a break-apart signal. The former method is cheaper and more convenient but has questionable sensitivity and specificity, whereas the latter is regarded as the gold standard but is expensive and labor intensive [13-17]. Moreover, fusion partners cannot be easily distinguished by FISH. RNA sequencing is a recently developed tool for detecting translocation fusion partners [5], but is too costly for routine clinical use. Reverse transcription polymerase chain reaction (RT-PCR) provides a less expensive and simpler alternative, but RT-PCR using formalin fixed paraffin embedded (FFPE) tissue is not always successful due to suboptimal RNA quality.
To compare three methods for diagnosing Xp11 translocation RCC, the present study examined the results of TFE3 immunohistochemistry, FISH, and RT-PCR using FFPE tissue. The RT-PCR results were confirmed by cloning and sequencing. We also examined the expression of cathepsin K, which acts downstream of TFE3 and is overexpressed in Xp11 translocation RCC in order to identify additional cases.
RESULTS
Clinicopathologic characteristics of patients
A total 185 study population consisted of 132 males and 53 females with a mean age of 52 years (range: 34-88 years). None of the patients had a history of malignancies. Patients were diagnosed with clear cell RCC (n = 153), papillary RCC (n = 20), chromophobe RCC (n = 10), and translocation RCC (n = 2). Clinicopathologic features along with FISH and RT-PCR results of 48 cases are shown in Table 2. The morphological features of translocation RCC are shown in Figure 1.
Table 1: Primer pairs used for RT-PCR
ASPL-TFE3 (FORW) |
5'-AAAGAAGTCCAAGTCGGGCC-3' |
ASPL-TFE3 (REV) |
5'-CGTTTGATGTTGGGCAGCTC-3' |
PRCC-TFE3 (FORW) |
5'-GCCTCAATCTGCCCCCTCCAAT-3' |
PRCC-TFE3 (REV) |
5'-CGAGTGTGGTGGACAGGTACT-3' |
CLTC-TFE3 (FORW) |
5'-GTCGCGTTGTTGGAAAGTATTG-3' |
CLTC-TFE3 (REV) |
5'-AAAAGGGCCTTTGCCTCGGT-3' |
PSF-TFE3 (FORW) |
5'-TGGTGGTGGCATAGGTTATG-3' |
PSF-TFE3 (REV) |
5'-CGTTTGATGTTGGGCAGCTC-3' |
NonO-TFE3 (FORW) |
5'-GAGAAACTAGACACAGCA-3' |
NonO-TFE3 (REV) |
5'-TGTACACATCAAGCAGAC-3' |
TFE3 wild 821-1008 (FORW) |
5'-GGCAGCAGGTGAAACAGTAC-3' |
TFE3 wild 821-1008 (REV) |
5'-CTCTGAGCTGGACCCGATGGTGA-3' |
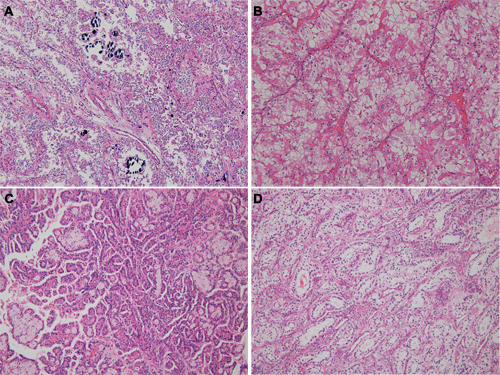
Figure 1: Morphologic features of translocation renal cell carcinoma, according to fusion partners. A. The tumor showed psammoma bodies with nested alveolar pattern (ASPL-TFE3 fusion). B. Voluminous expansile eosinophilic cytoplasm was seen in ASPL-TFE3 translocation renal cell carcinoma. C. Papillary architecture with eosinophilic cytoplasm was seen in PRCC-TFE3 translocation renal cell carcinoma. D. Clear cytoplasm with subnuclear vacuolation was identified in PSF-TFE3 translocation renal cell carcinoma.
Immunohistochemical analysis
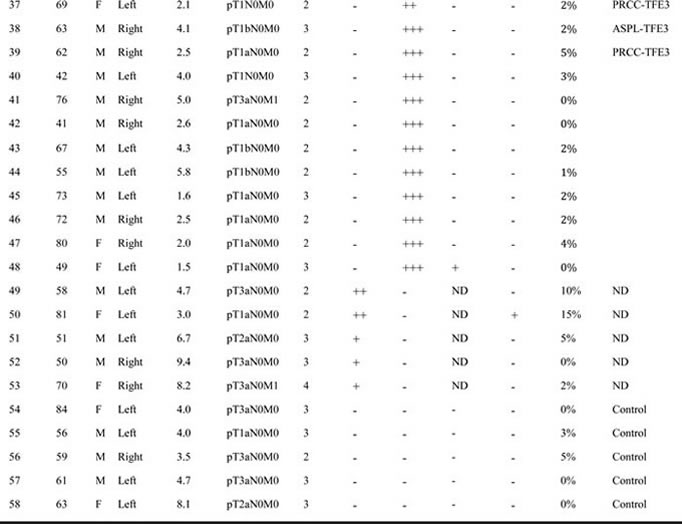
Nine and seven cases showed strongly and moderately diffuse TFE3 positivity, respectively (Figure 2). Weak expression was detected in 24 cases. Four of the 16 TFE3-positive cases were positive for cathepsin K, which was also observed in three of 24 cases with weak TFE3 expression and 13 of 145 TFE3-negative cases. Overall, 53 cases were more than weakly expressed for TFE3 or positive for cathepsin K. The results are summarized in Table 2.
Table 2: Clinicopathologic features and comparing FISH assay with RT-PCR
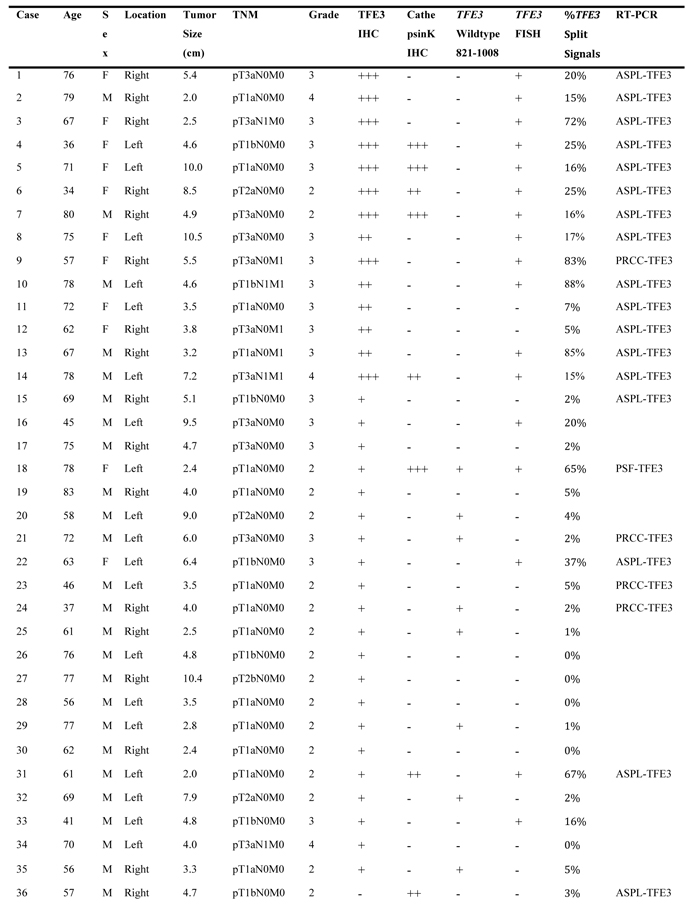
TFE3, Cathepsin K IHC: +++ (strong positive), ++ (moderate positive), + (weak expression), - (negative)
TFE3 wild type, TFE3 FISH: + (positive), - (negative)
ND: non diagnostic
Control: control group
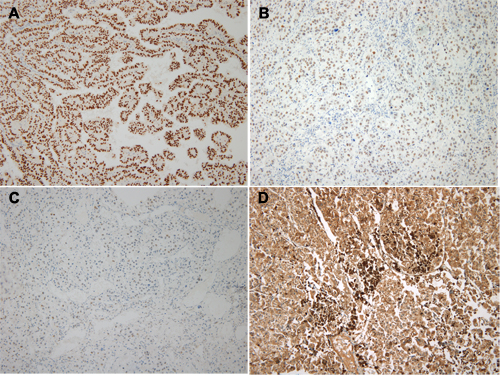
Figure 2: Immunohistochemical staining of TFE3 in Xp11 translocation renal cell carcinoma. A. TFE3 strong (3+) expression. B. TFE3 moderate (2+) expression. C. TFE3 weak (1+) expression. D. Cathepsin K strong expression.
FISH analysis
We analyzed 53 cases with at least weakly TFE3-positive or with moderate-to-strong cathepsin K expression by FISH and we also tested normal renal tissue with 5 cases of TFE3/Cathepsin K negative tumors for control group (Figure 3A). Of the 16 TFE3-positive cases, 13 (81.3%) were positive by FISH (Table 2). Of the 24 cases with weak TFE3 expression, five were translocation-positive by FISH. None of the 13 TFE3-negative/cathepsin K-positive cases was positive by FISH. Differences in break-apart signal patterns were observed between male and female patients. In the former, positive results consisted of a single pair of separate green and red signals (Figure 3C). In female patients, a positive result was a fused or closely associated green-red signal pair (representing the uninvolved copy of the X chromosome) and an additional pair of split signals (Figure 3B). Samples with single green or red signals were disregarded since they were difficult to accurately interpret.
RT-PCR for five types of translocation partners
RNA was extracted from 58 cases for RT-PCR analysis; five cases did not meet the exclusion criteria (260/280 and 260/230 ratios > 1.8) and 5 control cases (negative for TFE3 and cathepsin K) were added for RT-PCR. All bands detected in the 25 cases that we suspected having translocations were confirmed by cloning and sequencing: a solid single band at the expected position was confirmed as a translocation. Smearing pattern was revealed to have no translocation by sequencing data, but weak solid one band at proper position was confirmed to have translocation by sequencing analysis (Figure 3H, 3I). ASPL- and PRCC-TFE3 translocations were detected in 13/14 (Figure 3D, 3E) and 1/14 (Figure 3F, 3G) TFE3-positive cases, respectively, of which two were excluded. Of 24 cases with weak TFE3 expression, three were dropped, and ASPL- and PRCC-TFE3 translocations were demonstrated in three cases each. PSF-TFE3 translocation was observed in one case (Figure 3H, 3I). ASPL-TFE3 translocation was detected in 2/13 TFE3-negative/cathepsin K-positive cases, while two cases harbored PRCC-TFE3 translocation.
Comparison of immunohistochemical, FISH, and RT-PCR analyses
Relations of immunohistochemistry, FISH and RT-PCR are present in Table 3. All 14 cases showing moderate-to-strong TFE3 expression harbored TFE3 translocations by RT-PCR, with two cases negative by FISH. ASPL- and PRCC-TFE3 fusions were detected in 13 and one case, respectively. There were no cases that were positive by FISH and negative by RT-PCR.
Of the 21 cases with weak TFE3 expression, RT-PCR and FISH results were concordant in three that were positive and 12 that were negative. Four and two cases were positive only by RT-PCR or FISH, respectively. One and three cases harboring ASPL- and PRCC-TFE3 fusions, respectively, were negative by FISH. In two samples with weak TFE3 expression that were positive by FISH, no translocation product was detected by RT-PCR. In the weak TFE3 expression group, translocation partners were ASPL (n = 3), PRCC (n = 3), and PSF (n = 1). All 13 TFE3-negative/cathepsin K-positive cases were negative by FISH; however, four showed translocations by RT-PCR (ASPL- and PRCC-TFE3, n = 2 each).
Table 3: TFE3 immunohistochemistry with RT-PCR and FISH analysis
|
Characteristic |
Patient cohort |
|||||
TFE3 positive (n=14) |
TFE3 weak expression (n=21) |
TFE3 negative, cathepsin K positive (n=13) |
||||
FISH positive |
FISH negative |
FISH positive |
FISH negative |
FISH positive |
FISH negative |
|
RT-PCR positive |
12 |
2 |
3 |
4 |
0 |
4 |
RT-PCR negative |
0 |
0 |
2 |
12 |
0 |
9 |
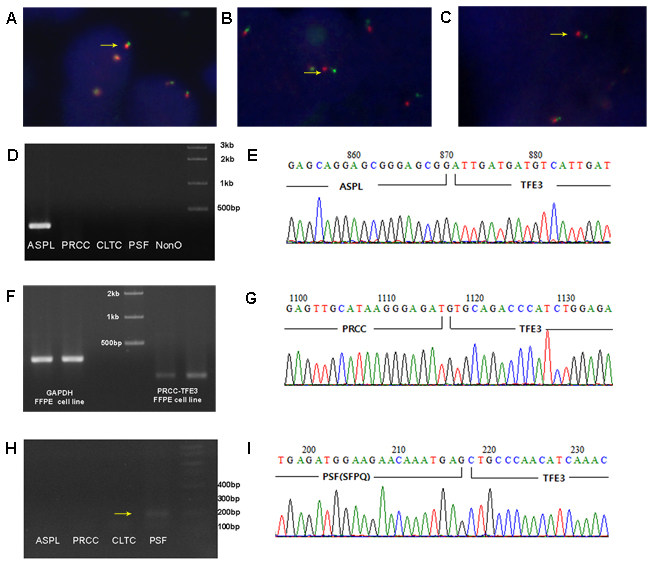
Figure 3: Representative images from the TFE3 break-apart FISH assay and sequencing analysis of RT-PCR for fusion partners. A. Normal fusion red-green signals are demonstrated in TFE3 negative RCC (1000x) B. The TFE3 break-apart probe assay resulted in 1 pair of normal fused hybridization signals and 1 pair of split signals (arrow) in females (1000x). C. The TFE3 break-apart probe assay resulted in 1 pair of split signals (arrow) in males (1000x). D. Detection of ASPL-TFE3 translocation by RT-PCR. E. Sequencing analysis of ASPL-TFE3 translocation. F. Detection of PRCC-TFE3 translocation by RT-PCR of cell line and paraffin tissue. G. Sequencing analysis of PRCC-TFE3 translocation. H. Detection of PSF-TFE3 tranlocation by RT-PCR with faint solid one band (arrow). I. Sequencing analysis of PSF-TFE3 translocation.
Molecular analysis of cases with weak TFE3 expression
Wild-type (non-translocated) was detected in five cases among 21 TFE3 weak expression cases. This suggests that weak nuclear TFE3 expression is not only a result of translocation, but is also associated with expression of the full-length TFE3 protein. Similar results have been reported in other studies [18, 19].
DISCUSSION
The diagnosis of translocation RCC has not yet been standardized. An initial diagnosis is usually made based on immunohistochemical detection of TFE3 or TFEB overexpression in the nucleus [13, 20]. However, technical and interpretational challenges remain. For instance, the anti-TFE3 antibody has been shown to be fixation-dependent [13], and it is unclear what intensity of TFE3 immunoreactivity should be considered as positive [21]. Molecular analyses by FISH or RT-PCR are recommended to detect the occurrence of translocation; however, the FISH protocol for TFE3 has not been fully validated and standardized [12, 21, 22]. Moreover, section truncation signal, which means one signal in male and three signals in female cases, also makes it difficult to interpret correctly [14, 22]. FISH is also a labor-intensive and costly technique. In contrast, RT-PCR has the advantages of being less expensive and able to detect TFE3 partner genes. Some studies have reported that different types of fusion have distinct prognoses; for instance, ASPL-TFE3 is associated with unfavorable outcome [23, 24]. However, RT-PCR is difficult to implement in clinical pathology laboratories since it is not readily applicable to FFPE tissue [3, 21, 25]. In this study, we used RT-PCR in FFPE specimens, with the results validated by cloning and sequencing to compare the results of immunohistochemistry, FISH, and RT-PCR.
In the 14 cases of moderate or strong TFE3 immunoreactive group, all of these exhibited TFE3 translocation by either of FISH or RT-PCR. Moreover, immunohistochemistry, FISH, and RT-PCR results were highly concordant, suggesting that moderate or strong TFE3 expression would be indicative of TFE3 translocation. In the 21 cases of TFE3 weak expressed group, only seven of which harbored TFE3 translocation. Of the 145 TFE3-negative cases, 13 were cathepsin K-positive; all of these were negative by FISH but four were positive by RT-PCR. It means that when TFE3 immunoreactivity is weak or associated with cathepsin K expression in morphologically suspicious cases, FISH or RT-PCR is recommended to confirm the occurrence of TFE3 translocation.
Of the 25 cases in which translocation was detected by RT-PCR, 15 were positive by FISH whereas there was no break-apart signal in 10 cases. On the other hand, only two of 17 FISH-positive cases were negative by RT-PCR. This result implies that FISH analysis can yield falsely negative results (10/25, 40.0%) and that RT-PCR would complement FISH analysis for detecting TFE3 translocation. This is because there may be some ambiguity in interpreting break-apart patterns in FISH. In our experience, the interpretation of the FISH signal was complicated by break-apart signals present in about 5%-15% of tumor cells. The different criterion for calling translocation may be another reason. For example, the distance between break-apart signals to be regarded as positive is one or two signal width depending on the different protocols [15, 21]. Thus, the interpretation of FISH signals is somewhat subjective in borderline cases [26].
RT-PCR cannot be carried out for all FFPE tissue specimens due to inadequate RNA quality. However, only five of 53 cases did not meet the quality criteria in the present study. Reducing the time of warm ischemia after nephrectomy and optimizing the RNA extraction protocol may solve this problem. The interpretation of RT-PCR may also be problematic when the band corresponding to the amplified product is faint; however, in our experience, all faint solid one bands in proper position were found to be associated with translocation upon cloning and sequencing. Another advantage of RT-PCR is that it can identify translocation partners. We detected ASPL, PRCC and PSF for translocation partners. The first two are the most common fusion partners of TFE3 [2]; thus, three translocation partners can cover more than 90% of TFE3 partner genes. In our study, the partner genes were 18 for ASPL, six for PRCC, and one for PSF. The cause of this discordance is not clear but relatively small size of cases may be one reason.
The incidence of Xp11 translocation RCC has been variably reported. The largest study examined 443 cases either by cytogenetics or by TFE3 immunohistochemical analysis, and found an incidence of 1.6% [24]. Another group demonstrated that TFE3 was expressed in six of 121 cases (4.9%) [18]. We detected frequencies of 9.7% and 13.5% by FISH and RT-PCR, respectively; this result was confirmed by cloning and sequencing all RT-PCR products. One reason for the lower incidence reported by previous studies may be the fact that immunohistochemistry was used as a primary detection tool, which likely excluded cases with weak expression [13]. In fact, the frequency in the present study was 8.6% when only cases showing moderate to strong TFE3 immunoreactivity were considered. One interesting finding was that most of our patients were not initially diagnosed as translocation RCC, since morphological criteria have yet to be fully defined for this subtype.
In conclusion, we suggest that moderate-to-strong TFE3 staining can be suspicious evidence of Xp11 translocation RCC and the high concordance rate of immunohistochemical and molecular studies is proved. When the protein is weakly or focally expressed, FISH or RT-PCR is recommended to establish a diagnosis for translocation. Cathepsin K expression is non-specific but can be useful for identifying candidates for additional molecular testing. We demonstrated that RT-PCR is highly sensitive and specific and can be used with FFPE tissue. Nonetheless, further studies are necessary to confirm these findings and improve the RT-PCR protocol.
MATERIALS AND METHODS
Patient selection
A total of 185 consecutive RCC cases treated at Pusan National University Yangsan Hospital (Yangsan, Korea) between 2011 and 2015 were enrolled in the study. Tissue blocks and accompanying clinical data were collected under a protocol developed by the investigators with Institutional Review Board approval (no. 05-2016-069).
Immunohistochemistry
All 185 cases were analyzed for TFE3 and cathepsin K expression by immunohistochemistry. FFPE sections (4 μm in thickness) were cut and BOND-MAX autostainer and reagents (Leica BioSystems, Newcastle, UK) were used according to the manufacturer’s instructions. Sections were labeled with primary antibodies for TFE3 (MRQ-37; Cell Marque, Rocklin, CA, USA; 1:100) and cathepsin K (3F9; Abcam, Cambridge, MA, USA; 1:1600). TFE3-positive cases were subdivided into moderate (2+) and strong (3+) expression groups based on labeling intensity, according to guidelines of a previous study [13]. Weak immunoreactivity (1+) was defined as subtle nuclear staining at low magnification. Weak (1+) or undetectable (0) TFE3 expression was considered as the TFE3-negative group [13, 27].
FISH analysis
TFE3 gene rearrangement was detected in cases showing at weak or higher expression of TFE3 or cathepsin K by dual-color, break-apart FISH using ZytoLight SPEC TFE3 Dual Color Break Apart Probes (ZytoVision GmbH, Bremerhaven, Germany). Cases positive for TFE3 by FISH were those expressing split signals in more than 15% of tumor cells [12]. At least 100 nuclei per sample were scored. Only non-overlapping tumor nuclei were evaluated.
Cell culture
The UOK146 RCC cell line, which harbors the t(X;1)(p11.2;q21.2) translocation that generates chimeric PRCC-TFE3, was maintained in Dulbecco’s Modified Eagle’s Medium supplemented with 10% fetal bovine serum and antibiotics (100 U/ml penicillin and 100 μg/ml streptomycin) in a humidified incubator of 5% (v/v) CO2.
RNA extraction and RT-PCR
RNA was extracted from FFPE tissue sections (10 µm in thickness) using an RNeasy FFPE kit (Qiagen, Valencia, CA, USA). RNA of the UOK146 cell was extracted with TRIzol reagent (RiboEx, GeneAll, Seoul, Korea). cDNA was generated using M-MLV reverse transcriptase (Promega, Madison, WI, USA) under the following conditions: 80°C for 3 min; incubation on ice for 5 min; 42°C for 1 h, and 70°C for 15 min. Specimens for which 260/280 or 260/230 nm absorbance ratio was less than 1.8 were excluded due to low RNA quality. PCR reactions were performed with Ex Taq Polymerase (Takara Bio, Otsu, Japan) using the primer set listed in Table 1 under the following conditions: 95°C for 1 min; 35 cycles of 95°C for 20 s, 58°C for 30 s, and 72°C for 27 s; and 72°C for 5 min. Primers were designed to amplify five of the known translocation types (ASPL-TFE3, PRCC-TFE3, PSF-TFE3, CLTC-TFE3, and NonO-TFE3) [4] and wild-type (non-translocated) TFE3 (nucleotides 821-1008).
Cloning and sequencing
To identify ASPL-TFE3, PRCC-TFE3, and PSF-TFE3 transcripts, purified PCR products were ligated into pGEM-T Easy vector (Promega, Madison, WI, USA). The ligation mixture was transformed into competent Escherichia coli JM109 cells by heat shock at 42°C. Transformed cells were spread onto agar plates containing ampicillin (100 μg/ml), isopropyl-β-d-thiogalacto-pyranoside (0.5 mM) and 5-bromo-4-chloro-3-indolyl-β-d-galactopyranoside (80 μg/mg). Blue-white screening was carried out to select recombinant plasmids using the Labopass Mini-prep kit (Cosmo Genetech, Daejeon, Korea). These were digested with EcoRI, which yielded two bands including the target fragment, which was around 200 bp by 2.0% agarose gel electrophoresis. Fusion transcripts were detected with the M13 20F, and 20R primer combination followed by DNA sequencing using the ABI Big Dye Terminator v.3.1 Cycle sequencing kit (Applied Biosystems, Darmstadt, Germany) on an ABI prism 3730XL sequencer (Applied Biosystems). Sequences were compared by BLAST (National Center for Biotechnology Information, NCBI). Protein homology searches were performed with BLASTX 2.4 (NCBI) and the NCBI Conserved Domain Database v.2.4.
ACKNOWLEDGMENTS
The authors thank W.M. Linehan (National Cancer Institute, USA) for providing the UOK 146 cell line.
CONFLICTs OF INTEREST
The authors declare no potential conflicts of interest in the article.
REFERENCES
1. Ross H, Argani P. Xp11 translocation renal cell carcinoma. Pathology. 2010;42:369-373.
2. Argani P, Ladanyi M. Renal carcinomas associated with Xp11.2 translocations/TFE3 gene fusions, In: Eble JN, Sauter G, Epstein JI, Sesterhenn IA (eds). World Health Organization Classification of Tumors: Pathology and Genetics of Tumors of the Urinary Systemand Male Genital Organs. IARC Press: Lyon; 2004, pp 37-38.
3. Argani P, Ladanyi M. Distinctive neoplasms characterised by specific chromosomal translocations comprise a significant proportion of paediatric renal cell carcinomas. Pathology. 2003;35:492-498.
4. Macher-Goeppinger S, Roth W, Wagener N, Hohenfellner M, Penzel R, Haferkamp A, Schirmacher P, Aulmann S. Molecular heterogeneity of TFE3 activation in renal cell carcinomas. Mod Pathol. 2012;25:308-315.
5. Argani P, Zhong M, Reuter VE, Fallon JT, Epstein JI, Netto GJ, Antonescu CR. TFE3-fusion variant analysis defines specific clinicopathologic associations among Xp11 translocation cancers. Am J Surg Pathol. 2016;40:723-737.
6. Argani P, Olgac S, Tickoo SK, Goldfischer M, Moch H, Chan DY, Eble JN, Bonsib SM, Jimeno M, Lloreta J, Billis A, Hicks J, De Marzo AM, et al. Xp11 translocation renal cell carcinoma in adults: Expanded clinical, pathologic, and genetic spectrum. Am J Surg Pathol. 2007;31:1149-1160.
7. Argani P, Antonescu CR, Couturier J, Fournet JC, Sciot R, Debiec-Rychter M, Hutchinson B, Reuter VE, Boccon-Gibod L, Timmons C, Hafez N, Ladanyi M. PRCC-TFE3 renal cell carcinomas: morphologic, immunohistochemical, ultrastructural, and molecular analysis of an entity associated with the t(X;1)(p11.2;q21). Am J Surg Pathol. 2002;26:1553-1566.
8. Malouf GG, Camparo P, Oudard S, Schleiermacher G, Theodore C, Rustine A, Dutcher J, Billemont B, Rixe O, Bompas E, Guillot A, Boccon-Gibod L, Couturier J, et al. Targeted agents in metastatic Xp11 translocation/TFE3 gene fusion renal cell carcinoma (RCC): a report from the Juvenile RCC Network. Ann Oncol. 2010;21:1834-1838.
9. Choueiri TK, Lim ZD, Hirsch MS, Tamboli P, Jonasch E, McDermott DF, Dal Cin P, Corn P, Vaishampayan U, Heng DY, Tannir NM. Vascular endothelial growth factor-targeted therapy for the treatment of adult metastatic Xp11.2 translocation renal cell carcinoma. Cancer. 2010;116:5219-5225.
10. Tsuda M, Davis IJ, Argani P, Shukla N, McGill GG, Nagai M, Saito T, Lae M, Fisher DE, Ladanyi M. TFE3 fusions activate MET signaling by transcriptional up-regulation, defining another class of tumors as candidates for therapeutic MET inhibition. Cancer Res. 2007; 67:919-929.
11. Armah HB, Parwani AV. Renal cell carcinoma in a 33-year-old male with an unusual morphology and an aggressive clinical course: possible Xp11.2 translocation. Pathology. 2008;40:306-308.
12. Sukov WR, Hodge JC, Lohse CM, Leibovich BC, Thompson RH, Pearce KE, Wiktor AE, Cheville JC. TFE3 rearrangements in adult renal cell carcinoma: clinical and pathologic features with outcome in a large series of consecutively treated patients. Am J Surg Pathol. 2012;36:663-670.
13. Argani P, Lal P, Hutchinson B, Lui MY, Reuter VE, Ladanyi M. Aberrant nuclear immunoreactivity for TFE3 in neoplasm with TFE3 gene fusions: a sensitive and specific immunohistochemical assay. Am J Surg Pathol. 2003; 27:750-761.
14. Rao Q, Williamson SR, Zhang S, Eble JN, Grignon DJ, Wang M, Zhou XJ, Huang W, Tan PH, Maclennan GT, Cheng L. TFE3 break-apart FISH has a higher sensitivity for Xp11.2 translocation-associated renal cell carcinoma compared with TFE3 or Cathepsin K immunohistochemical staining alone: Expanding the morphologic spectrum. Am J Surg Pathol. 2013;37:804-815.
15. Qu Y, Gu C, Wang H, Chang K, Yang X, Zhou X, Dai B, Zhu Y, Shi G, Zhang H, Ye D. Diagnosis of adults Xp11.2 translocation renal cell carcinoma by immunohistochemistry and FISH assays: clinicopathological data from ethnic Chinese population. Sci Rep. 2016; 6:21677.
16. Klatte T, Streubel B, Wrba F, Remzi M, Krammer B, de Martino M, Waldert M, Marberger M, Susani M, Haitel A. Renal cell carcinoma associated with transcription factor E3 expression and Xp11.2 translocation: incidence, characteristics, and prognosis. Am J Clin Pathol. 2012; 137:761-768.
17. Hayes M, Peckova K, Martinek P, Hora M, Kalusova K, Straka L, Daum O, Kokoskova B, Rotterova P, Pivovarcikova K, Branzovsky J, Dubova M, Vesela P, et al. Molecular-genetic analysis is essential for accurate classification of renal carcinoma resembling Xp11.2 translocation carcinoma. Virchows Arch. 2015; 466:616-622.
18. Zhong M, De Angelo P, Osborne L, Paniz-Mondolfi AE, Geller M, Yang Y, Linehan WM, Merino MJ, Cordon-Cardo C, Cai D. Translocation renal cell carcinoma in adults: a Single-institution experience. Am J Surg Pathol. 2012;36:654-662.
19. Argani P, Aulmann S, Illei PB, Netto GJ, Ro J, Cho HY, Dogan S, Ladanyi M, Martignoni G, Goldblum JR, Weiss SW. A distinctive subset of PEComas harbors TFE3 gene fusions. Am J Surg Pathol. 2010;34:1395-1406.
20. Argani P, Reuter VE, Zhang L, Sung YS, Ning Y, Epstein JI, Netto GJ, Antonescu CR. TFEB-amplified renal cell carcinomas: An aggressive molecular subset demonstrating variable melanocytic marker expression and morphologic heterogeneity. Am J Surg Pathol. 2016; 40:1484-1495.
21. Zhong M, De Angelo P, Osborne L, Keane-Tarchichi M, Goldfischer M, Edelmann L, Yang Y, Linehan WM, Merino MJ, Aisner S, Hameed M. Dual-color, break apart FISH assay on paraffin-embedded tissues as an adjunct to diagnosis of Xp11 translocation renal cell carcinoma and alveolar soft part sarcoma. Am J Surg Pathol. 2010;34:757-766.
22. Mosquera JM, Dal Cin P, Mertz KD, Perner S, Davis IJ, Fisher DE, Rubin MA, Hirsch MS. Validation of a TFE3 Break-apart FISH assay for Xp11.2 translocation renal cell carcinomas. Diagn Mol Pathol. 2011;20:129-137.
23. Chen X, Yang Y, Gan Y, Xu L, Ye Q, Guo H. Newly designed break-apart and ASPL-TFE3 dual-fusion FISH assay are useful in diagnosing Xp11.2 translocation renal cell carcinoma and ASPL-TFE3 renal cell carcinoma. Medicine. 2015; 94:e873.
24. Komai Y, Fujiwara M, Fujii Y, Mukai H, Yonese J, Kawakami S, Yamamoto S, Migita T, Ishikawa Y, Kurata M, Nakamura T, Fukui I. Adult xp11 translocation renal cell carcinoma diagnosed by cytogenetics and immunohistochemistry. Clin Cancer Res. 2009;15:1170-1176.
25. Ramphal R, Pappo A, Zielenska M, Grant R, Ngan BY. Pediatric renal cell carcinoma: clinical, pathologic, and molecular abnormalities associated with the members of the mit transcription factor family. Am J Clin Pathol. 2006;126:349-364.
26. Ming ST, Fred RH, Yasushi Y. IASLC atlas of ALK testing in lung cancer. IASLC. 2013; pp 25-26.
27. Gaillot-Durand L, Chevallier M, Colombel M, Couturier J, Pierron G, Scoazec JY, Mege-Lechevallier F. Diagnosis of Xp11 translocation renal cell carcinomas in adult patients under 50 years: Interest and pitfalls of automated immunohistochemical detection of TFE3 protein. Pathol Res Pract. 2013;209:83-89.