
INTRODUCTION
Urothelial cancer of the bladder (UCB) is the second most frequent neoplasm of the urogenital tract [1]. UCB is known to be a heterogeneous disease. Non-invasive, well-differentiated tumors (Ta) are relatively indolent, but T1 high-grade-UCB and muscle invasive bladder cancer (≥ T2; MIBC) are known to be life-threatening [2]. Despite advancements in multidisciplinary approaches to treatment, management of these diseases remains challenging and controversial. To improve outcomes, the mechanisms underlying tumor invasion, metastasis, and treatment resistance need to be clarified.
Tumor tissue is composed of cancer cells and various types of stromal cells including endothelial cells, macrophages, and fibroblasts. Their interaction and crosstalk might lead to the formation of a cancer-specific microenvironment for tumor invasion and metastasis. Tumor budding is a pathological condition at the tumor invasion front in which individual tumor cells and/or small clusters of tumor cells invade the stromal area [3, 4]. Tumor budding has been reported to be associated with aggressive phenotypes and poor clinical outcomes in various cancers such as colorectal, esophageal, pancreatic, lung, and breast cancers [3–8]. A recent report by Fukumoto et al. demonstrated that tumor budding was significantly associated with lymphovascular invasion and poor progression-free survival rate [9]. The pathological evaluation of growth patterns at the tumor invasion front in human UCB was first reported by Jimenez et al. in 2000 [10]. The authors classified human invasive UCB into three groups as follows: nodular, trabecular, and infiltrative. The concepts and definitions of infiltrative growth and tumor budding are similar. Subsequent studies including our reports demonstrated that this pathological parameter was a significant prognostic factor for both T1 tumors and MIBC [2, 11–15].
Tumor budding is characterized by disorganization at the tumor architecture level and dedifferentiation at the cellular level. This phenotype is a dynamic process with loss of cell-to-cell junctions, loss of cell-to-basal membrane, loss of cell polarity, versatile cell shape, and presence of cytoplasmic microfilaments and pseudopodia [3, 16]. The expression and membrane localization of E-cadherin and other adhesion molecules are consistently reduced in tumor budding of malignancies including colorectal cancer [3, 16]. Loss of membranous expression of E-cadherin is one of the hallmarks of epithelial-mesenchymal transition (EMT). Previous studies demonstrated that EMT-inducing signaling pathways including TGF-β and Wnt/β-catenin were activated in tumor budding [17]. To date, little has been reported on the connection between EMT and tumor budding, i.e. infiltrative growth pattern, in UCB. In particular, potential molecular events that can trigger tumor budding remain unclear in this malignancy.
A complete understanding of the molecular mechanisms driving tumor budding is essential for overcoming treatment resistance and improving patient outcomes. Based on accumulating evidence of the clinical relevance of tumor budding and infiltrative growth patterns, we investigated the detailed molecular mechanism underlying tumor growth pattern in the present study.
RESULTS
Different growth patterns in orthotopic bladder tumors in mice
Representative H&E images of human UCB tissue show the three patterns; nodlular, trabecular, ad infiltrative patterns (Figure 1A). Four urothelial cancer cell lines were inoculated into the bladder cavities of C.B- 17/severe combined immunodeficiency (SCID) mice. H&E staining of the resected bladders revealed that all cell lines except J82 consistently developed solid bladder masses at 4 weeks after inoculation. In the detailed examination of the murine bladder wall, MGH-U3, UM-UC-14, and UM-UC-3 displayed typical nodular, trabecular, and infiltrative growth patterns, respectively (Figure 1B). UM-UC-3 cells invaded the bladder stroma as single cells, and some cells even penetrated the bladder wall. One visible bladder tumor from each cell line was selected for RNA extraction and cDNA microarray analysis.
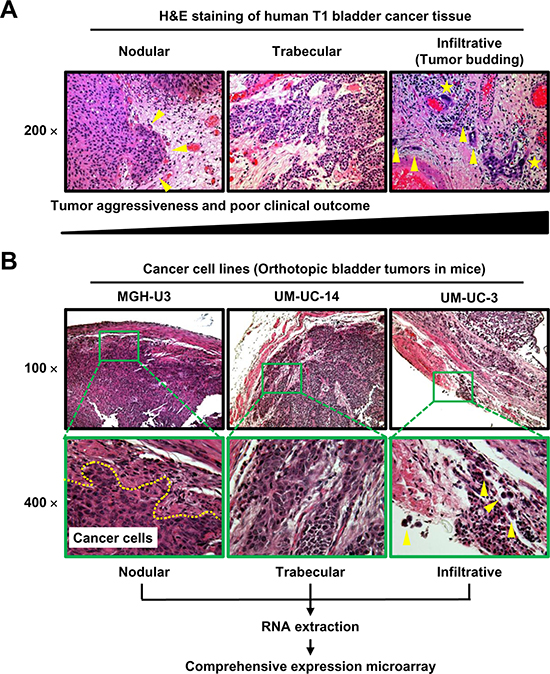
Figure 1: Representative images of H&E-stained specimens of three tumor growth patterns in human UCB (A) and bladder tumors in an orthotopic animal model (B). (A) Nodular (left), trabecular (middle), and infiltrative (right) tumor growth patterns shown in the stroma around the tumor area. Yellow arrowheads indicate isolated tumor cells or small clusters of tumor cells (buds). Yellow stars indicate tumor cells with high N/C ratio and abnormal shape. According to previous reports [2, 11–15], the nodular pattern is the most indolent phenotype, while the infiltrative growth pattern (tumor budding) is the most aggressive phenotype and is associated with poor outcomes. (B) All images were captured at 100× and 400× magnification. The dashed line in the 400× image of an MGH-U3 tumor indicates the invasion front. Yellow arrowheads in the 400× image of a UM-UC-3 tumor indicate cells that invade the bladder stroma as single cells, with some cells even penetrating the bladder wall. One visible bladder tumor from each cell line was subjected to RNA extraction and cDNA microarray analysis.
Upregulation of COL4A1 and COL13A1 in aggressive infiltrative growth pattern
To gain insights into mechanisms underlying the formation of the aggressive growth pattern, we performed comprehensive gene expression analysis for MGH-U3 (nodular pattern), UM-UC-14 (trabecular pattern), and UM-UC-3 (infiltrative pattern). Standard selection criteria to identify genes that were significantly upregulated in the infiltrative pattern (lowest expression in MGH-U3, intermediate expression in UM-UC-14, and highest expression in UM-UC-3) were as follows: > 2-fold upregulation (log2 fold-change > 1) in UM-UC-14 vs. MGH-U3 and > 8-fold upregulation in UM-UC-3 (log2 fold-change > 3) vs. MGH-U3. Out of 24460 genes, 74 met these criteria, and a heatmap was generated based on their expression profiles (Figure 2A). To search for potentially significant genes, we applied the following additional criteria: > 2-fold upregulation (log2 fold change > 1) in UM-UC-14 vs. MGH-U3 and > 8-fold upregulation (log2 fold change > 3) in UM-UC-3 vs. UM-UC-14. Among 74 genes selected by the initial screening (Figure 2A), 16 genes were identified as strong candidates as shown in Figure 2B and 2C. Among these 16 candidates, some genes, including ZNF503 and ISG20, have been previously found to have oncogenic roles [18, 19]; however, other genes, including HRASLS and DAB2, have been reported to play a role in tumor suppression [20, 21]. Notably, two collagen genes, collagen type IV A1 (COL4A1) and collagen type XIII A1 (COL13A1), were included in the list and were upregulated by 23-fold and 38-fold, respectively, in UM-UC-3 tumors as compared to MGH-U3 tumors. We hypothesized that altered expression levels of these collagens may contribute to the formation of infiltrative growth patterns.
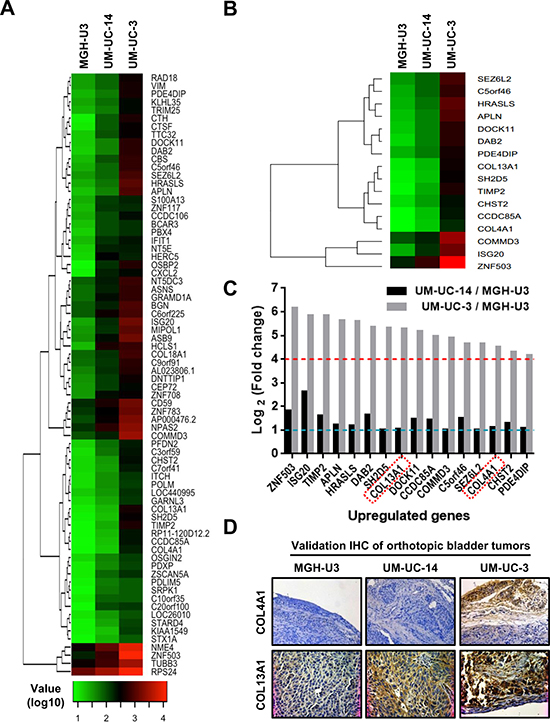
Figure 2: Genome-wide expression analysis in orthotopic bladder tumors resected from SCID mice. (A) Heatmap representing 74 probes showing > 2-fold upregulation in UM-UC-14 vs. MGH-U3 and > 8-fold upregulation in UM-UC-3 vs. MGH-U3. Heatmap was created by log10 transformation of global normalized gene expression values, and probes are ordered based on the complete-linkage hierarchical clustering method. (B) Heatmap representing 16 significant probes with > 2-fold upregulation in UM-UC-14 vs. MGH-U3 and > 8-fold upregulation in UM-UC-3 vs. UM-UC-14. Global normalized gene expression values of selected probes were log10 transformed, and probes are clustered in rows based on the complete-linkage hierarchical clustering method. (C) We applied criteria to identify potentially significant genes with > 2-fold upregulation (log2 fold-change > 1, dashed blue line) in UM-UC-14 vs. MGH-U3 and > 8-fold upregulation (log2 fold-change > 3, dashed red line) in UM-UC-3 vs. UM-UC-14. Two collagens, COL4A1 and COL13A1, were selected for further analysis (red rectangles). (D) Validation of expression levels by immunohistochemical staining. Representative images of three orthotopic bladder tumors resected from SCID mice and stained for COL4A1 and COL13A1. Staining results are consistent with those of microarray profiling. All images were captured at 100× magnification.
Immunohistochemical (IHC) staining of the murine bladders was performed to validate the results of the microarray (Figure 2D). COL4A1 and COL13A1 predominantly localized to the stromal area around the tumor site and the cytoplasm of tumor cells, respectively. There was almost no expression of COL4A1 in MGHU-3 and UM-UC-14 cells, whereas high expression was observed in the stromal area of the UM-UC-3-derived bladder tumor. MGH-U3, UM-UC-14, and UM-UC-3 tumors showed weak, intermediate, and high expression of COL13A1, respectively.
To investigate genes whose expression levels were altered by at least 2-fold in UM-UC-14 vs. MGH-U3, in UM-UC-3 vs. MGH-U3, and in UM-UC-3 vs. UM-UC-14, these genes and their corresponding log2 fold-change values were analyzed with IPA software. The core analysis function in IPA revealed 22 biological networks from our dataset containing 279 differentially expressed genes (161 up- and 118 down-regulated) in UM-UC-3 vs. MGH-U3. From among these 22 networks, we identified only one network containing COL4A1, which was associated with connective tissue disorders, organismal injury and abnormalities, and cancer (Figure 3, top). The network included invasion-related proteins (MMP1, MMP19, and TIMP2) and other collagens (COL5A1 and COL18A1). COL4A1 and COL13A1 were found in separate networks according to IPA. COL13A1 was found in a network that was associated with dermatological diseases and conditions, organismal injury and abnormalities, and cancer Figure 3, bottom. This network included EMT-related proteins (cadherin and catenin), pro-inflammatory cytokines, growth hormones, and estrogen.
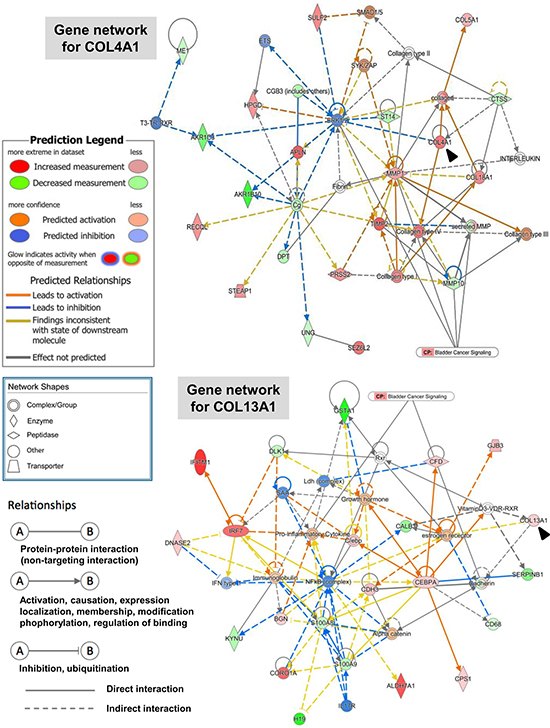
Figure 3: Gene network containing COL4A1 and COL13A1 generated through ingenuity pathway analysis. Gene networks for COL4A1 (top) and COL13A1 (bottom) and several of their interaction partners were generated through Ingenuity Pathway Analysis (IPA). Black arrowheads indicate COL4A1 and COL13A1. Colored nodes are shaded by their relative expression (green with low expression and red with higher expression), with color intensity indicating relative expression. The shape of the node indicates the major function of the protein. Lines denote biding of the products of the two genes, while a line with an arrow denotes that one protein acts on another. A dotted line denotes an indirect relationship, and a solid line denotes a direct relationship.
IHC analysis of COL4A1 and COL13A1 in murine and human bladder tumors
IHC evaluation of human UCB tissues obtained from 97 patients revealed similar staining patterns for COL4A1 and COL13A1 as those in the orthotopic murine bladder tumors. Figure 4A shows representative images of human UCB tissues with nodular, trabecular, and infiltrative patterns. An example of a tumor with a trabecular pattern shows heterogeneous COL4A1 expression in the stroma around the tumor lesion (Figure 4A, upper-middle panel). The tumor with the infiltrative pattern exhibited strong collagen expression. COL4A1 and COL13A1 expression was notably increased in the trabecular and infiltrative patterns compared with that in the nodular pattern (P = 0.017 and 0.012, respectively; Figure 4B and 4C), implying that the expression of these two collagens increases biological aggressiveness and tumor invasiveness in human UCB. Moreover, COL4A1 and COL13A1 expression was associated with higher T category (P = 0.045 and 0.041, respectively; Supplementary Table 1).
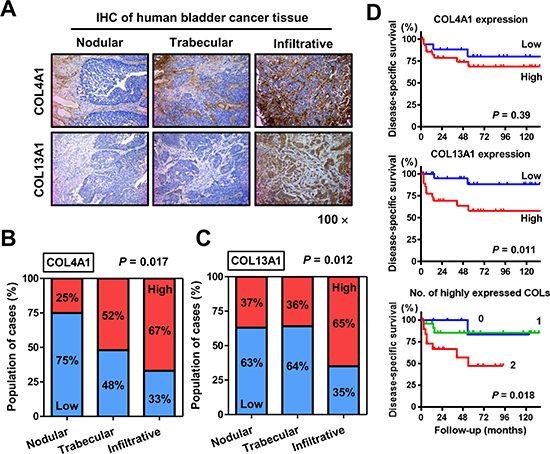
Figure 4: Immunohistochemical (IHC) staining analysis of COL4A1 and COL13A1 in bladder tumor tissues. (A) Representative images of human UCB with nodular, trabecular, and infiltrative growth patterns. COL4A1 and COL13A1 expression levels are increased in T1 high-grade tumors with infiltrative growth patterns. All images were captured at 100× magnification. (B, C) Quantification of expression levels of COL4A1 (B) and COL13A1 (C) in three growth patterns. Blue bars and red bars indicate percentages of the population with low expression and high expression, respectively. Data are based on analysis of 97 human bladder tumors. (D) Disease-specific survival curves of patients with MIBC after radical cystectomy according to expression levels of COL4A1 (top) or COL13A1 (middle) or according to the number of highly expressed collagens (bottom). The log-rank test (top, middle) or the log-rank test for trend (bottom) was used for comparison.
Of the 97 patients, 57 (59%) were diagnosed with MIBC and treated with RC. Kaplan–Meier analysis of MIBC patients showed that high expression of COL13A1, but not COL4A1, was significantly associated with poor outcomes after RC (Figure 4D). When patients were stratified into three groups depending on the number of highly-expressed collagens, 11 (19%) patients exhibited high expression of neither COL13A1 nor COL4A1, 6%) exhibited high expression of one of these, and the remaining 20 (35%) exhibited high expression of both. The hazard ratios were and 1.28 (95% confidence interval: 0.15–10.9) and 3.51 (1.21–13.6) for cases with one and two highly expressed collagens, respectively, compared with that of cases with neither collagen highly expressed, showing that disease-specific survival (DSS) decreased dramatically as the number of highly expressed collagens increased (Figure 4D).
Change in invasion pattern and capability following downregulation of COL4A1 and COL13A1
To confirm that these two collagens produced in UCB are associated with the formation of the tumor growth pattern, in vitro experiments using MGH-U3 and UM-UC-3 were performed with siRNA transfection targeting collagens and 1,4-dihydrophenonthrolin-4-one-3- carboxylic acid (1,4-DPCA) a potent inhibitor of collagen deposition. To determine the 50% inhibitory concentration (IC50) of 1,4-DPCA, proliferation sigmoid curves were generated as previously described [22]. The IC50 values in MGH-U3, UM-UC-14, and UM-UC-3 cells were 4.3, 8.4, and 10.3 μM, respectively (Supplementary Figure 1). In order to avoid affecting proliferation, 1 μM (almost no effect on cell proliferation) of 1,4-DPCA was used for further experiments. Western blot analysis of UM-UC-3 confirmed effective downregulation of COL4A1 and COL13A1 at the protein level by siRNA transfection (Figure 5A). In contrast, 1,4-DPCA inhibited the production of COL4A1, but did not affect the level of COL13A1.
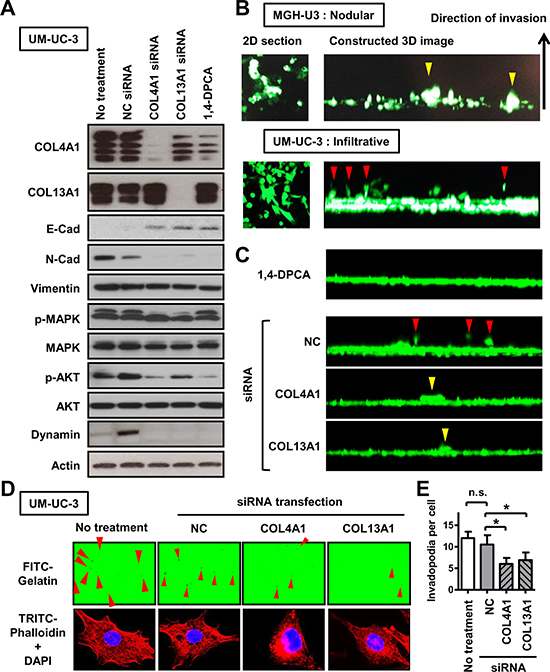
Figure 5: The association of COL4A1 and COL13A1 produced in UCB cells with the formation of the infiltrative growth pattern. (A) EMT-related markers, proteins involved in the activation of intracellular signaling pathways, and an invadopodia-related marker were quantified by western blot analysis in UM-UC-3 cells, which has high endogenous expression of COL4A1 and COL13A1 proteins. The list of antibodies and conditions are shown in Supplementary Table 3. Actin was used as a loading control. Four bands for COL4A1 and two bands for COL13A1 were detected. (B) Representative images of results of 3-D collective inverse invasion assay of MGH-U3 and UM-UC-3 cells. Optical 2-D sections of cells stained with calcein AM invading Matrigel, taken at 10-μm intervals by confocal microscopy. Right panels represent reconstructed 3-D images of cell invasion from a stack of confocal Z-series images, viewed from the side. Yellow and red arrowheads indicate nodular invasion pattern of MGH-U3 and infiltrative invasion pattern of UM-UC-3, respectively. (C) Representatives of 3-D images of UM-UC-3 cells treated with 1 μM 1,4-DPCA or transfected with NC siRNA, COL4A1 siRNA, or COL13A1 siRNA are shown. Red and yellow arrowheads indicate infiltrative and nodular invasion patterns, respectively. (D) Representative images of FITC-gelatin degradation invadopodia assay using non-treated or NC siRNA-, COL4A1 siRNA-, or COL13A1 siRNA-transfected UM-UC-3 cells. Co-localization of matrix degradation spots with phalloidin-stained F-actin validates these foci as invadopodia. Red arrowheads indicate formed invadopodia. Images were captured by microscope objective lens with synthetic oil immersion at high magnification of 1,000×. (E) The number of formed invadopodia was counted and quantified for 20 cells in each group. Data are expressed as the mean ± SD of three independent experiments; *P < 0.05.
Based on the results of network analysis (Figure 3), we analyzed levels of EMT-related proteins (cadherins and vimentin), an invadopodia-related protein (dynamin), and intracellular signaling pathway proteins (MAPK and AKT) after inhibition of endogenous collagens. On the basis of the loss of E-cadherin and the expression of N-cadherin and vimentin in parental UM-UC-3 cells, this cell line could be characterized as aggressive. E- to N-cadherin switching was observed following downregulation of COL4A1 and COL13A1, indicating an association between the two collagens and the promotion of EMT. In addition, our analysis suggested that both collagens could be activators of the PI3K/AKT pathway, which plays critical roles in regulating diverse cellular functions including metabolism, growth, proliferation, survival, transcription, and protein synthesis. Integrins are transmembrane receptors consisting of one α and one β subunit and are involved in various cellular functions including cell growth, differentiation, would healing, angiogenesis, and vasculogenesis [23]. Integrins α1β1 and α2β1 have been reported to act via collagen binding. We examined if the expression levels of the genes encoding integrins α2 and β1 were altered by knockdown of COL4A1 and COL13A1. However, these expression levels were not affected by knockdown of their ligands (Supplementary Figure 2).
When the growth patterns at the invasion fronts of UCB cells were examined using a 3-D matrix comprised of Matrigel, MGH-U3 cells invaded as well-formed nodular-like collectives, whereas UM-UC-3 cells invaded in spindle-shaped single cells, consistent with the infiltrative pattern (Figure 5B). However, downregulation of collagens dramatically decreased invasion capability and altered invasion patterns (Figure 5C). Individual knockdown of either COL4A1 or COL13A1 hampered the formation of the infiltrative pattern and cell budding and resulted in the nodular pattern, which is the most indolent phenotype. Tumor invasion requires the initiation of path generation in leading cells and proteolytic remodeling of the extracellular matrix (ECM). To investigate whether collagens produced in cancer cells promote invadopodial formation, UM-UC-3 cells were seeded on wells coated with fluorescent gelatin. UM-UC-3 cells without any treatment (control) exhibited many F-actin-rich protrusions into the gelatin, which were indicated by dark spots generated by degradation of the protein matrix (Figure 5D, left). Co-localization of matrix degradation spots with phalloidin-stained F-actin validates these foci as invadopodia. Collagen knockdown reduced the number of invadopodial structures per cell (Figure 5D and 5E) and the expression of dynamin I/II.
Our findings suggest that COL4A1 and COL13A1 produced in UCB cells promote invasive capability and the formation of the infiltrative growth pattern via the upregulation of EMT and invadopodia-related proteins through activation of the AKT pathway.
Confirmatory in vivo study of intravesical collagen blockade therapeutic approach
To investigate the therapeutic potential of collagen blockade as an intravesical approach, we created an in vivo orthotopic experimental model of bladder tumor and performed siRNA-mediated inhibition of collagens. The experimental design is shown in Figure 6A. Two weeks after intravesical implantation of UM-UC-14 and UM-UC-3, intravesical treatment using siRNA against both COL4A1 and COL13A1 (COLs siRNA) or NC siRNA was performed once a week for three weeks (n = 5 each treatment group). One week after completion of the intravesical therapy, animals were euthanized and bladders were harvested. We pathologically evaluated the T category and tumor growth pattern when the T category was ≥ pT1. The sizes and weights of resected bladder tumors treated with COLs siRNA were not apparently different from those treated with NC siRNA (data not shown). A comparison of the pathological diagnoses of NC siRNA-treated bladder tumors and COLs siRNA-treated bladder tumors is depicted in Figure 6B. Of five UM-UC-14-derived bladder tumors treated with NC siRNA, two (40%) showed trabecular growth patterns, and one (20%) showed a nodular growth pattern. When treated with COLs siRNA, one mouse (20%) developed a T1 tumor with a nodular growth pattern, one had a small Ta tumor, and the remaining three (60%) did not show any evidence of tumor growth. Of five UM-UC-3-derived bladder tumors treated with NC siRNA, three (40%) showed infiltrative growth patterns, and one (20%) showed a trabecular growth pattern. When treated with COLs siRNA, one mouse (20%) developed a T1 tumor with a nodular growth pattern, two (40%) had Ta tumors, and the remaining two did not show any evidence of tumor growth. Representative images of NC siRNA-treated bladder tumors and COLs siRNA-treated bladder tumors demonstrated inhibition of the formation of the infiltrative growth pattern (Figure 6C). Thus, COL4A1 and COL13A1 production in cancer cells supports their high invasion capability into the bladder wall and promotes subsequent tumor progression and metastasis in orthotopic bladders.
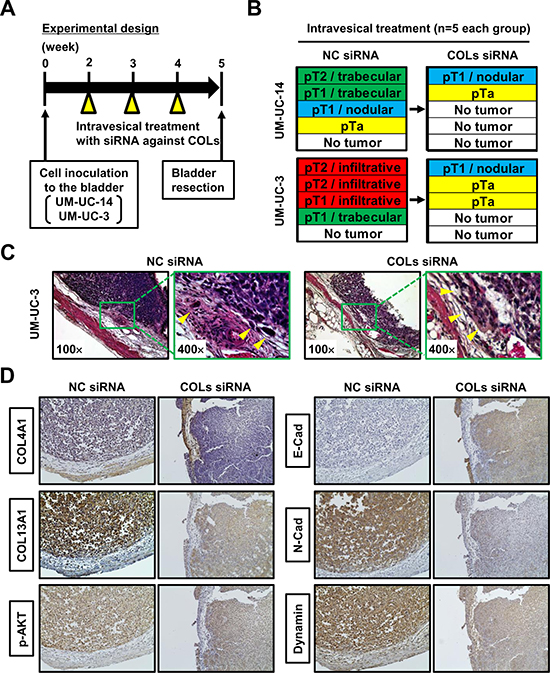
Figure 6: Orthotopic animal experiments for intravesical collagen blockade therapeutic approach. (A) Experimental design used in this study. (B) After completion of treatment, resected bladders from each group (n = 5/group) were subjected to H&E staining. Pathological diagnoses of NC siRNA-treated bladder tumors and COLs siRNA-treated bladder tumors were compared in two UCB cell lines. (C) Representative H&E images of NC siRNA-treated bladder tumor and COLs siRNA-treated bladder tumors demonstrated inhibition of the formation of the infiltrative growth pattern following COLs siRNA treatment. All images were captured at 100× and 400× magnification. (D) Representative image of immunohistochemical staining of NC siRNA-treated bladder tumor and COLs siRNA-treated bladder tumors. The images demonstrate the modulation of proteins related to the expression of COLs. All images were captured at 100× magnification.
Immunostaining analysis of orthotopic bladder tumors showed that both COL4A1 and COL13A1 were knocked down by intravesical treatment with COLs siRNA (Figure 6D). Along with the knocking down of two collagens, decreased phosphorylated AKT, N-cadherin, and dynamin were observed whereas increased membranous expression of E-cadherin was seen. These results were compatible with those of in-vitro analysis (Figure 5A).
DISCUSSION
Migration and invasion of cancer cells are heterogeneous processes consisting of cell–cell and cell–matrix adhesion, cytoskeletal polarity, and pericellular proteolysis under pathological conditions [24, 25]. Structural and molecular modulation of cancer cell behavior and the peritumoral environment determine whether cells migrate and invade stromal tissues collectively (nodular/trabecular pattern) or individually (infiltrative pattern) (Figure 1). Friedl et al. reviewed detailed mechanisms of cell migration and classified them according to migration modes: collective, amoeboid, or mesenchymal [24]. Each migration mode is controlled minutely and dynamically by a set of molecular mechanisms. For instance, collective cell migration allows epithelia, ducts, glands, and vessels to build and regenerate complex tissues, but it also contributes to cancer progression by local invasion [26]. In contrast, amoeboid/mesenchymal single-cell migration is essential for neural crest cell integration into tissues, for moving to another location in the body, and for fulfilling effector functions for immune cell trafficking [24, 27]. This process is linked strongly with cancer remote metastasis, in which cancer cells migrate and invade individually though the ECM to circulate in the bloodstream [28]. In a recent publication, the infiltrative pattern and tumor budding at the tumor invasion front were significantly associated with high malignant potential and poor clinical outcome in both MIBC and MIBC as well as colorectal cancer [2, 9, 14, 15]. However, the molecular keys to each migration mode are not yet fully understood.
We implemented a unique experimental strategy for generating animal models with nodular, trabecular, and infiltrative growth patterns in the bladder. RNA expression patterns are significantly affected by the environment in which tumor cells grow [29, 30]. A previous study revealed that genes with a pattern of higher expression in in vivo xenograft tumors compared with that in in vitro tissue culture encoded proteins involved in the ECM and cell surface receptors [30]. In the present study, an orthotopic bladder tumor model in SCID mice was generated on the basis that this model could be expected to show mRNA expression profiles similar to that in human UCB. Mouse bladders were resected and processed for comprehensive gene expression analysis. The analysis of three cell lines with nodular, trabecular, and infiltrative patterns identified several genes that may be associated with the formation of cancer migration and invasion patterns (Figure 2B). Among these candidates, two collagens were selected for further functional analysis. COL4A1 and COL13A1 were up-regulated by 22.6-fold and 38.5-fold, respectively, in UM-UC-3 vs. MGH-U3. COL4A1 and COL13A1 are subunits of the type IV collagen and type XIII collagen, respectively.
Collagen type I is the most abundant collagen in the human body, while collagen type IV is the most abundant and essential in basement membranes (BMs). The BM is a specialized form of ECM consisting of collagen type IV, laminin, fibronectin, and entactin. The BM acts as a critical component regulating tumor cell behavior, as not only a structural feature of tissues but also a functional component of blood vessels, which constitute a microenvironment sensor for endothelial cells and pericytes [31]. A couple of previous reports demonstrated that COL4A1 plays an important role in angiogenesis and tumor progression [31, 32]. Collagen type XIII is a transmembrane protein localized in cell-cell and cell-ECM junctions [33, 34]. This type of collagen has not been well studied, especially in the oncological field. In 2008, Tuomisto et al. demonstrated that collagen type XIII is a determinant of BM structure in mouse intestines. This report concluded that collagen type XIII might work normally as a tumor suppressor gene in the development of intestinal microbe-dependent lymphomas [35]. However, there was no investigation into the association between collagen type XIII and disease progression and metastasis.
The present study investigated the association of COL4A1 and COL13A1 with tumor invasion and progression using in vitro and in vivo experimental models and clinical materials of human UCB. We first demonstrated that expression of COL13A1 in UCB cells potentially causes a significant increase in invasion capability via the formation of the infiltrative invasion pattern and invadopodia. It has been reported that the activation of TGF-β and Wnt/β-catenin may promote EMT, resulting in the tumor infiltrative pattern or tumor budding [17]. However, our findings demonstrate that COL4A1 and COL13A1 produced in UCB cells activate the intracellular AKT signaling pathway, which leads to an E/N-cadherin switch (Figure 4A). Figure 7 depicts a schematic diagram of the proposed mechanism including the crucial roles of COL4A1 and COL13A1 in human UCB. Previous studies suggested that the induction of collagens including COL1A1 and COL4A1 is regulated by chemokine signaling (CXCR7) and downstream pathways such as PI3K/AKT and NF-κB [31, 32]. COL6A3, an ECM protein, has been identified as the clinically relevant collagen in colorectal, ovarian, and pancreatic cancer [36–38]. COL6A3 protein and mRNA are significantly upregulated not only in colorectal cancer cells but also in the stromal cells of tumor lesions, which promote tumor growth by modulating Hippo and Wnt signaling [36, 39]. The upregulation of COL6A3 protein and mRNA in the cancer stroma predicts poor outcomes in patients with colorectal cancer [36, 39]. Collectively, these data suggest that collagen upregulation in the tumor microenvironment may play a critical role in human cancer.
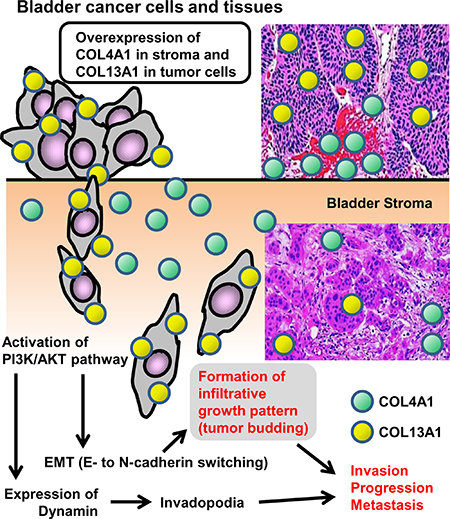
Figure 7: Schematic diagram of the proposed mechanism for COL4A1 and COL13A1 in human urothelial carcinoma of the bladder. COL4A1 (green circle) and COL13A1 (red circle) are localized to the stromal area around the tumor site and the cytoplasm of tumor cells, respectively. Overexpression of these two subunits of collagen in the tumor lesion leads to tumor invasion, progression, and eventually metastasis. EMT = epithelial-mesenchymal transition.
One limitation of this study is that only one cell line was subjected to microarray analysis for each tumor growth pattern. Usage of multiple cell lines for each pattern would provide more reliable and accurate results. However, we believe that this limitation was not critical because the in vitro and in vivo experiments for validation successfully revealed the clinical relevance of the selected collagens, COL4A1 and COL13A1.
Our study provides novel and comprehensive insight into the tumor microenvironment of human UCB. Knowledge of the underlying mechanism of the formation of tumor budding and the infiltrative growth pattern will facilitate the search for an alternative treatment approach for targeting the tumor microenvironment of UCB. Novel small-molecule inhibitors, neutralizing antibodies, or anti-sense nucleotides disrupting COL4A1 and COL13A1 should be developed and tested in patients with bladder cancer refractive to conventional therapies.
MATERIALS AND METHODS
Patient selection and data collection
The Ethics Committee of the Nara Medical University approved this study, and all participants provided informed consent (reference number: 1256). The study was conducted on 97 patients with pathologically diagnosed UCB who were treated by transurethral resection of bladder tumor (TURBT) and/or radical cystectomy (RC) between 2002 and 2016. Patient demographics are shown in Supplementary Table 2. Clinical information and follow-up data were collected by retrospective chart review. Follow-up was performed according to our institutional protocol [2, 15].
Assessment of growth patterns and tumor budding in human UCB
The growth pattern at the tumor invasion front and tumor budding were determined histologically by a combination method according to Jimenez’s definition [10] and Ueno’s definition (10 buds in a 25× field) [40], which is the most commonly applied method in previous studies. Briefly, the nodular pattern was composed of mostly well-formed, rounded, and circumscribed nests of tumor cells invading the stroma. The trabecular pattern was composed of tumor broad trabeculae, which anastomosed with each other. Trabeculae thicknesses are ≥ 3 cells. The infiltrative pattern was composed of isolated single cells or small clusters consisting of a few cells [10]. However, in the present study, we regarded tumors that met the definition of infiltrative pattern defined by Jimenez et al. [10] and those characterized by tumor budding as defined by Ueno et al. [40] as infiltrative tumors. The most aggressive pattern was recorded for each case when tumors displayed more than one pattern (Figure 1A).
Cell lines, reagents, and siRNA transfection
Four urothelial cancer cell lines, MGH-U3 (a generous gift from Dr. H. LaRue at Laval University Cancer Research Centre, Quebec, Canada), UM-UC-14 (Sigma-Aldrich, St. Louis, MO, USA), J82 (ATCC, Manassas, VA, USA), and UM-UC-3 (ATCC) were used in the present study. Cell lines were authenticated by analysis of their genetic alterations. Cell lines were maintained in RPMI-1640 media supplemented with 10% fetal bovine serum (FBS), 100 units/mL penicillin, and 100 μg/mL streptomycin in a standard humidified incubator at 37°C in 5% CO2. An inhibitor of prolyl 4-hydroxylase and collagen deposition, 1,4-DPCA was purchased from Cayman Chemical (Ann Arbor, MI, USA) and dissolved in DMSO.
siRNA transfection was performed by a reverse transfection method as previously described [41]. Double-stranded siRNA targeting human COL4A1 (siRNA ID# s3287) and COL13A1 (siRNA ID# s3350), and negative control (NC) siRNA were synthesized by Thermo Fisher Scientific (Waltham, MA, USA). UM-UC-3 cells were transfected for 48 h with siRNA using 6-well plates with 100 pmol of siRNA and 5 μL of Lipofectamine™ RNAiMAX Transfection Reagent (Thermo Fisher Scientific) according to the manufacturer’s directions.
Orthotopic bladder cancer model and treatment design
Approval for the animal studies was obtained from the Committee on Animal Research of the Nara Medical University (reference numbers: 11343 and 11416). Specific pathogen-free 6-week-old female SCID mice were used (Oriental Bio Service, Kyoto, Japan). Four animals were included for each cell line (MGH-U3, UM-UC-14, J82, and UM-UC-3). To generate the orthotopic bladder tumor models, 2 × 10⁶ cells were inoculated into the bladder cavities of SCID mice by 24-gauge angiocatheters (Surflo®; Terumo Corp, Tokyo, Japan) as described previously [41]. Four weeks after inoculation, mouse bladders were resected to evaluate the tumor growth pattern at the invasion front by H&E staining and processed for RNA extraction and comprehensive gene expression analysis.
For analysis of intravesical treatment, UM-UC-14 and UM-UC-3 were implanted into the bladders of female SCID mice. Intravesical treatment of siRNA was performed as previously described [42]. Two weeks later, intravesical treatment was initiated. RNAiMAX reagent (50 μL) containing 100 nM siRNA (cocktail of 50 nM COL4A1 siRNA and 50 nM COL13A1 siRNA) was added to 50 μL of PBS to prepare a final volume of 100 μL. The complex was delivered and allowed to dwell in the bladder for 2 h by occlusion of the urethra with a purse string suture. Intravesical therapy was administered weekly for a total of three weeks. One week after completion of intravesical therapy, animals were euthanized, and bladders were harvested and processed for H&E examination.
Gene microarray and network analysis using ingenuity pathway analysis
Total RNA was extracted from orthotopic bladder tumors of human urothelial cancer cells using Arcturus® Paradise® PLUS 2 Round Kit-Amino Allyl (Life Technologies, Carlsbad, CA, USA) and analyzed with a 3D-Gene Human Oligo chip 25K (Toray Industries, Inc., Tokyo, Japan) according to the manufacturer’s protocol (www.3d-gene.com). Obtained RNA was transcriptionally amplified once using the Amino Allyl MessageAMP II aRNA Amplification Kit (Applied Biosystems, CA, USA) and labeled with Cy5 dye (GE Healthcare, Buckinghamshire, England). The Cy5-labeled aRNA pools were mixed with hybridization buffer and hybridized for 16 h. The hybridization signals were obtained using a 3D-Gene Scanner (Toray Industries Inc.) and processed by 3D-Gene Extraction (Toray Industries Inc.). Detected signals for each gene were normalized by a global normalization method (the median of the detected signal intensity was adjusted to 25). A total of 279 genes with fold-changes greater than 2 in all comparisons (UM-UC-14 vs. MGH-U3, UM-UC-3 vs. MGH-U3, and UM-UC-3 vs. UM-UC-14) were used for molecular network and pathway analysis using Ingenuity Pathway Analysis (IPA, http://www.ingenuity.com) software.
Immunohistochemical staining and quantification
IHC staining using paraffin-embedded, formalin-fixed tissue blocks was performed as previously described [42, 43]. Information on the antibodies used is available in Supplementary Table 3. Only sections with visible stromal or cancer cells were included in the analysis. Quantification of collagen expression was carried out by two investigators (S. Hori and Y. Tatsumi) blinded to knowledge of the patients’ outcomes or other clinicopathological characteristics. Because the dominant localization of COL4A1 was the stromal area around the tumor, immunoreactivity was evaluated semi-quantitatively by the scoring method for cancer-associated fibroblasts as previously described [42], which was based on the number of COL4A1-positive cells in at least three independent fields as follows: 0, none or a small number of positive cells surrounding less than half of the border; 1, a moderate number of positive cells surrounding less than half of the border; or 2, a large number of positive cells surrounding more than half of the border. The expression level of COL4A1 was determined as follows: low (scores 0 or 1) or high (score 2). COL13A1 expression in cancer cells was semi-quantified in at least five independent fields. Briefly, the proportion (0 = 0% of cells; 1 = 1−40%; 2 = 41−75%, and 3 = 76−100%) and intensity scores were added to obtain a combined IHC score [43] ranging from 0 to 6 as follows: low (0–3) or high (4–6).
Western blot analysis
Western blotting was performed as previously described [42]. Primary antibodies are listed in Supplementary Table 3.
Three-dimensional (3-D) cell invasion assay
To evaluate the infiltration patterns of tumor cells in-vitro, 3-D collective cell invasion assay was performed using phenol red-free growth factor-reduced Matrigel (BD Biosciences, San Jose, CA) and the BD Falcon Insert System as previously reported [44]. The video component of the report can be found at http://www.jove.com/video/3525/. Briefly, 100 μL of Matrigel diluted with PBS (1:1) was pipetted into Transwell inserts with 8-μm pore membranes in a 24-well plate and incubated for 30 min at 37°C to solidify. The Transwell inserts were inverted and 100 μL of the cell suspension (4 × 10⁴ cells of MGH-U3 or UM-UC-3 cells) were pipetted onto the upward facing underside of the membranes. The inserts were covered with the base of a culture plate, making contact with each droplet of cell suspension. After incubation in the inverted state for 4 h to allow cell attachment, the Transwells were turned right side up and placed in wells of a 24-well plate containing serum-free RPMI. Growth medium containing 10% FBS as a chemoattractant was added to the Transwell on top of the solidified Matrigel, and the plate was incubated for 5 days at 37°C. To image tumor cells invading Matrigel, 500 μL of 4 μM calcein AM fluorscent dye (PromoKine, Heidelberg, Germany) was poured on top of each Matrigel plug, followed by incubation for 1 h at 37°C in 5% CO2 humidified atmosphere. The Transwells were placed on large coverslips over a non-immersion 20× objective, and optical sections were captured every 10 μm from the bottom of the Matrigel plug using a confocal laser microscope FV1200 (Olympus, Tokyo, Japan). Individual optical slices were used to build 3-D objects using FLUOVIEW software (Olympus).
Gelatin degradation assay
Invadopodial formation was evaluated using QCMTM Gelatin Invadopodia Assay (Millipore, Billerica, MA, USA; cat No. ECM670) according to the manufacturer’s instructions. Briefly, UM-UC-3 was transfected by NC siRNA, COL4A1 siRNA, or COL13A1 siRNA. After a 48-h incubation, cells were trypsinized, and 20,000 cells were seeded per well of a Lab-Tek 8-well chamber slide, which was pre-coated with FITC-labeled gelatin. After a 24-h incubation at 37°C, cells were fixed with 4% paraformaldehyde and stained with TRITC-phalloidin and DAPI for immunofluorescence microscopy (Leica DMI 4000B, Wetzlar, Germany). Invadopodia were visible as dark spots devoid of fluorescence. The number of formed invadopodia was counted and quantified for 20 cells in each group.
Statistical analysis
DSS from the day of RC were obtained using the Kaplan–Meier method and compared by the log-rank test or log-rank test for trend. Data were visualized by bar charts or box plots, and the Student’s t-test or Mann–Whitney U-test was applied for statistical analysis as appropriate. PRISM software version 5.00 (San Diego, CA, USA) was used for statistical analyses and plotting the data. P < 0.05 was considered statistically significant.
Abbreviations
UCB: urothelial cancer of the bladder, MIBC: muscle invasive bladder cancer, EMT: epithelial-mesenchymal transition, DSS: disease-specific survival and 1,4-DPCA: 1,4-dihydrophenonthrolin-4-one-3- carboxylic acid TURBT: transurethral resection of bladder tumor, RC: radical cystectomy, COL4A1: collagen type IV A1, COL13A1: collagen type XIII A1, SCID: severe combined immunodeficiency, IHC: immunohistochemistry, BM: basement membrane
Authors’ contributions
MM, YN, and NT contributed to the design of study and writing the manuscript. MM, SH, YT, MT, SO, and SA carried out the animal experiments and molecular biology studies. YM, SH, KO, KI, DG, TI, KT, and KA assisted with the acquisition of patients’ data. HF, VSK, and YD performed the microarray analysis and the statistical tests. DG and KF helped with writing manuscript. YT, KS and NK reviewed pathologic diagnosis of bladder tissues. KF was involved in the design of study and wrote the manuscript. All authors read and approved the final manuscript.
ACKNOWLEDGMENTS
The authors are grateful to Dr Aya Asano for her technical assistance and to the patients who consented to the usage of their samples.
CONFLICTS OF INTEREST
The authors declare that they have no competing interests.
FUNDING
JSPS KAKENHI Grant Number 26861290 (M.M.) and 15K10605 (K.F.) and Fiscal Years 2015–2016 Nara Medical University Grant-in-Aid for Collaborative Research Projects (M.M. and K.F.). The National Institutes of Health Grant Numbers 5P30GM114737, P20GM103466, and U54MD007584 (V.S.K. and Y.D.).
REFERENCES
1. Siegel RL, Miller KD, Jemal A. Cancer statistics, 2016. CA Cancer J Clin. 2016; 66:7–30.
2. Miyake M, Gotoh D, Shimada K, Tatsumi Y, Nakai Y, Anai S, Torimoto K, Aoki K, Tanaka N, Konishi N, Fujimoto K. Exploration of risk factors predicting outcomes for primary T1 high-grade bladder cancer and validation of the Spanish Urological Club for Oncological Treatment scoring model: Long-term follow-up experience at a single institute. Int J Urol. 2015; 22:541–547.
3. Grigore AD, Jolly MK, Jia D, Farach-Carson MC, Levine H. Tumor budding: The name is EMT. Partial EMT. J Clin Med. 2016; 5:51.
4. Mitrovic B, Schaeffer DF, Riddell RH, Kirsch R. Tumor budding in colorectal carcinoma: time to take notice. Mod Pathol. 2012; 25:1315–1325.
5. Almangush A, Karhunen M, Hautaniemi S, Salo T, Leivo I. Prognostic value of tumour budding in oesophageal cancer: a meta-analysis. Histopathology. 2016; 68:173–182.
6. Karamitopoulou E, Zlobec I, Born D, Kondi-Pafiti A, Lykoudis P, Mellou A, Gennatas K, Gloor B, Lugli A. Tumour budding is a strong and independent prognostic factor in pancreatic cancer. Eur J Cancer. 2013; 49:1032–1039.
7. Taira T, Ishii G, Nagai K, Yoh K, Takahashi Y, Matsumura Y, Kojima M, Ohmatsu H, Goto K, Niho S, Takashima H, Inoue H, Ohe Y, et al. Characterization of the immunophenotype of the tumor budding and its prognostic implications in squamous cell carcinoma of the lung. Lung Cancer. 2012; 76:423–430.
8. Gujam FJ, McMillan DC, Mohammed ZM, Edwards J, Going JJ. The relationship between tumour budding, the tumour microenvironment and survival in patients with invasive ductal breast cancer. Br J Cancer. 2015; 113:1066–1074.
9. Fukumoto K, Kikuchi E, Mikami S, Ogihara K, Matsumoto K, Miyajima A, Oya M. Tumor budding, a novel prognostic indicator for predicting stage progression in T1 bladder cancers. Cancer Sci. 2016; 107:1338–1344.
10. Jimenez RE, Gheiler E, Oskanian P, Tiguert R, Sakr W, Wood DP Jr, Pontes JE and Grignon DJ. Grading the invasive component of urothelial carcinoma of the bladder and its relationship with progression-free survival. Am J Surg Pathol. 2000; 24:980–987.
11. Krüger S, Noack F, Böhle A, Feller AC. Histologic tumor growth pattern is significantly associated with disease-related survival in muscle-invasive transitional cell carcinoma of the urinary bladder. Oncol Rep. 2004; 12:609–613.
12. Bircan S, Candir O, Kapucuoglu N. The effect of tumor invasion patterns on pathologic stage of bladder urothelial carcinomas. Pathol Oncol Res. 2005; 11:87–91.
13. Denzinger S, Burger M, Fritsche HM, Bertz S, Hofstädter F, Wieland WF, Hartmann A, Otto W. Prognostic value of histopathological tumour growth patterns at the invasion front of T1G3 urothelial carcinoma of the bladder. Scand J Urol Nephrol. 2009; 43:282–287.
14. Miyake M, Hirao S, Mibu H, Tanaka M, Takashima K, Shimada K, Hirao K. Clinical significance of subepithelial growth patterns in non-muscle invasive bladder cancer. BMC Urol. 2011; 11:17.
15. Morizawa Y, Miyake M, Shimada K, Hori S, Tatsumi Y, Nakai Y, Anai S, Tanaka N, Konishi N, Fujimoto K. Neutrophil-to-lymphocyte ratio as a detection marker of tumor recurrence in patients with muscle-invasive bladder cancer after radical cystectomy. Urol Oncol. 2016; 34:257.e11–17.
16. Bronsert P, Enderle-Ammour K, Bader M, Timme S, Kuehs M, Csanadi A, Kayser G, Kohler I, Bausch D, Hoeppner J, Hopt UT, Keck T, Stickeler E et al. Cancer cell invasion and EMT marker expression: a three-dimensional study of the human cancer-host interface. J Pathol. 2014; 234:410–422.
17. De Craene B, Berx G. Regulatory networks defining EMT during cancer initiation and progression. Nat Rev Cancer. 2013; 13:97–110.
18. Shahi P, Slorach EM, Wang CY, Chou J, Lu A, Ruderisch A, Werb Z. The transcriptional repressor ZNF503/Zeppo2 promotes mammary epithelial cell proliferation and enhances cell invasion. J Biol Chem. 2015; 290:3803–3813.
19. Rajkumar T, Sabitha K, Vijayalakshmi N, Shirley S, Bose MV, Gopal G, Selvaluxmy G. Identification and validation of genes involved in cervical tumourigenesis. BMC Cancer. 2011; 11:80.
20. Mardian EB, Bradley RM, Duncan RE. The HRASLS (PLA/AT) subfamily of enzymes. J Biomed Sci. 2015; 22:99.
21. van der Heijden AG, Mengual L, Lozano JJ, Ingelmo-Torres M, Ribal MJ, Fernández PL, Oosterwijk E, Schalken JA, Alcaraz A, Witjes JA. A five-gene expression signature to predict progression in T1G3 bladder cancer. Eur J Cancer. 2016; 64:127–136.
22. Miyake M, Anai S, Fujimoto K, Ohnishi S, Kuwada M, Nakai Y, Inoue T, Tomioka A, Tanaka N, Hirao Y. 5-fluorouracil enhances the antitumor effect of sorafenib and sunitinib in a xenograft model of human renal cell carcinoma. Oncol Lett. 2012; 3:1195–1202.
23. Ghatak S, Niland S, Schulz JN, Wang F, Eble JA, Leitges M, Mauch C, Krieg T, Zigrino P, Eckes B. Role of integrins α1β1 and α2β1 in wound and tumor angiogenesis in mice. Am J Pathol. 2016; 186:3011–3027.
24. Friedl P, Wolf K. Plasticity of cell migration: a multiscale tuning model. J Cell Biol. 2010; 188:11–19.
25. Kumar S, Kapoor A, Desai S, Inamdar MM, Sen S. Proteolytic and non-proteolytic regulation of collective cell invasion: tuning by ECM density and organization. Sci Rep. 2016; 6:19905.
26. Friedl P, Gilmour D. Collective cell migration in morphogenesis, regeneration and cancer. Nat Rev Mol Cell Biol. 2009; 10:445–457.
27. Teddy JM, PM Kulesa. In vivo evidence for short- and long-range cell communication in cranial neural crest cells. Development. 2004; 131:6141–6151.
28. Huang B, Jolly MK, Lu M, Tsarfaty I, Ben-Jacob E, Onuchic JN. Modeling the transitions between collective and solitary migration phenotypes in cancer metastasis. Sci Rep. 2015; 5:17379.
29. Hollingshead MG, Stockwin LH, Alcoser SY, Newton DL, Orsburn BC, Bonomi CA, Borgel SD, Divelbiss R, Dougherty KM, Hager EJ, Holbeck SL, Kaur G, Kimmel DJ, et al. Gene expression profiling of 49 human tumor xenografts from in vitro culture through multiple in vivo passages–strategies for data mining in support of therapeutic studies. BMC Genomics. 2014; 15:393.
30. Gieseg MA, Man MZ, Gorski NA, Madore SJ, Kaldjian EP, Leopold WR. The influence of tumor size and environment on gene expression in commonly used human tumor lines. BMC Cancer. 2004; 4:35.
31. Kalluri R. Basement membranes: structure, assembly and role in tumour angiogenesis. Nat Rev Cancer. 2003; 3:422–433.
32. Zhang H, Teng X, Liu Z, Zhang L, Liu Z. Gene expression profile analyze the molecular mechanism of CXCR7 regulating papillary thyroid carcinoma growth and metastasis. J Exp Clin Cancer Res. 2015; 34:16.
33. Hägg P, Rehn M, Huhtala P, Väisänen T, Tamminen M, Pihlajaniemi T. Type XIII collagen is identified as a plasma membrane protein. J Biol Chem. 1998; 273:15590–15597.
34. Hägg P, Väisänen T, Tuomisto A, Rehn M, Tu H, Huhtala P, Eskelinen S, Pihlajaniemi T. Type XIII collagen: A novel cell adhesion component present in a range of cell-matrix adhesions and in the intercalated discs between cardiac muscle cells. Matrix Biol. 2001; 19:727–742.
35. Tuomisto A, Sund M, Tahkola J, Latvanlehto A, Savolainen ER, Autio-Harmainen H, Liakka A, Sormunen R, Vuoristo J, West A, Lahesmaa R, Morse HC 3rd and Pihlajaniemi T. A mutant collagen XIII alters intestinal expression of immune response genes and predisposes transgenic mice to develop B-cell lymphomas. Cancer Res. 2008; 68:10324–10332.
36. Qiao J, Fang CY, Chen SX, Wang XQ, Cui SJ, Liu XH, Jiang YH, Wang J, Zhang Y, Yang PY, Liu F. Stroma derived COL6A3 is a potential prognosis marker of colorectal carcinoma revealed by quantitative proteomics. Oncotarget. 2015; 6:29929–29946. doi: 10.18632/oncotarget.4966.
37. Sherman-Baust CA, Weeraratna AT, Rangel LB, Pizer ES, Cho KR, Schwartz DR, Shock T, Morin PJ. Remodeling of the extracellular matrix through overexpression of collagen VI contributes to cisplatin resistance in ovarian cancer cells. Cancer cell. 2003; 3:377–386.
38. Kang CY, Wang J, Axell-House D, Soni P, Chu ML, Chipitsyna G, Sarosiek K, Sendecki J, Hyslop T, Al-Zoubi M, Yeo CJ, Arafat HA. Clinical significance of serum COL6A3 in pancreatic ductal adenocarcinoma. J Gastrointest Surg. 2014; 18:7–15.
39. Martianov I, Cler E, Duluc I, Vicaire S, Philipps M, Freund JN, Davidson I. TAF4 inactivation reveals the 3-dimensional growth promoting activities of collagen 6A3. PloS One. 2014; 9:e87365.
40. Ueno H, Mochizuki H, Hashiguchi Y, Shimazaki H, Aida S, Hase K, Matsukuma S, Kanai T, Kurihara H, Ozawa K, Yoshimura K, Bekku S. Risk factors for an adverse outcome in early invasive colorectal carcinoma. Gastroenterology. 2004; 127:385–394.
41. Miyake M, Hori S, Morizawa Y, Tatsumi Y, Nakai Y, Anai S, Torimoto K, Aoki K, Tanaka N, Shimada K, Konishi N, Toritsuka M, Kishimoto T, et al. CXCL1-mediated interaction of cancer cells with tumor-associated macrophages and cancer-associated fibroblasts promotes tumor progression in human bladder cancer. Neoplasia. 2016; 18:636–646.
42. Inamoto T, Taniguchi K, Takahara K, Iwatsuki A, Takai T, Komura K, Yoshikawa Y, Uchimoto T, Saito K, Tanda N, Kouno J, Minami K, Uehara H, et al. Intravesical administration of exogenous microRNA-145 as a therapy for mouse orthotopic human bladder cancer xenograft. Oncotarget. 2015; 6:21628–21635. doi: 10.18632/oncotarget.4129.
43. Miyake M, Goodison S, Lawton A, Gomes-Giacoia E, Rosser CJ. Angiogenin promotes tumoral growth and angiogenesis by regulating matrix metallopeptidase-2 expression via the ERK1/2 pathway. Oncogene. 2015; 34:890–901.
44. Scott RW, Crighton D, Olson MF. Modeling and imaging 3-dimensional collective cell invasion. J Vis Exp. 2011; e3525.