
INTRODUCTION
Eastern Asia has the highest incidence of liver cancer in the world [1]. Hepatitis B virus (HBV) infection has a high prevalence (> 5%) in the Chinese population [2, 3], and in 2012, more than half of new cases of liver cancer and death from the disease occurred in China [1]. Liver cancer is the third leading cause of cancer-related death in China [4], with an age-standardized 5-year relative survival rate of 10.1% [5]. Most of these are cases of hepatocellular carcinoma(HCC) [6]. In Guangxi province, which has a higher prevalence of HBV infection, aflatoxin B1 (AFB1) exposure levels and tumor protein p53 (TP53) codon 249 mutation rates are higher than in other provinces, and are accompanied by higher mortality and morbidity from HCC [7–11]. Alcohol abuse, AFB1 exposure, HBV and hepatitis C virus infection are the major environmental factors associated with HCC [12, 13], while TP53 mutation has been linked to HCC development and prognosis [14–17]. Thus, the population in Guangxi is suitable for exploring the relationship between AFB1 exposure, HBV infection, TP53 codon 249 mutation, and HCC.
Alpha-fetoprotein (AFP) is a HCC biomarker that has been used to screen high-risk populations as well as for diagnosis, prognosis, and predicting recurrence. However, recent studies have shown that serum AFP levels lack diagnostic and/or prognostic specificity and sensitivity for HCC [18, 19]. As such, HCC guidelines of European Association for the Study of the Liver [20] and the American Association for the Study of Liver Diseases [21] no longer recommend serum AFP measurement; however, a recent clinical study in China suggested that it is still a valuable biomarker for HBV-related HCC [22]. It was also shown that HBVx protein can induce AFP expression in liver cells [23–25]. These findings suggest that AFP is closely associated with HBV and still valuable in HBV-related HCC. Given the high prevalence of HBV infection in China, serum AFP remains the most highly recommended biomarker for HCC diagnosis and prognosis according to Chinese HCC guidelines [26].
Phospholipase C epsilon (PLCE) 1 single nucleotide polymorphisms (SNPs) rs2274223 and rs3765524 have been identified in many cancer risk studies [27] and genome-wide association studies (GWAS) [28]. Rs2274223 A>G has been linked to altered PLCE1 expression in esophageal squamous cell carcinoma(ESCC) [29–31], and the G allele may contribute to increased cancer incidence [30]. Our previous GWAS of Chinese HBV-related HCC patients in Guangxi revealed that PLCE1 gene polymorphism was associated with HBV-related HCC [32]. In our current study, we investigated the utility of PLCE1 gene polymorphisms and expression in combination with serum AFP levels for predicting the prognosis of HBV-related HCC.
RESULTS
Patient characteristics and clinical outcomes
Patients were followed up after surgery until death or the final follow-up, which was in September 2014. A total of 421 HBV-related HCC patients completed the follow-up period successfully, with a lost to follow-up rate of 6.4%. The duration of follow up ranged from 12 to 117 months and the median survival time was 51 months. At the time of analysis, 188 (44.7%) of the patients had died. Clinical characteristics of patients and their association with overall survival (OS)are summarized in Table 1. The Kaplan-Meier analysis revealed that tumor size and number, Barcelona Clinic Liver Cancer (BCLC) stage, and portal vein tumor thrombus (PVTT) were significantly associated with OS (log-rank test, P < 0.001)and increased risk of death. In 364 patients (86.4%), a Child–Pugh score of A was related to OS (log-rank test, P=0.006). In 240 patients (57%), radical resection was related to OS (log-rank test, P=0.033). In 150 patients (35.6%), antiviral therapy after hepatectomy was associated with OS (log-rank test, P=0.004) as compared to those who did not receive the therapy. Other clinical characteristics were not associated with OS.
Table 1: Clinical characteristics of HBV-related HCC patients
Variables |
Patients |
No. of events (%) |
MST |
HR (95% CI) |
Log-rank P |
|---|---|---|---|---|---|
Age (years) |
0.186 |
||||
≤60 |
367 |
162 (44.1) |
58 |
1 |
|
>60 |
54 |
25 (46.3) |
39 |
1.326 (0.869-2.025) |
|
Gender |
0.274 |
||||
Male |
371 |
169 (45.6) |
51 |
1 |
|
Female |
50 |
18 (36.0) |
51 |
0.764 (0.470-1.243) |
|
Ethnicity |
0.978 |
||||
Han |
259 |
117 (45.2) |
51 |
1 |
|
Minority |
162 |
70 (43.2) |
51 |
1.004 (0.746-1.353) |
|
BMI |
0.683 |
||||
≤25 |
332 |
145 (43.7) |
51 |
1 |
|
>25 |
89 |
42 (47.2) |
51 |
0.931 (0.659-1.315) |
|
Smoking status |
0.124 |
||||
None |
272 |
115 (42.3) |
61 |
1 |
|
Ever |
149 |
72 (48.3) |
40 |
1.259 (0.937-1.692) |
|
Drinking status |
0.608 |
||||
None |
255 |
109 (42.7) |
51 |
1 |
|
Ever |
166 |
78 (47.0) |
45 |
1.079 (0.806-1.443) |
|
Child–Pugh score |
0.006 |
||||
A |
364 |
157 (43.1) |
58 |
1 |
|
B |
57 |
30 (52.6) |
34 |
1.718 (1.161-2.542) |
|
Cirrhosis |
0.225 |
||||
No |
47 |
18 (38.3) |
88 |
1 |
|
Yes |
374 |
169 (45.2) |
51 |
1.348 (0.829-2.193) |
|
Radical resection& |
0.033 |
||||
Yes |
240 |
96 (40.0) |
73 |
1 |
|
None |
171 |
86 (50.3) |
40 |
1.368 (1.023-1.831) |
|
Portal hypertension† |
0.595 |
||||
No |
217 |
103 (47.5) |
57 |
1 |
|
Yes |
181 |
77 (42.5) |
45 |
1.084 (0.804-1.462) |
|
Pathological diagnosis‡ |
0.974 |
||||
Well differentiated |
23 |
10 (43.5) |
47 |
1 |
|
Moderately differentiated |
323 |
143 (44.3) |
51 |
1.074 (0.565-2.040) |
|
Poorly differentiated |
12 |
5 (41.7) |
40 |
1.034 (0.353-3.027) |
|
Adjuvant antiviral treatment |
0.004 |
||||
No |
271 |
146 (53.9) |
41 |
1 |
|
Yes |
150 |
41 (27.3) |
NA |
0.605 (0.426-0.858) |
|
Tumor behavior |
|||||
Tumor size (cm) |
<0.001 |
||||
<10 |
316 |
126 (39.9) |
71 |
1 |
|
≥10 |
105 |
61 (58.1) |
34 |
1.925 (1.414-2.621) |
|
Tumor number |
<0.001 |
||||
Single |
309 |
120 (38.8) |
61 |
1 |
|
Multiple |
112 |
67 (59.8) |
28 |
1.891 (1.401-2.551) |
|
Regional invasion |
0.068 |
||||
Absence |
358 |
158 (44.1) |
58 |
1 |
|
Presence |
63 |
29 (46.0) |
40 |
1.445 (0.968-2.156) |
|
BCLC stage |
<0.001 |
||||
A |
250 |
81 (32.4) |
95 |
1 |
|
B |
69 |
40 (58.0) |
39 |
2.115 (1.447-3.091) |
|
C |
102 |
66 (64.7) |
25 |
3.216 (2.312-4.473) |
|
PVTT |
<0.001 |
||||
No |
352 |
138 (39.2) |
71 |
1 |
|
Yes |
69 |
49 (71.0) |
19 |
2.970 (2.135-4.131) |
|
Notes: & Information of radical resection was unavailable in 10 patients; † Information of portal hypertension was unavailable in 23 patients; ‡ Information of pathological diagnosis was unavailable in 63 patients; BMI, body mass index; BCLC, Barcelona Clinic Liver Cancer; PVTT, portal vein tumor thrombus; MST, median survival time; HR, hazard ratio; CI, confidence interval.
Bioinformatics analysis
The success rate for genotyping both SNPs was 100% (Supplementary Figure 1 and 2). The genotype frequencies of rs2274223 and rs3765524 were consistent with Hardy-Weinberg equilibrium(χ2=3.091, P=0.079). A haplotype analysis of the two selected SNPs in HBV-related HCC patients and the normal Chinese Han in Beijing (CHB) population revealed a haplotype block (block pairwise r2=1.0 for normal CHB population; block pairwise r2=1.0, Ars2274223Crs3765524=75.7% and Grs2274223Trs3765524=24.3% for HBV-related HCC patients) (Figure 1A, 1B). Both SNPs were non-synonymous (rs2274223: H1927R; rs3765524: T1777I) and located in exons; rs2274223 was a Tag SNP of PLCE1. In addition, both SNPs were predicted to be ‘Benign’ and ‘Tolerated’ by PolyPzhen-2 (http://genetics.bwh.harvard.edu/pph2/index.shtml) and SIFT (http://sift.jcvi.org/) computational tools.
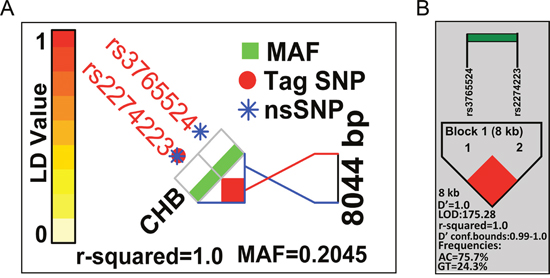
Figure 1: Patterns of LD plots for two selected SNPs in the PLCE1 gene. (A) Pattern of LD plot and pairwise LD (r2) value calculated based on HapMap data of CHB samples. (B) Pattern of LD plot and pairwise LD (r2) value calculated based on data from the current study of HBV-related HCC cases.
Analysis of genetic polymorphisms and haplotypes for different serum AFP levels
The genotype distributions of rs2274223 and rs3765524 for different serum AFP levels are shown in Table 2. In the codominant genetic model, after adjusting for the Child–Pugh score, radical resection, antiviral therapy after hepatectomy, tumor size, tumor number, BCLC stage, PVTT, and regional invasion, single-locus analyses revealed that genotype GG of PLCE1 rs2274223 was associated with an increased risk for AFP cut-off levels of 200 and 400 ng/ml in HBV-related HCC (GG vs. AA; adjusted P=0.013, adjusted odds ratio [OR]=3.014, 95% confidence interval [CI]=1.258–7.224 for an AFP cut-off level of 200 ng/ml; and adjusted P=0.020, adjusted OR=2.686, 95% CI=1.169–6.173 for an AFP cut-off level of 400 ng/ml) as compared to genotype AA. In the dominant genetic model of rs2274223, G (AG/GG) allele carriers also showed increased risk in HBV-related HCC with AFP cut-off levels of 200 and 400 ng/ml (AG/GG vs. AA; adjusted P=0.024, adjusted OR= 1.607, 95% CI= 1.065–2.424 for an AFP cut-off level of 200 ng/ml; and adjusted P= 0.028, adjusted OR= 1.588, 95% CI= 1.052–2.399 for an AFP cut-off level of 400 ng/ml) as compared to AA carriers. The results for rs3765524 were the same as for rs2274223; that is, the T (CT/TT) allele was associated with an increased risk for AFP cut-off levels of 200 and 400 ng/ml as compared to CC. In the haplotype analysis, the GT haplotype was associated with an increased risk for AFP cut-off levels of 200 and 400 ng/ml in HBV-related HCC (GT vs. AC; adjusted P=0.004, adjusted OR= 1.629, 95% CI= 1.164–2.281 for an AFP cut-off level of 200 ng/ml; and adjusted P= 0.006, adjusted OR= 1.592, 95% CI= 1.140–2.224 for an AFP cut-off level of 400 ng/ml). Both rs2274223 and rs3765524 genotype distributions and haplotype analysis results were non-significant for an AFP cut-off level of 20 ng/ml.
Table 2: Genotype and haplotype distributions of PLCE1 at different serum AFP levels in HBV-related HCC patients
Association between haplotypes and clinical features
The association between PLCE1 haplotypes and clinicopathological characteristics are shown in Table 3. With the exception of Child–Pugh score, none of the associations between risk factors and PLCE1 haplotypes reached statistical significance. A Child–Pugh score of B was significantly associated with haplotypes AC and GT, suggesting that the haplotype distribution of PLCE1 differed according to liver functional reserve status in HBV-related HCC patients.
Table 3: Association between risk factors and PLCE1 haplotypes in HBV-related HCC patients
Variables |
AC |
GT |
OR (95%CI) |
P |
|---|---|---|---|---|
Tumor size(cm) |
||||
≤10 |
494 |
138 |
1 |
|
≥10 |
153 |
57 |
1.334 (0.932-1.908) |
0.115 |
Tumor number |
||||
Single |
471 |
147 |
1 |
|
Multiple |
176 |
48 |
0.874 (0.604-1.264) |
0.474 |
Child–Pugh score |
||||
A |
548 |
180 |
1 |
|
B |
99 |
15 |
0.461 (0.261-0.814) |
0.008 |
BCLC stage |
||||
A |
380 |
120 |
1 |
|
B |
112 |
26 |
0.735 (0.458-1.180) |
0.203 |
C |
155 |
49 |
1.001 (0.684-1.466) |
0.996 |
Radical resection& |
||||
Yes |
365 |
115 |
1 |
|
None |
264 |
78 |
0.938 (0.675-1.302) |
0.701 |
Regional invasion |
||||
Absence |
557 |
159 |
1 |
|
Presence |
90 |
36 |
1.401 (0.916-2.143) |
0.12 |
PVTT |
||||
No |
542 |
162 |
1 |
|
Yes |
105 |
33 |
1.051(0.685-1.614) |
0.818 |
Pathological diagnosis‡ |
||||
Well differentiated |
31 |
15 |
1 |
|
Moderately differentiated |
502 |
144 |
0.593 (0.311-1.128) |
0.111 |
Poorly differentiated |
19 |
5 |
0.544 (0.170-1.739) |
0.304 |
Notes: & Information of radical resection was unavailable in 10 patients; ‡ Information of pathological diagnosis was unavailable in 63 patients; OR, odds ratio; CI, confidence interval; BCLC, Barcelona Clinic Liver Cancer stage; PVTT, portal vein tumor thrombus.
Relationship between haplotype and clinical outcome
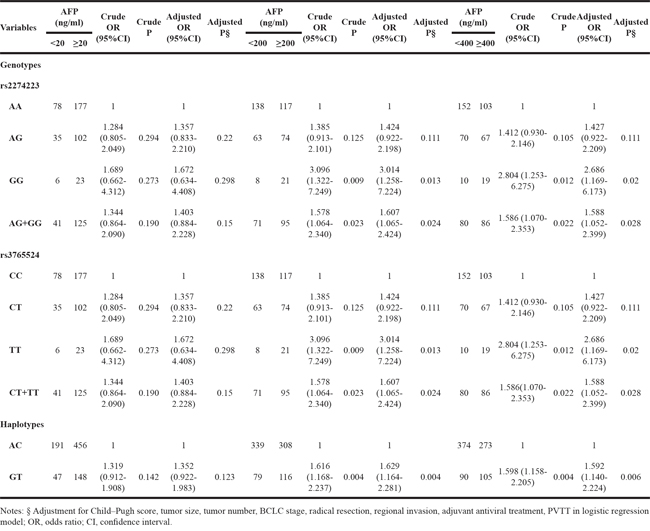
Results of the stratified analysis between PLCE1 haplotypes and OS in HBV-related HCC patients are shown in Figure 2. All variables were stratified according to favorable and adverse clinicopathological characteristics. We found that PLCE1 haplotypes were not associated with OS according to this stratification.
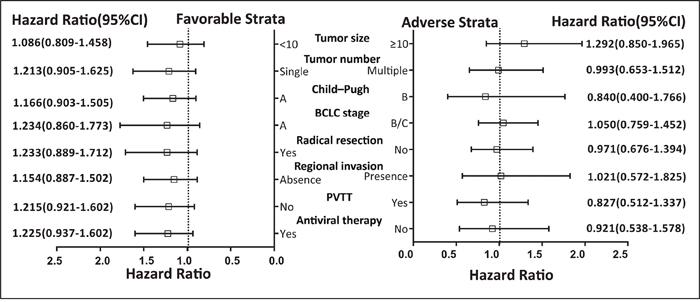
Figure 2: Stratified analysis of association between PLCE1 haplotype and OS in HBV-related HCC patients. Variables were stratified according to favorable and adverse strata.
The univariate analysis of PLCE1 haplotypes revealed that patients with the GT haplotype had a shorter median survival time (MST) relative to those with the AC haplotype (42 vs. 57 months; log-rank P=0.445) (Table 4 and Figure 3A). After adjusting for risk factors in the Cox proportional hazards regression analysis, the MST was comparable between patients with different haplotypes and serum AFP levels. These results indicate that the prognosis of HBV-related HCC patients did not differ significantly between groups. In addition, based on AFP cut-off levels of 20, 200, and 400 ng/ml, lower AFP level was associated with longer MST as compared to higher AFP level (71 vs. 41 months for an AFP cut-off level of 20 ng/ml; 58 vs. 43 months for an AFP cut-off level of 200 ng/ml; and 58 vs. 43 months for an AFP cut-off level of 400 ng/ml) (Table 4), although the difference was not statistically significant.
Table 4: Survival analysis of HBV-related HCC patients according to PLCE1 haplotype and serum AFP level
Variables |
Patients (n=421) |
No. of events (%) |
MST (months) |
Crude HR |
Crude P |
Adjusted HR |
Adjusted P§ |
|---|---|---|---|---|---|---|---|
Haplotypes ψ |
|||||||
AC |
647 |
283 (46.9) |
57 |
1 |
1 |
||
GT |
195 |
91 (49.5) |
42 |
1.096 (0.865-1.388) |
0.449 |
1.143 (0.900-1.452) |
0.272 |
AFP (ng/mL) |
|||||||
Cut-off in 20 |
|||||||
<20 |
119 |
40 (33.6) |
71 |
1 |
1 |
||
≥20 |
302 |
147 (48.7) |
41 |
1.683 (1.186-2.388) |
0.004 |
1.276 (0.887-1.836) |
0.19 |
Cut-off in 200 |
|||||||
<200 |
209 |
86 (41.1) |
58 |
1 |
1 |
||
≥200 |
212 |
101 (47.6) |
43 |
1.238 (0.928-1.652) |
0.146 |
0.938 (0.692-1.272) |
0.682 |
Cut-off in 400 |
|||||||
<400 |
232 |
96 (41.4) |
58 |
1 |
1 |
||
≥400 |
189 |
91 (48.1) |
43 |
1.262 (0.947-1.683) |
0.112 |
0.985 (0.727-1.335) |
0.923 |
Notes: ψ The number of heplotypes was 2n (2n=842); § Adjustment for Child–Pugh score, tumor size, tumor number, BCLC stage, radical resection, regional invasion, adjuvant antiviral treatment, PVTT in Cox proportional hazards regression model; MST, median survival time; HR, hazard ratio; CI, confidence interval.
Figure 3: Survival curves of patients with different PLCE1 haplotypes and joint-effects analysis of different AFP levels. (A) OS stratified by AC and GT haplotypes. (B–D) OS stratified by joint-effects analysis of PLCE1 haplotypes and an AFP cut-off level of 20 ng/ml (B), 200 ng/ml (C), and 400 ng/ml (D).
Joint-effects analysis
We further analyzed the association between serum AFP level, PLCE1 haplotypes, and HBV-related HCC patient survival outcomes. Based on AFP cut-off levels of 200 and 400 ng/ml, lower AFP level with the AC haplotype was associated with a longer MST (Table 5 and Figure 3C and 3D) as compared to other patients. After adjusting for Child–Pugh score, radical resection, antiviral therapy after hepatectomy, tumor size and number, BCLC stage, PVTT, and regional invasion in the Cox proportional hazards regression model, the MST was similar among patients with different AFP levels and haplotypes. For the AFP cut-off level of 20 ng/ml, the MST of PLCE1 haplotypes combined with AFP level differed significantly. The AC haplotype with AFP < 20 ng/ml had a longer MST (75 vs. 41,71, and 40; log-rank test, P=0.0003) (Figure 3B); after adjusting for the above variables, the GT haplotype with AFP < 20 ng/ml was associated with increased risk of death as compared to the AC haplotype (adjusted P=0.092, adjusted hazard ratio [HR]=1.539, 95% CI =0.932–2.541) (Table 5). AC and GT haplotypes with AFP ≥ 20 ng/ml had significantly higher risk of death as compared to the AC haplotype with AFP < 20 ng/ml (adjusted HR = 1.392, 95%CI= 1.034–1.873, and adjusted P = 0.029 for AC haplotype with AFP ≥ 20 ng/ml; and adjusted HR = 1.445, 95%CI= 1.015–2.057, and adjusted P = 0.041 for GT haplotype with AFP ≥ 20 ng/ml) (Table 5).
Table 5: Joint-effects survival analysis of PLCE1 haplotypes and serum AFP levels in HBV-related HCC patients
Group |
Haplotypes |
AFP (ng/mL) |
Patients (2n=842) |
No. of events (%) |
MST (months) |
Crude HR |
Crude |
Adjusted HR |
Adjusted P§ |
|---|---|---|---|---|---|---|---|---|---|
I |
AC |
AFP <20 |
191 |
59 (30.9) |
75 |
1 |
1 |
||
II |
AC |
AFP ≥20 |
456 |
224 (49.1) |
41 |
1.826 (1.370-2.433) |
0.00004 |
1.392 (1.034-1.873) |
0.029 |
III |
GT |
AFP <20 |
47 |
21 (44.7) |
71 |
1.417 (0.861-2.332) |
0.170 |
1.539 (0.932-2.541) |
0.092 |
IV |
GT |
AFP ≥20 |
148 |
70 (47.3) |
40 |
1.817 (1.285-2.571) |
0.001 |
1.445 (1.015-2.057) |
0.041 |
A |
AC |
AFP <200 |
339 |
136 (40.1) |
61 |
1 |
1 |
||
B |
AC |
AFP ≥200 |
308 |
147 (47.7) |
51 |
1.256 (0.994-1.586) |
0.056 |
0.961 (0.751-1.229) |
0.749 |
C |
GT |
AFP <200 |
79 |
36 (45.6) |
51 |
1.124 (0.779-1.624) |
0.532 |
1.282 (0.885-1.858) |
0.189 |
D |
GT |
AFP ≥200 |
116 |
55 (47.4) |
40 |
1.301 (0.951-1.780) |
0.100 |
1.034 (0.750-1.424) |
0.839 |
1 |
AC |
AFP <400 |
374 |
150 (40.1) |
61 |
1 |
1 |
||
2 |
AC |
AFP ≥400 |
273 |
133 (48.7) |
50 |
1.286 (1.017-1.624) |
0.035 |
1.007 (0.786-1.290) |
0.956 |
3 |
GT |
AFP <400 |
90 |
42 (46.7) |
51 |
1.128 (0.801-1.588) |
0.492 |
1.240 (0.876-1.754) |
0.225 |
4 |
GT |
AFP ≥400 |
105 |
49 (46.7) |
36 |
1.318 (0.954-1.821) |
0.094 |
1.077 (0.775-1.499) |
0.658 |
Notes: § Adjustment for Child–Pugh score, tumor size, tumor number, BCLC stage, radical resection, regional invasion, adjuvant antiviral treatment, PVTT in Cox proportional hazards regression model; MST, median survival time; HR, hazard ratio; CI, confidence interval.
Gene expression omnibus (GEO)data analysis
A total of 218 HCC patients from GSE14520 [33] with a history of HBV infection or HBV-related liver cirrhosis were recruited for further analysis. The mRNA expression of PLCE1and AFP (Affymetrix Probe Set IDs: 205112_at and 204694_at, respectively) differed between HCC and adjacent normal tissues in these patients (P < 0.001; Figure 4A), and the latter also differed in tumor tissues of the various serum AFP subgroups (P < 0.001; Figure 4B). We also found a weak positive correlation between PLCE1 and AFP mRNA expression in HBV-related HCC tumor tissues (r=0.107, P=0.019, Figure 4C). A gene interaction analysis by GeneMANIA predicted that PLCE1 and AFP were involved in the TP53 pathway (Figure 4D).
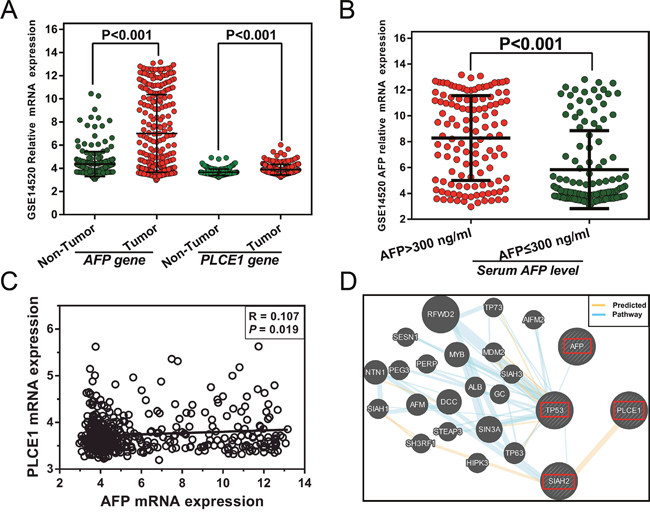
Figure 4: (A) AFP and PLCE1 mRNA expression in HBV-related HCC and adjacent normal tissue. (B) AFP mRNA expression level in HBV-related HCC tumor tissue from different serum AFP level subgroups. (C) Correlation between PLCE1and AFP gene expression levels. (D) Gene interaction networks between PLCE1 and AFP genes.
The samples were divided into two groups according to PLCE1 mRNA expression in tumors. The high PLCE1 group consisted of samples in which PLCE1 mRNA expression levels were above the median value, with the remaining samples comprising the low PLCE1 group. Since information on AFP levels were missing for four patients, 214 patients with serum AFP cut-off levels of 300 ng/ml were used for further joint-effects analysis. The results of the survival analysis for PLCE1 and joint-effect analysis with AFP levels are shown in Tables 6 and 7, respectively. Patients with high PLCE1 mRNA expression showed poor prognosis (adjusted HR = 1.668, 95%CI= 1.151–2.476, adjusted P = 0.007 for disease-free survival [DFS]; adjusted HR = 2.317, 95%CI= 1.448–3.706, adjusted P = 0.0005 for OS) (Figure 5A and 5B) as compared to those with low PLCE1 mRNA expression. Patients with an AFP level > 300 ng/ml had a shorter MST than those with AFP level ≤ 300 ng/ml (35 vs. 48 months, adjusted P=0.995), although the difference was not statistically significant. In the stratified analysis, high PLCE1 expression increased the risk of recurrence and death among patients who were male and had early-stage BCLC, who had a single tumor, cirrhosis, AFP level > 300 ng/ml (Figure 6A and 6B). Old patients with high PLCE1 expression also had a higher risk of recurrence Figure 6A). Meanwhile, high PLCE1 expression among young patients with low AFP level and tumor size > 5 cm had an increased risk of death (Figure 6B).
Table 6: Survival analysis of PLCE1 mRNA expression and serum AFP levels in HBV-related HCC patients from GSE14520
Variables |
Patients (n=218) |
DFS |
OS |
||||||
|---|---|---|---|---|---|---|---|---|---|
No. of events (%) |
MST |
Adjusted HR |
Adjusted P§ |
No. of events (%) |
MST |
Adjusted HR |
Adjusted P§ |
||
PLCE1 level |
|||||||||
Low |
109 |
52 (47.7) |
57 |
1 |
31 (28.4) |
NA |
1 |
||
High |
109 |
69 (63.3) |
29 |
1.688 (1.151-2.476) |
0.007 |
53 (48.6) |
53 |
2.317 (1.448-3.706) |
0.0005 |
AFP (ng/ml)φ |
|||||||||
≤300 |
118 |
65 (55.1) |
48 |
1 |
40 (33.9) |
56 |
1 |
||
>300 |
96 |
55 (57.3) |
35 |
1.001 (0.693-1.446) |
0.995 |
43 (44.8) |
49 |
1.234 (0.794-1.918) |
0.351 |
Notes: φ Information of AFP was unavailable in 4 patients; § Adjustment for age, gender, cirrhosis, BCLC stage, serum AFP levels; DFS, disease-free survival; OS, overall survival; MST, median survival time; HR, hazard ratio; CI, confidence interval.
Table 7: Joint-effects survival analysis of PLCE1 and serum AFP levels in HBV-related HCC patients from GSE14520
Group |
PLCE1 level |
AFP (ng/ml) |
Patients (n=214) φ |
No. of events (%) |
MST (months) |
Adjusted HR |
Adjusted |
|---|---|---|---|---|---|---|---|
DFS |
|||||||
i |
High |
>300 |
47 |
33 (70.2) |
21 |
1 |
|
ii |
High |
≤300 |
60 |
36 (60.0) |
41 |
0.777(0.476-1.266) |
0.31 |
iii |
Low |
>300 |
49 |
22 (44.9) |
59 |
0.459(0.263-0.803) |
0.006 |
iiii |
Low |
≤300 |
58 |
29 (50.0) |
51 |
0.570(0.335-0.968) |
0.038 |
OS |
|||||||
a |
High |
>300 |
47 |
28 (59.6) |
26 |
1 |
|
b |
High |
≤300 |
60 |
25 (41.7) |
NA |
0.709(0.404-1.246) |
0.232 |
c |
Low |
>300 |
49 |
15 (30.6) |
NA |
0.384(0.201-0.734) |
0.004 |
d |
Low |
≤300 |
58 |
15 (25.9) |
NA |
0.347(0.180-0.670) |
0.002 |
Notes: φ Information of AFP was unavailable in 4 patients; § Adjustment for age, gender, cirrhosis, BCLC stage, serum AFP levels; DFS, disease-free survival; OS, overall survival; MST, median survival time; HR, hazard ratio; CI, confidence interval.
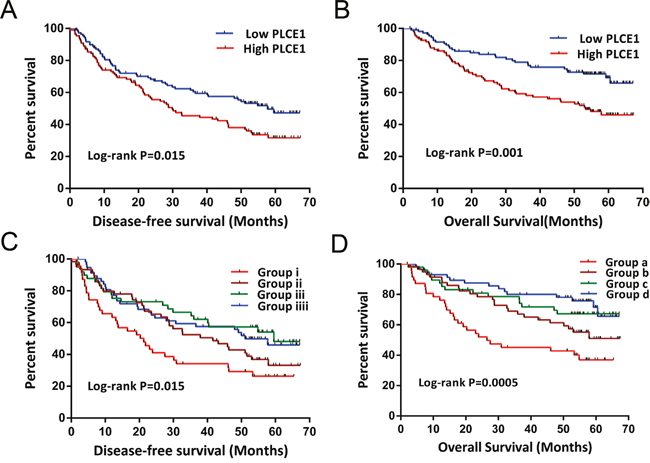
Figure 5: Kaplan-Meier survival curves of GSE14520 HBV-related HCC patient prognosis with different PLCE1 mRNA expression levels, and joint-effects analysis with different serum AFP levels. (A, B) DFS (A) and OS (B) stratified by PLCE1 expression level. (C, D) DFS (C) and OS (D) stratified by joint-effects analysis of PLCE1 expression and serum AFP levels.
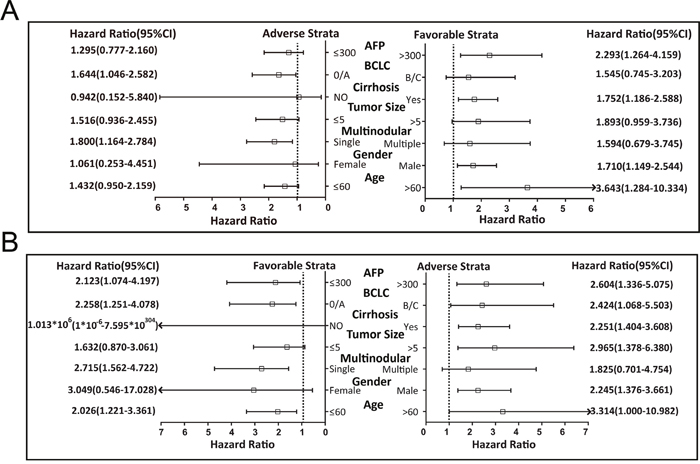
Figure 6: Stratified analysis of the associations between PLCE1 mRNA expression level and GSE14520 prognosis of HBV-related HCC patients. Variables were stratified by favorable and adverse strata. (A, B) Stratified analysis between PLCE1 and DFS (A) and between PLCE1 and OS (B).
The joint-effects analysis of PLCE1 mRNA expression and serum AFP levels showed that low PLCE1 expression combined with any serum AFP level was associated with decreased risk of HBV-related HCC recurrence (adjusted HR = 0.459, 95%CI= 0.263–0.803, P = 0.006 for patients with low PLCE1 expression and AFP level > 300 ng/ml; adjusted HR = 0.570, 95%CI= 0.335–0.968, P = 0.038 for patients with low PLCE1 expression and AFP level ≤ 300 ng/ml) (Figure 5C) and death (adjusted HR = 0.384, 95%CI= 0.201–0.734, adjusted P = 0.004 for patients with low PLCE1 expression and AFP level > 300 mg/ml; adjusted HR = 0.347, 95%CI= 0.180–0.670, adjusted P = 0.002 for patients with low PLCE1 expression and AFP level ≤ 300 ng/ml) (Figure 5D) as compared to high PLCE1 expression and AFP level > 300 ng/ml.
DISCUSSION
PLCE1 is a member of phosphoinositide-specific PLC family that serves as a link between the second messengers and small GTPases and regulates some Ras family members [34, 35]. The PLCE1 gene encodes a phospholipase that regulates various processes affecting cell growth, differentiation, and gene expression [36, 37] and was shown to promote intestinal tumorigenesis by inducing inflammation and angiogenesis in a transgenic mouse model [38].
The role of PLCE1 in human cancer remains controversial. It has been suggested to play a tumor suppressor role in and decrease the incidence of colorectal carcinoma (CRC) [39–41]. However, PLCE1 is thought to act as an oncogene in bladder cancer [42, 43], non-small cell lung cancer [44], skin cancer [45], and head and neck cancer [46]. Upregulation of PLCE1 mRNA level is associated with longer survival in gastric cardia adenocarcinoma (GCA) and ESCC, while the transcript is downregulated in GCA and ESCC tumor tissue [47], which was confirmed by another study of ESCC patients [30]. However, higherPLCE1expression was observed in Chinese Kazakh ESCC patients and ESCC tumor cell lines [48]. In an independent cohort, low PLCE1 expression were linked to poor prognosis in ESCC [47], contradicting a previous report [49]. Our analysis of HBV-related HCC cases from GSE14520 also showed that high PLCE1 level predicts poor survival and increased risk of recurrence. Gene knockdown studies in ESCC cell lines suggested that PLCE1 has an oncogenic function in ESCC [49, 50]. In addition, PLCE1 expression was positively correlated with that of nuclear factor κB-related proteins in Kazakh ESCC patients [51], and negatively correlated with TP53 in HCC and ESCC cells and lung cancer [32, 52, 53]. Distinct microRNAs were shown to suppress PLCE1 expression and thereby affect cancer development and patient prognosis [44, 49, 54].
Rs2274223 A>G located in exon 26 of the PLCE1 gene causes a missense mutation (His>Arg) that alters gene expression [29–31]. Multiple case-control studies of Chinese patients revealed that thers2274223is a common susceptibility locus in several cancers, including gastric cancer(GC) [28, 55–58], CRC [59–62], ESCC [28, 30, 31, 37, 58, 63–69], and squamous cell carcinoma of the head and neck [46]. Other studies have reported similar findings for GC and ESCC in other ethnic groups [70–74], and even for gallbladder cancer in an Indian population [75, 76]. However, rs2274223 has not been linked to cancer risk in European CRC patients [77] or northern Indian ESCC patients [78]. Nonetheless, the results of recent meta-analyses indicate that the rs2274223 A >G polymorphism is associated with increased susceptibility to cancer [27, 79]. A survival analysis based on 940 Chinese GC patients revealed that the G allele of rs2274223 was associated with a lower risk of death [80], but this was not true of other cancers. Our results indicate that the G allele of rs2274223 is a cancer risk factor. Rs3765524 C>T also results in a missense mutation in an exon of PLCE1, and strong LD with rs2274223 has been reported in several studies [28, 31, 59, 78]. We also detected a strong LD(r2=1) between rs2274223 and rs3765524 in the CHB population and Chinese HBV-related HCC patients. A genome-wide association pathway analysis found that rs3765524 contributed to GC susceptibility [81, 82], while a case-control study of the Chinese population showed that rs3765524 was associated with disease risk in GC and ESCC [58, 67, 83]. Investigations of South Asian patients showed similar results for GC [72] but not for ESCC [78, 84]. Additionally, a recent meta-analysis showed that like rs2274223, rs3765524 was significantly associated with disease risk [79]. Given the many factors that can affect tumor incidence and the variable findings in different populations, additional studies are required to evaluate the significance of these polymorphisms in cancer [85].
The PLCE1 haplotypes examined in the present study were not associated with OS in HBV-related HCC patients. Due to the limited sample size, survival analysis at three AFP cut-off levels showed no differences after adjustment in a COX proportional hazards regression model, contrary to the findings of a recent study [22]. Our results suggest that both the genotypes and haplotypes of rs2274223 and rs3765524 were significantly associated with HBV-related HCC incidence at AFP cut-off levels of 200 and 400 ng/ml. The GT haplotype had an increased risk of high AFP level in HBV-related HCC as compared to the AC haplotype. We also observed similar clinical outcomes in HCC patients grouped by haplotype and AFP cut-off levels of 200 and 400 ng/ml. In addition, according to an AFP cut-off level of 20 ng/ml, the distribution of PLCE1 genotypes and haplotypes did not reach statistical significance in HBV-related HCC. However, a significant interaction between PLCE1 haplotypes and a serum AFP cut-off level of 20 ng/ml was observed in a joint analysis. Grouping by PLCE1 haplotype and an AFP cut-off level of 20 ng/ml, the outcomes of patients with AC or GT and AFP level ≥ 20 ng/ml differed from those with AC haplotypes and AFP level< 20 ng/ml. These findings demonstrate that PLCE1 gene polymorphisms combined with serum AFP level can serve as a prognostic marker for HBV-related HCC patients treated by hepatic resection. Once validated, PLCE1 haplotypes of rs2274223 and rs3765524 may be used in combination with other clinical prognostic factors for decision-making in HCC management.
GEO data analysis of HBV-related HCC suggested that PLCE1mRNA expression was upregulated in tumor tissue, which predicted poor prognosis. These results imply that PLCE1 acts as an oncogene in HBV-related HCC, and may be a potential therapeutic target. The stratified analysis also revealed that high PLCE1 expression increased the risk of recurrence and death in patients who were male and had early-stage BCLC, a single tumor, cirrhosis, and AFP level > 300 ng/ml. In addition, older patients had an increased risk of recurrence, whereas younger patients with low AFP level and tumor size > 5 cm had a higher risk of death. These findings suggest that higher PLCE1 expression was associated with tumor progression and degree of malignancy, which in turn affects clinical outcome. A recent report indicated that serum AFP is a valuable prognostic biomarker in HBV-related HCC and that lower preoperative serum AFP levels were associated with a much higher OS rate [22]. Our previous study of HBV-related HCC also demonstrated that serum AFP level was associated with 2-year OS and RFS, but was not useful for predicting long-term survival and recurrence in HBV-related HCC [86], which requires a combination of serum AFP and other markers. Indeed, in the present study the combination of serum AFP and PLCE1 expression showed a strong interaction and better predictive value for HBV-related HCC prognosis.
In conclusion, PLCE1 gene polymorphisms are associated with high AFP level(≥ 200 or 400ng/ml) in HBV-related HCC and can predict OS of patients following hepatic resection by stratification according to a serum AFP level of 20 ng/ml. In addition, we found that PLCE1 mRNA expression combined with serum AFP stratified at 300 ng/ml can predict HBV-related HCC prognosis and recurrence. Thus, the PLCE1 gene is a potential prognostic marker in HBV-related HCC, especially combined with serum AFP level. This is the first study reporting that the combination of serum AFP and PLCE1 gene polymorphism and mRNA expression has significant predictive value for clinical outcome of HBV-related HCC patients. Our findings provide evidence for the value of PLCE1gene polymorphism and mRNA expression in distinguishing the morbidity and prognosis of different subgroups of HBV-related HCC, and provide a basis for the development of personalized treatment strategies.
MATERIALS AND METHODS
Study population
The study protocol was approved by the Ethics Committee of the First Affiliated Hospital of Guangxi Medical University (approval no. 2015KY-E-032). Fresh surgically resected and pathologically confirmed HCC specimens (n = 421) collected at the First Affiliated Hospital of Guangxi Medical University from 2001 to 2013 were analyzed. All patients were positive for serum HBV surface antigen. Serum AFP levels were measured before hepatectomy. Cancer tissue specimens were collected during surgery and immediately stored at −80°C until use.
Genotyping
Genomic DNA was extracted from tumor samples using the TIANamp Genomic DNA kit (Tiangen Biotech, Beijing, China). Samples were genotyped by DNA sequencing with an ABIPrism 3100 system (Applied Biosystems/Shanghai Sangon Biological Engineering Technology and Services, Shanghai, China) using the following forward and reverse primers: 5'-GTTCTTGGGATTCCTTTGC-3' and 5'-CA TGGGTGAGGCTGTACTTT-3' for rs2274223; and 5'-GCTATGACTGTTTACTGGGATG-3' and 5'-AAG GAGCGAGGTGAGCAT-3' for rs3765524. Sequencing results were analyzed using Chromas software (http://technelysium.com.au/wp/chromas/) under conditions where signal-to-noise ratio was > 98%.
Association analysis
Hardy-Weinberg equilibrium was estimated for each SNP with the goodness-of-fit χ2 test. Linkage disequilibrium (LD) between SNPs of the PLCE1 gene was calculated using Haploview v.4.2, and the LD of normal CHB population was calculated based on published HapMap genotype data (https://snpinfo.niehs.nih.gov/snpinfo/snptag.html). Binary logistic regression was used to analyze the genetic model of PLCE1 genotypes and haplotypes for different serum AFP levels and the association between clinical risk factors and PLCE1 haplotypes. To investigate the association between PLCE1 mRNA expression and serum AFP level in the prediction of HBV-related HCC patient survival, we analyzed the expression profile chip dataset of HBV-related HCC from GEO (GSE14520). GeneMANIA was used for gene interaction analysis.
Statistical analysis
The correlation between AFP level and PLCE1 gene polymorphisms was assessed with the Spearman correlation coefficient. ORs and corresponding 95% CIs were calculated to estimate relative risk in the binary logistic regression model. Survival analysis was performed using the Kaplan-Meier method with the log-rank test for different clinical factors and haplotypes. Cox proportional hazards regression analysis was used to calculate the crude or adjusted HRs and 95% CIs in uni-and multivariate analyses, with adjustment for those with P < 0.1 in the univariate analysis or selected variables. A P value < 0.05 was considered statistically significant. Statistical analyses were carried out using SPSS v.20.0 software (IBM, Chicago, IL, USA).
Abbreviations
PLCE1, phospholipase C epsilon 1; AFP, α-fetoprotein; HBV, hepatitis B virus; HCC, hepatocellular carcinoma; SNPs, single nucleotide polymorphisms; CHB, Chinese Han in Beijing; OS, overall survival; DFS, disease-free survival; AFB1, aflatoxin B1; TP53, tumor protein p53; BCLC, Barcelona Clinic Liver Cancer; PVTT, portal vein tumor thrombus; LD, linkage disequilibrium; MST, median survival time; OR, odds ratio; HR: hazard ratio; CI, confidence interval.
Author contributions
Xiwen Liao, Chuangye Han, Wei Qin and Tao Peng designed this manuscript; Xiwen Liao, Chuangye Han, Wei Qin, Xiaoguang Liu, Long Yu, Guangzhi Zhu, Tingdong Yu, Sicong Lu, Hao Su, Zhen Liu, Zhiwei Chen, Chengkun Yang, Ketuan Huang, Zhengtao Liu, Yu Liang, Jianlu Huang, Jiahong Dong, Lequn Li, Xue Qin, Xinping Ye, Kaiyin Xiao, Minhao Peng, Tao Peng conducted the study, collected the tumor specimens and corresponding patients clinical data, follow-up and analyzed the data. Xiwen Liao wrote this manuscript and Tao Peng guided the writing.
ACKNOWLEDGMENTS
The authors thank Prof. Xiao Qin, Xigang Chen, Bin Chen, Liming Shang, Zhixiong Su, Ming Su, Zhang Wen, Jingning Lu, Ning Peng, Hai Zhu for providing part of hepatocellular carcinoma samples for this study, who are from the Department of Hepatobiliary Surgery, the First Affiliated Hospital of Guangxi Medical University. Thanks also go to the researcher Jiaquan Li and Ying Gui from Guangxi Medical University for their contribution to specimen management. In addition, We also would like to acknowledge the helpful comments on this paper received from our reviewers.
CONFLICTS OF INTEREST
No conflicts of interest was disclosed in this study.
FUNDING
This work was supported in part by the National Nature Science Foundation of China (No.: 81560535, 81072321, 30760243, 30460143 and 30560133), 2009 Program for New Century Excellent Talents in University (NCET), Guangxi Nature Sciences Foundation (No.: GuiKeGong 1104003A-7), and Guangxi Health Ministry Medicine Grant (Key-Scientific Research-Grant Z201018).
REFERENCES
1. Torre LA, Bray F, Siegel RL, Ferlay J, Lortet-Tieulent J, Jemal A. Global cancer statistics, 2012. CA Cancer J Clin. 2015; 65:87-108.
2. Schweitzer A, Horn J, Mikolajczyk RT, Krause G, Ott JJ. Estimations of worldwide prevalence of chronic hepatitis B virus infection: a systematic review of data published between 1965 and 2013. Lancet. 2015; 386:1546-55.
3. Llovet JM, Zucman-Rossi J, Pikarsky E, Sangro B, Schwartz M, Sherman M, Gores G. Hepatocellular carcinoma. Nat Rev Dis Primers. 2016; 2:16018.
4. Chen W, Zheng R, Baade PD, Zhang S, Zeng H, Bray F, Jemal A, Yu XQ, He J. Cancer statistics in China, 2015. CA Cancer J Clin. 2016; 66:115-32.
5. Zeng H, Zheng R, Guo Y, Zhang S, Zou X, Wang N, Zhang L, Tang J, Chen J, Wei K, Huang S, Wang J, Yu L, et al. Cancer survival in China, 2003-2005: a population-based study. Int J Cancer. 2015; 136:1921-30.
6. El-Serag HB, Rudolph KL. Hepatocellular Carcinoma: Epidemiology and Molecular Carcinogenesis. Gastroenterology. 2007; 132:2557-76.
7. Yeh FS, Yu MC, Mo CC, Luo S, Tong MJ, Henderson BE. Hepatitis B virus, aflatoxins, and hepatocellular carcinoma in southern Guangxi, China. Cancer Res. 1989; 49:2506-9.
8. Qi LN, Bai T, Chen ZS, Wu FX, Chen YY, De Xiang B, Peng T, Han ZG, Li LQ. The p53 mutation spectrum in hepatocellular carcinoma from Guangxi, China : role of chronic hepatitis B virus infection and aflatoxin B1 exposure. Liver Int. 2015; 35:999-1009.
9. Zhou M, Wang H, Zhu J, Chen W, Wang L, Liu S, Li Y, Wang L, Liu Y, Yin P, Liu J, Yu S, Tan F, et al. Cause-specific mortality for 240 causes in China during 1990-2013: a systematic subnational analysis for the Global Burden of Disease Study 2013. Lancet. 2016; 387:251-72.
10. Xu L, Qian G, Tang L, Su J, Wang JS. Genetic variations of hepatitis B virus and serum aflatoxin-lysine adduct on high risk of hepatocellular carcinoma in Southern Guangxi, China. J Hepatol. 2010; 53:671-6.
11. Stern MC, Umbach DM, Yu MC, London SJ, Zhang ZQ, Taylor JA. Hepatitis B, aflatoxin B(1), and p53 codon 249 mutation in hepatocellular carcinomas from Guangxi, People's Republic of China, and a meta-analysis of existing studies. Cancer Epidemiol Biomarkers Prev. 2001; 10:617-25.
12. Farazi PA, DePinho RA. Hepatocellular carcinoma pathogenesis: from genes to environment. Nat Rev Cancer. 2006; 6:674-87.
13. Stanaway JD, Flaxman AD, Naghavi M, Fitzmaurice C, Vos T, Abubakar I, Abu-Raddad LJ, Assadi R, Bhala N, Cowie B, Forouzanfour MH, Groeger J, Hanafiah KM, et al. The global burden of viral hepatitis from 1990 to 2013: findings from the Global Burden of Disease Study 2013. Lancet. 2016; 388:1081-8.
14. Petitjean A, Achatz MI, Borresen-Dale AL, Hainaut P, Olivier M. TP53 mutations in human cancers: functional selection and impact on cancer prognosis and outcomes. Oncogene. 2007; 26:2157-65.
15. Liu YY. Resuscitating wild-type p53 expression by disrupting ceramide glycosylation: a novel approach to target mutant p53 tumors. Cancer Res. 2011; 71:6295-9.
16. Olivier M, Hollstein M, Hainaut P. TP53 mutations in human cancers: origins, consequences, and clinical use. Cold Spring Harb Perspect Biol. 2010; 2:a001008.
17. Zhan P, Ji YN. Prognostic significance of TP53 expression for patients with hepatocellular carcinoma: a meta-analysis. Hepatobiliary Surg Nutr. 2014; 3:11-7.
18. Lok AS, Sterling RK, Everhart JE, Wright EC, Hoefs JC, Di Bisceglie AM, Morgan TR, Kim HY, Lee WM, Bonkovsky HL, Dienstag JL, Group H-CT. Des-gamma-carboxy prothrombin and alpha-fetoprotein as biomarkers for the early detection of hepatocellular carcinoma. Gastroenterology. 2010; 138:493-502.
19. Singal A, Volk ML, Waljee A, Salgia R, Higgins P, Rogers MA, Marrero JA. Meta-analysis: surveillance with ultrasound for early-stage hepatocellular carcinoma in patients with cirrhosis. Aliment Pharmacol Ther. 2009; 30:37-47.
20. European Association For The Study Of The L, European Organisation For R, Treatment Of C. EASL-EORTC clinical practice guidelines: management of hepatocellular carcinoma. J Hepatol. 2012; 56:908-43.
21. Bruix J, Sherman M, American Association for the Study of Liver D. Management of hepatocellular carcinoma: an update. Hepatology. 2011; 53:1020-2.
22. Yao M, Zhao J, Lu F. Alpha-fetoprotein still is a valuable diagnostic and prognosis predicting biomarker in hepatitis B virus infection-related hepatocellular carcinoma. Oncotarget. 2016; 7:3702-8. doi: 10.18632/oncotarget.6913.
23. Zhu M, Guo J, Li W, Lu Y, Fu S, Xie X, Xia H, Dong X, Chen Y, Quan M, Zheng S, Xie K, Li M. Hepatitis B virus X protein induces expression of alpha-fetoprotein and activates PI3K/mTOR signaling pathway in liver cells. Oncotarget. 2015; 6:12196-208. doi: 10.18632/oncotarget.2906.
24. Zhu M, Guo J, Li W, Xia H, Lu Y, Dong X, Chen Y, Xie X, Fu S, Li M. HBx induced AFP receptor expressed to activate PI3K/AKT signal to promote expression of Src in liver cells and hepatoma cells. BMC Cancer. 2015; 15:362.
25. Zhu M, Lu Y, Li W, Guo J, Dong X, Lin B, Chen Y, Xie X, Li M. Hepatitis B Virus X Protein Driven Alpha Fetoprotein Expression to Promote Malignant Behaviors of Normal Liver Cells and Hepatoma Cells. J Cancer. 2016; 7:935-46.
26. Qin S, Primary Liver Cancer D, Treatment Expert Panel of the Chinese Ministry of H. Guidelines on the diagnosis and treatment of primary liver cancer (2011 edition). Chin Clin Oncol. 2012; 1:10.
27. Xue W, Zhu M, Wang Y, He J, Zheng L. Association between PLCE1 rs2274223 A > G polymorphism and cancer risk: proof from a meta-analysis. Sci Rep. 2015; 5:7986.
28. Abnet CC, Freedman ND, Hu N, Wang Z, Yu K, Shu XO, Yuan JM, Zheng W, Dawsey SM, Dong LM, Lee MP, Ding T, Qiao YL, et al. A shared susceptibility locus in PLCE1 at 10q23 for gastric adenocarcinoma and esophageal squamous cell carcinoma. Nat Genet. 2010; 42:764-7.
29. Wang LD, Bi X, Song X, Pohl NM, Cheng Y, Zhou Y, Shears S, Ansong E, Xing M, Wang S, Xu XC, Huang P, Xu L, et al. A sequence variant in the phospholipase C epsilon C2 domain is associated with esophageal carcinoma and esophagitis. Mol Carcinog. 2013; 52:E80-6.
30. Hu H, Yang J, Sun Y, Yang Y, Qian J, Jin L, Wang M, Bi R, Zhang R, Zhu M, Sun M, Ma H, Wei Q, et al. Putatively functional PLCE1 variants and susceptibility to esophageal squamous cell carcinoma (ESCC): a case-control study in eastern Chinese populations. Ann Surg Oncol. 2012; 19:2403-10.
31. Cui XB, Chen YZ, Pang XL, Liu W, Hu JM, Li SG, Yang L, Zhang WJ, Liu CX, Cao YW, Jiang JF, Gu WY, Pang J, et al. Multiple polymorphisms within the PLCE1 are associated with esophageal cancer via promoting the gene expression in a Chinese Kazakh population. Gene. 2013; 530:315-22.
32. Liao X, Han C, Qin W, Liu X, Yu L, Lu S, Chen Z, Zhu G, Su H, Mo Z, Qin X, Peng T. Genome-wide association study identified PLCE1- rs2797992 and EGFR- rs6950826 were associated with TP53 expression in the HBV-related hepatocellular carcinoma of Chinese patients in Guangxi. Am J Transl Res. 2016; 8:1799-812.
33. Roessler S, Jia HL, Budhu A, Forgues M, Ye QH, Lee JS, Thorgeirsson SS, Sun Z, Tang ZY, Qin LX, Wang XW. A unique metastasis gene signature enables prediction of tumor relapse in early-stage hepatocellular carcinoma patients. Cancer Res. 2010; 70:10202-12.
34. Bunney TD, Katan M. Phospholipase C epsilon: linking second messengers and small GTPases. Trends Cell Biol. 2006; 16:640-8.
35. Wing MR, Bourdon DM, Harden TK. PLC-epsilon: a shared effector protein in Ras-, Rho-, and G alpha beta gamma-mediated signaling. Mol Interv. 2003; 3:273-80.
36. Bunney TD, Baxendale RW, Katan M. Regulatory links between PLC enzymes and Ras superfamily GTPases: signalling via PLCepsilon. Adv Enzyme Regul. 2009; 49:54-8.
37. Wang LD, Zhou FY, Li XM, Sun LD, Song X, Jin Y, Li JM, Kong GQ, Qi H, Cui J, Zhang LQ, Yang JZ, Li JL, et al. Genome-wide association study of esophageal squamous cell carcinoma in Chinese subjects identifies susceptibility loci at PLCE1 and C20orf54. Nat Genet. 2010; 42:759-63.
38. Li M, Edamatsu H, Kitazawa R, Kitazawa S, Kataoka T. Phospholipase Cepsilon promotes intestinal tumorigenesis of Apc(Min/+) mice through augmentation of inflammation and angiogenesis. Carcinogenesis. 2009; 30:1424-32.
39. Wang X, Zbou C, Qiu G, Fan J, Tang H, Peng Z. Screening of new tumor suppressor genes in sporadic colorectal cancer patients. Hepatogastroenterology. 2008; 55:2039-44.
40. Danielsen SA, Cekaite L, Agesen TH, Sveen A, Nesbakken A, Thiis-Evensen E, Skotheim RI, Lind GE, Lothe RA. Phospholipase C isozymes are deregulated in colorectal cancer--insights gained from gene set enrichment analysis of the transcriptome. PLoS One. 2011; 6:e24419.
41. Wang X, Zhou C, Qiu G, Yang Y, Yan D, Xing T, Fan J, Tang H, Peng Z. Phospholipase C epsilon plays a suppressive role in incidence of colorectal cancer. Med Oncol. 2012; 29:1051-8.
42. Cheng H, Luo C, Wu X, Zhang Y, He Y, Wu Q, Xia Y, Zhang J. shRNA targeting PLCepsilon inhibits bladder cancer cell growth in vitro and in vivo. Urology. 2011; 78:474 e7-11.
43. Ou L, Guo Y, Luo C, Wu X, Zhao Y, Cai X. RNA interference suppressing PLCE1 gene expression decreases invasive power of human bladder cancer T24 cell line. Cancer Genet Cytogenet. 2010; 200:110-9.
44. Chen G, Hu J, Huang Z, Yang L, Chen M. MicroRNA-1976 functions as a tumor suppressor and serves as a prognostic indicator in non-small cell lung cancer by directly targeting PLCE1. Biochem Biophys Res Commun. 2016; 473:1144-51.
45. Bai Y, Edamatsu H, Maeda S, Saito H, Suzuki N, Satoh T, Kataoka T. Crucial role of phospholipase Cepsilon in chemical carcinogen-induced skin tumor development. Cancer Res. 2004; 64:8808-10.
46. Stolzel F, Pfirrmann M, Aulitzky WE, Kaufmann M, Bodenstein H, Bornhauser M, Rollig C, Kramer M, Mohr B, Oelschlagel U, Schmitz N, Soucek S, Thiede C, et al. Risk stratification using a new prognostic score for patients with secondary acute myeloid leukemia: results of the prospective AML96 trial. Leukemia. 2011; 25:420-8.
47. Li WQ, Hu N, Burton VH, Yang HH, Su H, Conway CM, Wang L, Wang C, Ding T, Xu Y, Giffen C, Abnet CC, Goldstein AM, et al. PLCE1 mRNA and protein expression and survival of patients with esophageal squamous cell carcinoma and gastric adenocarcinoma. Cancer Epidemiol Biomarkers Prev. 2014; 23:1579-88.
48. Chen YZ, Cui XB, Hu JM, Zhang WJ, Li SG, Yang L, Shen XH, Liu CX, Pan QF, Yu SY, Yuan XL, Yang L, Gu WY, et al. Overexpression of PLCE1 in Kazakh esophageal squamous cell carcinoma: implications in cancer metastasis and aggressiveness. APMIS. 2013; 121:908-18.
49. Cui XB, Li S, Li TT, Peng H, Jin TT, Zhang SM, Liu CX, Yang L, Shen YY, Li SG, Li N, Li Y, Hu JM, et al. Targeting oncogenic PLCE1 by miR-145 impairs tumor proliferation and metastasis of esophageal squamous cell carcinoma. Oncotarget. 2016; 7:1777-95. doi: 10.18632/oncotarget.6499.
50. Zhao L, Wei ZB, Yang CQ, Chen JJ, Li D, Ji AF, Ma L. Effects of PLCE1 gene silencing by RNA interference on cell cycling and apoptosis in esophageal carcinoma cells. Asian Pac J Cancer Prev. 2014; 15:5437-42.
51. Cui XB, Pang XL, Li S, Jin J, Hu JM, Yang L, Liu CX, Li L, Wen SJ, Liang WH, Chen YZ, Li F. Elevated expression patterns and tight correlation of the PLCE1 and NF-kappaB signaling in Kazakh patients with esophageal carcinoma. Med Oncol. 2014; 31:791.
52. Li Y, An J, Huang S, Liao H, Weng Y, Cai S, Zhang J. PLCE1 suppresses p53 expression in esophageal cancer cells. Cancer Invest. 2014; 32:236-40.
53. Luo XP. Phospholipase C epsilon-1 inhibits p53 expression in lung cancer. Cell Biochem Funct. 2014; 32:294-8.
54. Han N, Zhao W, Zhang Z, Zheng P. MiR-328 suppresses the survival of esophageal cancer cells by targeting PLCE1. Biochem Biophys Res Commun. 2016; 470:175-80.
55. Sun H, Wu X, Wu F, Li Y, Yu Z, Chen X, Chen Y, Yang W. Associations of genetic variants in the PSCA, MUC1 and PLCE1 genes with stomach cancer susceptibility in a Chinese population. PLoS One. 2015; 10:e0117576.
56. Wang M, Zhang R, He J, Qiu L, Li J, Wang Y, Sun M, Yang Y, Wang J, Yang J, Qian J, Jin L, Ma H, et al. Potentially functional variants of PLCE1 identified by GWASs contribute to gastric adenocarcinoma susceptibility in an eastern Chinese population. PLoS One. 2012; 7:e31932.
57. Yuan J, Li Y, Tian T, Li N, Zhu Y, Zou J, Gao J, Shen L. Risk prediction for early-onset gastric carcinoma: a case-control study of polygenic gastric cancer in Han Chinese with hereditary background. Oncotarget. 2016; 7:33608-15. doi: 10.18632/oncotarget.9025.
58. Tan J, Yu CY, Wang ZH, Chen HY, Guan J, Chen YX, Fang JY. Genetic variants in the inositol phosphate metabolism pathway and risk of different types of cancer. Sci Rep. 2015; 5:8473.
59. Li FX, Yang XX, He XQ, Hu NY, Wu YS, Li M. Association of 10q23 with colorectal cancer in a Chinese population. Mol Biol Rep. 2012; 39:9557-62.
60. Duan X, Li X, Lou H, Geng T, Jin T, Liang P, Li S, Long Y, Chen C. Genetic association of PLCE1, C11orf92-C11orf93, and NOC3L with colorectal cancer risk in the Han population. Tumour Biol. 2014; 35:1813-7.
61. Wang Q, Chen P, Chen D, Liu F, Pan W. Association between phospholipase C epsilon gene (PLCE1) polymorphism and colorectal cancer risk in a Chinese population. J Int Med Res. 2014; 42:270-81.
62. Zhang Y, Gong Y, Du S, Yan M, Geng T, Feng T, Wang J, Jin T. The association between phospholipase C epsilon gene (PLCE1) polymorphisms and colorectal cancer risk in a Chinese Han population: a case-control study. Int J Clin Exp Med. 2015; 8:19360-6.
63. Wu C, Hu Z, He Z, Jia W, Wang F, Zhou Y, Liu Z, Zhan Q, Liu Y, Yu D, Zhai K, Chang J, Qiao Y, et al. Genome-wide association study identifies three new susceptibility loci for esophageal squamous-cell carcinoma in Chinese populations. Nat Genet. 2011; 43:679-84.
64. Jia X, Liu P, Zhang M, Feng T, Tang H, Tang Z, Zhao H, Jin T. Genetic variants at 6p21, 10q23, 16q21 and 22q12 are associated with esophageal cancer risk in a Chinese Han population. Int J Clin Exp Med. 2015; 8:19381-7.
65. Yang J, Wu H, Wei S, Xiong H, Fu X, Qi Z, Jiang Q, Li W, Hu G, Yuan X, Liao Z. HPV seropositivity joints with susceptibility loci identified in GWASs at apoptosis associated genes to increase the risk of Esophageal Squamous Cell Carcinoma (ESCC). BMC Cancer. 2014; 14:501.
66. Gu H, Ding G, Zhang W, Liu C, Chen Y, Chen S, Jiang P. Replication study of PLCE1 and C20orf54 polymorphism and risk of esophageal cancer in a Chinese population. Mol Biol Rep. 2012; 39:9105-11.
67. Qu Y, Zhang S, Cui L, Wang K, Song C, Wang P, Zhang J, Dai L. Two novel polymorphisms in PLCE1 are associated with the susceptibility to esophageal squamous cell carcinoma in Chinese population. Dis Esophagus. 2016.
68. Duan F, Xie W, Cui L, Wang P, Song C, Qu H, Wang K, Zhang J, Dai L. Novel functional variants locus in PLCE1 and susceptibility to esophageal squamous cell carcinoma: based on published genome-wide association studies in a central Chinese population. Cancer Epidemiol. 2013; 37:647-52.
69. Cui X, Chen Y, Liu L, Li L, Hu J, Yang L, Liang W, Li F. Heterozygote of PLCE1 rs2274223 increases susceptibility to human papillomavirus infection in patients with esophageal carcinoma among the Kazakh populations. J Med Virol. 2014; 86:608-17.
70. Palmer AJ, Lochhead P, Hold GL, Rabkin CS, Chow WH, Lissowska J, Vaughan TL, Berry S, Gammon M, Risch H, El-Omar EM. Genetic variation in C20orf54, PLCE1 and MUC1 and the risk of upper gastrointestinal cancers in Caucasian populations. Eur J Cancer Prev. 2012; 21:541-4.
71. Song HR, Kim HN, Kweon SS, Choi JS, Shim HJ, Cho SH, Chung IJ, Park YK, Kim SH, Choi YD, Joo KW, Shin MH. Common genetic variants at 1q22 and 10q23 and gastric cancer susceptibility in a Korean population. Tumour Biol. 2014; 35:3133-7.
72. Malik MA, Srivastava P, Zargar SA, Mittal B. Phospholipase C epsilon 1 (PLCE1) haplotypes are associated with increased risk of gastric cancer in Kashmir Valley. Saudi J Gastroenterol. 2014; 20:371-7.
73. Dura P, Bregitha CV, te Morsche RH, Roelofs HM, Kristinsson JO, Wobbes T, Witteman BJ, Tan AC, Drenth JP, Peters WH. GWAS-uncovered SNPs in PLCE1 and RFT2 genes are not implicated in Dutch esophageal adenocarcinoma and squamous cell carcinoma etiology. Eur J Cancer Prev. 2013; 22:417-9.
74. Piao JM, Shin MH, Kim HN, Song HR, Kweon SS, Choi JS, Shim HJ, Hwang JE, Bae WK, Kim SH, Choi YD, Cui LH. Replication of results of genome-wide association studies on esophageal squamous cell carcinoma susceptibility loci in a Korean population. Dis Esophagus. 2014; 27:798-801.
75. Sharma KL, Rai R, Srivastava A, Sharma A, Misra S, Kumar A, Mittal B. A multigenic approach to evaluate genetic variants of PLCE1, LXRs, MMPs, TIMP, and CYP genes in gallbladder cancer predisposition. Tumour Biol. 2014; 35:8597-606.
76. Sharma KL, Umar M, Pandey M, Misra S, Kumar A, Kumar V, Mittal B. Association of potentially functional genetic variants of PLCE1 with gallbladder cancer susceptibility in north Indian population. J Gastrointest Cancer. 2013; 44:436-43.
77. Kupcinskas J, Gyvyte U, Bruzaite I, Leja M, Kupcinskaite-Noreikiene R, Pauzas H, Tamelis A, Jonaitis L, Skieceviciene J, Kiudelis G. Common Genetic Variants of PSCA, MUC1 and PLCE1 Genes are not Associated with Colorectal Cancer. Asian Pac J Cancer Prev. 2015; 16:6027-32.
78. Umar M, Upadhyay R, Kumar S, Ghoshal UC, Mittal B. Role of novel and GWAS originated PLCE1 genetic variants in susceptibility and prognosis of esophageal cancer patients in northern Indian population. Tumour Biol. 2014; 35:11667-76.
79. Mocellin S, Verdi D, Pooley KA, Nitti D. Genetic variation and gastric cancer risk: a field synopsis and meta-analysis. Gut. 2015; 64:1209-19.
80. Luo D, Gao Y, Wang S, Wang M, Wu D, Wang W, Xu M, Zhou J, Gong W, Tan Y, Zhang Z. Genetic variation in PLCE1 is associated with gastric cancer survival in a Chinese population. J Gastroenterol. 2011; 46:1260-6.
81. Zhu H, Yang M, Zhang H, Chen X, Yang X, Zhang C, Qin Q, Cheng H, Sun X. Genome-wide association pathway analysis to identify candidate single nucleotide polymorphisms and molecular pathways for gastric adenocarcinoma. Tumour Biol. 2015; 36:5635-9.
82. Lee JH, Kim Y, Choi JW, Kim YS. Genetic variants and risk of gastric cancer: a pathway analysis of a genome-wide association study. Springerplus. 2015; 4:215.
83. Mou X, Li T, Wang J, Ali Z, Zhang Y, Chen Z, Deng Y, Li S, Su E, Jia Q, He N, Ni J, Cui D. Genetic Variation of BCL2 (rs2279115), NEIL2 (rs804270), LTA (rs909253), PSCA (rs2294008) and PLCE1 (rs3765524, rs10509670) Genes and Their Correlation to Gastric Cancer Risk Based on Universal Tagged Arrays and Fe3O4 Magnetic Nanoparticles. J Biomed Nanotechnol. 2015; 11:2057-66.
84. Malik MA, Umar M, Gupta U, Zargar SA, Mittal B. Phospholipase C epsilon 1 (PLCE1 rs2274223A>G, rs3765524C>T and rs7922612C>T) polymorphisms and esophageal cancer risk in the Kashmir Valley. Asian Pac J Cancer Prev. 2014; 15:4319-23.
85. He Y, Wang C, Wang Z, Zhou Z. Genetic variant PLCE1 rs2274223 and gastric cancer: more to be explored? Gut. 2016; 65:359-60.
86. Han C, Yu L, Liu X, Yu T, Qin W, Liao X, Liu Z, Lu S, Chen Z, Su H, Zhu G, Qin X, Gui Y, et al. ATXN7 Gene Variants and Expression Predict Post-Operative Clinical Outcomes in Hepatitis B Virus-Related Hepatocellular Carcinoma. Cell Physiol Biochem. 2016; 39:2427-38.