
INTRODUCTION
Despite advances in combination therapies involving surgery, radiotherapy, chemotherapy, and currently available molecular-targeted therapy for head and neck squamous cell carcinoma (HNSCC), the survival rate of patients with this disease has not improved [1–3]. HNSCC develops in the mucous membranes of the nasopharynx, oral cavity, oropharynx, larynx, and hypopharynx [4]. Among patients with HNSCC, hypopharyngeal squamous cell carcinoma is one of the most aggressive malignancies and has an extremely low survival rate due to the high rates of locoregional recurrence and distant metastasis [1, 5]. Control of cancer recurrence and metastasis may lead to improvement of HNSCC disease prognosis. Therefore, it is needed to improve our understanding of the molecular pathogenesis of HNSCC aggressiveness using current genomic-based strategies.
MicroRNAs (miRNAs) act as fine-tuners that regulate the expression control of protein-coding/protein-noncoding genes by sequence depending manner [6]. A vast extent of studies have reported that dysregulation of miRNA expression is involved in the pathogenesis of human cancers, including HNSCC [7, 8]. As a unique nature of miRNA biogenesis, a single miRNA can control thousands of target RNAs [9]. Thus, identification of novel cancer networks mediated by dysregulated miRNAs may provide insight into the pathogenesis and treatment of cancer.
Current advanced genome-based technologies can identify abnormally expressed miRNAs in various types of cancer cells [10]. To identify differentially expressed miRNAs, we used clinical specimens to establish microarray-based, polymerase chain reaction (PCR)-based, and deep sequencing-based miRNA expression signatures [11–19]. From the HNSCC miRNA expression signature, we have identified the miR-29-family, miR-218, miR-451a, and the miR-26-family acted as antitumor miRNAs and their miRNAs mediated metastasis-promoting pathways [13, 14, 20–22].
In this study, we newly constructed the RNA sequencing-based miRNA expression signature of HNSCC using laryngeal and hypopharyngeal clinical specimens. Our present data showed that 160 miRNAs (44 upregulated and 116 downregulated) were aberrantly expressed in cancer tissues. Among the downregulated miRNAs, we focused on the dual strands of pre-miR-150, i.e., miR-150-5p and miR-150-3p, in the HNSCC signature. Both of these miRNAs were markedly reduced in HNSCC tissues, indicating that these miRNAs may act as antitumor miRNAs in HNSCC cells. However, the roles of these miRNAs and their targets in HNSCC cells are still unclear.
It is generally accepted in miRNA biogenesis that processing of the pre-miRNA through Dicer1 generates a miRNA duplex (a passenger strand and a guide strand). It is thought that guide strand of miRNA is incorporated into the RNA-induced silencing complex (RISC) to target messenger RNAs, whereas the passenger strand of miRNA is degraded and has not functioned regulatory activity in cells [23–25]. The aim of this study was to investigate the antitumor functions of both strands of pre-miR-150 (miR-150-5p and miR-150-3p) and to identify their targeted oncogenic genes and pathways in HNSCC cells. Elucidation of antitumor miRNA-mediated cancer networks may provide novel insights into the molecular pathogenesis of HNSCC.
RESULTS
Sequencing of small RNAs and construction of the miRNA expression signature of HNSCC
To prepare the miRNA expression signature of HNSCC, we performed small RNA sequencing of 6 HNSCC samples (Table 1). Initially, 12,180,452 to 24,845,427 raw sequence reads were analysed for the small RNA libraries (Supplementary Table 1). After filing and trimming of the sequenced reads, from 5,690,747 to 15,951,587 locations aligned uniquely and multiply matched reads were obtained (Supplementary Table 2). All of the sequenced reads (larger than 19 nucleotides) were assigned on the human genome, and these human genome-matched sequenced reads were divided into small RNAs according to their biological features (Supplementary Table 3).
Table 1: Clinical features of 22 HNSCC patients
No. |
Age |
Sex |
Location |
T |
N |
M |
Stage |
Differentiaion |
remarks |
|---|---|---|---|---|---|---|---|---|---|
1 |
66 |
M |
hypopharynx |
2 |
2c |
0 |
IVa |
moderate |
deep sequencing |
2 |
66 |
M |
hypopharynx |
4b |
2c |
0 |
IVb |
moderate |
deep sequencing |
3 |
45 |
M |
hypopharynx |
4a |
2c |
0 |
IVa |
moderate |
deep sequencing |
4 |
75 |
M |
hypopharynx |
4a |
2c |
0 |
IVa |
well |
deep sequencing |
5 |
82 |
M |
larynx |
4a |
0 |
0 |
IVa |
moderate |
deep sequencing |
6 |
50 |
M |
larynx |
4a |
2b |
0 |
IVa |
moderate |
deep sequencing |
7 |
58 |
M |
hypopharynx |
4a |
0 |
0 |
IVa |
well |
IHC staining |
8 |
76 |
M |
hypopharynx |
4a |
1 |
0 |
IVa |
well |
|
9 |
66 |
M |
hypopharynx |
4a |
2c |
0 |
IVa |
well |
|
10 |
74 |
M |
hypopharynx |
4a |
2c |
0 |
IVa |
poor |
|
11 |
69 |
M |
larynx |
3 |
0 |
0 |
III |
well |
|
12 |
85 |
M |
larynx |
3 |
2b |
0 |
IVa |
moderate |
|
13 |
70 |
M |
larynx |
4a |
1 |
0 |
IVa |
well-moderate |
|
14 |
84 |
M |
larynx |
4a |
0 |
0 |
IVa |
moderate |
|
15 |
74 |
M |
tongue |
1 |
0 |
0 |
I |
well |
|
16 |
66 |
M |
tongue |
2 |
0 |
0 |
II |
moderate |
IHC staining |
17 |
73 |
M |
tongue |
3 |
1 |
0 |
III |
poor |
|
18 |
72 |
M |
tongue |
4a |
2b |
0 |
IVa |
moderate |
|
19 |
83 |
M |
oral floor |
2 |
1 |
0 |
III |
well |
|
20 |
77 |
M |
oral floor |
2 |
2b |
0 |
IVa |
moderate |
|
21 |
68 |
F |
oral floor |
4a |
1 |
0 |
IVa |
well |
|
22 |
69 |
M |
orophalynx |
1 |
0 |
0 |
I |
well |
In this study, a total of 116 downregulated miRNAs and 44 upregulated miRNAs were detected from aligned reads using R program (Table 2 and Supplementary Tables 4A and 4B).
Table 2: Downregulated miRNAs identified by deep sequencing of HNSCC clinical specimens
MicroRNA |
Accession No. |
Location |
Log2 fold change |
FDR |
Normalized read count (Log2) |
|
|---|---|---|---|---|---|---|
(false discovery rate) |
Normal |
Cancer |
||||
hsa-miR-375 |
MI0000783_1 |
2q35 |
-5.463 |
0.0484 |
14.39 |
8.93 |
hsa-miR-133a-2 |
MI0000451_1 |
20q13.33 |
-4.535 |
0.3039 |
9.76 |
5.22 |
hsa-miR-133a-1 |
MI0000450_1 |
18q11.2 |
-4.502 |
0.3054 |
9.75 |
5.25 |
hsa-miR-150-3p |
MI0000479_1 |
19q13.33 |
-3.933 |
0.1521 |
5.70 |
1.76 |
hsa-miR-1-2 |
MI0000437_1 |
18q11.2 |
-3.644 |
0.3857 |
14.68 |
11.04 |
hsa-miR-1-1 |
MI0000651_1 |
20q13.33 |
-3.636 |
0.3864 |
14.72 |
11.08 |
hsa-miR-135a-2-5p |
MI0000453_1 |
12q23.1 |
-3.307 |
0.1744 |
5.86 |
2.55 |
hsa-miR-135a-1-5p |
MI0000452_2 |
3p21.1 |
-3.274 |
0.1746 |
5.81 |
2.53 |
hsa-miR-885-5p |
MI0005560_2 |
3p25.3 |
-3.160 |
0.1094 |
4.14 |
0.98 |
hsa-miR-4521 |
MI0016887_1 |
17p13 |
-3.107 |
0.1898 |
9.08 |
5.97 |
hsa-miR-150-5p |
MI0000479_2 |
19q13.33 |
-2.910 |
0.2039 |
13.41 |
10.50 |
hsa-miR-139-5p |
MI0000261_2 |
11q13.4 |
-2.863 |
0.0763 |
12.36 |
9.49 |
hsa-miR-504 |
MI0003189_1 |
Xq26.3 |
-2.745 |
0.1818 |
7.43 |
4.69 |
hsa-miR-497-5p |
MI0003138_2 |
17p13.1 |
-2.678 |
0.1496 |
7.89 |
5.21 |
hsa-miR-99a-3p |
MI0000101_2 |
21q21.1 |
-2.446 |
0.0749 |
8.17 |
5.72 |
hsa-miR-100-5p |
MI0000102_2 |
11q24.1 |
-2.438 |
0.1006 |
17.31 |
14.87 |
hsa-miR-99a-5p |
MI0000101_1 |
21q21.1 |
-2.389 |
0.0107 |
18.21 |
15.83 |
hsa-miR-125b-2-5p |
MI0000470_1 |
21q21.1 |
-2.373 |
0.0863 |
15.65 |
13.28 |
hsa-miR-125b-1-5p |
MI0000446_2 |
11q24.1 |
-2.344 |
0.0882 |
15.64 |
13.29 |
hsa-miR-338-3p |
MI0000814_1 |
17q25.3 |
-2.205 |
0.2557 |
6.28 |
4.07 |
hsa-miR-582-5p |
MI0003589_2 |
5q12.1 |
-2.095 |
0.1636 |
8.05 |
5.95 |
hsa-miR-451a |
MI0001729_1 |
17q11.2 |
-2.063 |
0.3321 |
14.56 |
12.50 |
hsa-miR-887 |
MI0005562_1 |
5p15.1 |
-2.053 |
0.2633 |
5.06 |
3.00 |
hsa-miR-1247-5p |
MI0006382_2 |
14q32.31 |
-2.034 |
0.2610 |
4.61 |
2.58 |
hsa-miR-195-5p |
MI0000489_2 |
17p13.1 |
-2.028 |
0.1470 |
11.16 |
9.13 |
hsa-miR-144-5p |
MI0000460_2 |
17q11.2 |
-1.963 |
0.2622 |
8.49 |
6.52 |
hsa-let-7c |
MI0000064_1 |
21q21.1 |
-1.931 |
0.0432 |
15.29 |
13.36 |
hsa-miR-29c-3p |
MI0000735_1 |
1q32.2 |
-1.929 |
0.3842 |
10.44 |
8.51 |
hsa-miR-145-5p |
MI0000461_1 |
5q32 |
-1.927 |
0.1849 |
15.26 |
13.34 |
hsa-miR-199b-5p |
MI0000282_2 |
9q34.11 |
-1.896 |
0.2647 |
16.03 |
14.13 |
hsa-miR-29c-5p |
MI0000735_2 |
1q32.2 |
-1.872 |
0.2625 |
8.28 |
6.41 |
hsa-miR-126-5p |
MI0000471_1 |
9q34.3 |
-1.836 |
0.2607 |
12.79 |
10.95 |
hsa-miR-29a-3p |
MI0000087_1 |
7q32.3 |
-1.798 |
0.1147 |
14.70 |
12.91 |
hsa-miR-664-3p |
MI0006442_1 |
1q41 |
-1.781 |
0.1149 |
9.84 |
8.06 |
hsa-miR-125b-1-3p |
MI0000446_1 |
11q24.1 |
-1.723 |
0.2313 |
8.69 |
6.96 |
hsa-miR-140-3p |
MI0000456_2 |
16q22.1 |
-1.721 |
0.1487 |
14.08 |
12.36 |
hsa-miR-338-5p |
MI0000814_2 |
17q25.3 |
-1.703 |
0.2685 |
7.45 |
5.75 |
hsa-miR-486-5p |
MI0002470_2 |
8p11.21 |
-1.702 |
0.2652 |
11.98 |
10.27 |
hsa-miR-10b-5p |
MI0000267_1 |
2q31.1 |
-1.682 |
0.0482 |
17.08 |
15.40 |
hsa-miR-29a-5p |
MI0000087_2 |
7q32.3 |
-1.648 |
0.4284 |
4.44 |
2.79 |
hsa-miR-1468 |
MI0003782_1 |
Xq11 |
-1.611 |
0.2468 |
4.65 |
3.03 |
hsa-miR-10b-3p |
MI0000267_2 |
2q31.1 |
-1.585 |
0.1037 |
6.49 |
4.91 |
hsa-miR-140-5p |
MI0000456_1 |
16q22.1 |
-1.582 |
0.2556 |
11.22 |
9.64 |
hsa-miR-195-3p |
MI0000489_1 |
17p13.1 |
-1.565 |
0.3212 |
8.58 |
7.02 |
hsa-miR-203 |
MI0000283_1 |
14q32.33 |
-1.564 |
0.3170 |
17.58 |
16.02 |
hsa-miR-585 |
MI0003592_1 |
5q35.1 |
-1.564 |
0.1830 |
6.76 |
5.20 |
hsa-miR-126-3p |
MI0000471_2 |
9q34.3 |
-1.560 |
0.1626 |
17.53 |
15.97 |
hsa-miR-145-3p |
MI0000461_2 |
5q32 |
-1.552 |
0.2569 |
9.56 |
8.01 |
hsa-miR-26b-5p |
MI0000084_1 |
2q35 |
-1.547 |
0.0804 |
15.66 |
14.12 |
hsa-miR-29b-2-5p |
MI0000107_2 |
1q32.2 |
-1.531 |
0.1254 |
6.52 |
4.99 |
hsa-miR-154-5p |
MI0000480_1 |
14q32.31 |
-1.524 |
0.2568 |
5.64 |
4.11 |
hsa-miR-146a-5p |
MI0000477_1 |
5q33.3 |
-1.502 |
0.2794 |
13.38 |
11.88 |
Expression levels of miR-150-5p and miR-150-3p in HNSCC clinical specimens and cell lines
The stem-loop sequence of miR-150 and the mature sequences of miR-150-5p and miR-150-3p are shown in Supplementary Figure 1A. Database (http://www.mirbase.org/) indicates that miR-150-5p is recognized as a guide strand and miR-150-3p as a passenger strand.
Expression levels of miR-150-5p and miR-150-3p in HNSCC tissues (n = 22), normal epithelial tissues (n = 22), and three HNSCC cell lines (including FaDu, SAS and HSC3 cells) were evaluated. Clinical features of patients with HNSCC are summarised in Table 1. The expression levels of miR-150-5p and miR-150-3p were markedly lower in tumor tissues and HNSCC cell lines than in normal epithelial tissues (P = 0.0048 and P = 0.0027, respectively, Figure 1A). Spearman’s rank tests showed positive correlations between the expression of miR-150-5p and miR-150-3p (R = 0.626 and P < 0.0001; Figure 1A).
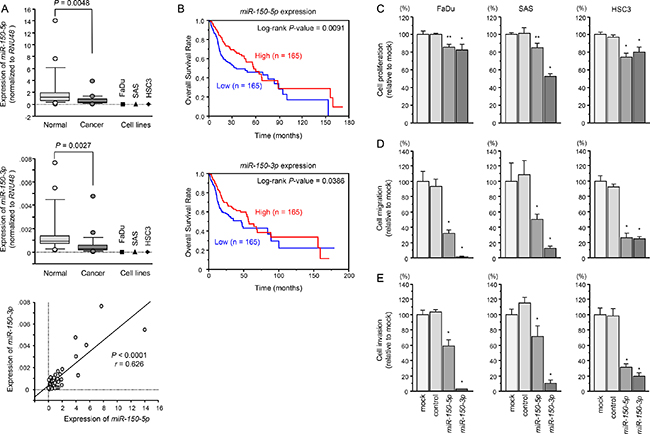
Figure 1: Expression levels of miR-150-5p and miR-150-3p in HNSCC clinical specimens and functional significance of miR-150-5p and miR-150-3p in HNSCC cells. (A) Expression levels of miR-150-5p and miR-150-3p in HNSCC clinical specimens and cell lines. RNU48 was used as an internal control. Spearman’s rank test showed a positive correlation between the expressions of miR-150-5p and miR-150-3p. (B) Kaplan–Meier survival curves, as determined using data from the TCGA database. (C) Cell proliferation was determined by XTT assay 72 h after transfection with miR-150-5p and miR-150-3p. *P < 0.0001, **P < 0.0005. (D) Cell movement was assessed by migration assays 48 h after transfection with miR-150-5p and miR-150-3p. *P < 0.0001. (E) Cell invasion was characterised by invasion assays 48 h after transfection with miR-150-5p and miR-150-3p. *P < 0.0001.
A large cohort analysis (n = 330) using data from the TCGA database revealed that low expression of miR-150-5p and miR-150-3p predicted the overall survival of HNSCC patients (P = 0.0091 and p = 0.0386, respectively; Figure 1B).
Both strands of miRNAs (miR-150-5p and miR-150-3p) incorporated into RISC in SAS cells
We hypothesized that passenger strand of miR-150-3p might be incorporated into the RISC and functioned in cancer cells. We performed immunoprecipitation with antibodies targeting Ago2, which plays a central role in the RISC. After transfection with miR-150-5p or miR-150-3p, Ago2-bound miRNAs were isolated, and RT-qPCR was carried out to determine whether miR-150-5p and miR-150-3p bound to Ago2 (Supplementary Figure 1B).
After transfection with miR-150-5p and immunoprecipitation by anti-Ago2 antibodies, detection level of miR-150-5p was significantly higher than those of mock- or miR-control-transfected cells and those of miR-150-3p-transefected SAS cells (P < 0.0001; Supplementary Figure 1C). Likewise miR-150-5p transfection, miR-150-3p was detected by Ago2 immunoprecipitation (P < 0.0001; Supplementary Figure 1C).
Ectopic expression effects of miR-150-5p and miR-150-3p in HNSCC cell lines
The anti-tumor roles of miR-150-5p and miR-150-3p were in investigated by using mature miRNA transfection into cancer cell lines, FaDu, SAS and HSC3.
Cancer cell proliferations were inhibited by transfected with miR-150-5p or miR-150-3p in comparison with mock or control transfectants (*P < 0.0001, **P < 0.0005, respectively; Figure 1C). Migration activities were significantly suppressed after transfection with miR-150-5p or miR-150-3p (P < 0.0001, Figure 1D). Similarly, invasion assays showed that transfection with miR-150-5p or miR-150-3p significantly suppressed cell invasion activity (P < 0.0001; Figure 1E).
Synergistic effects of miR-150-5p and miR-150-3p were investigated by proliferation and migration assays with co-transfection of miR-150-5p and miR-150-3p in FaDu cells. There were no apparent synergistic effects following co-transfection with these miRNAs (Supplementary Figure 2A and 2B).
Identification of putative target genes regulated by both miR-150-5p and miR-150-3p in HNSCC cells
To identify putative target genes coordinately regulated by miR-150-5p and miR-150-3p, we performed applied to combination of in silico analyses, oligomicroarray expression analyses, and Gene Omnibus database (GEO) analyses. Our strategy for selection of putative target genes that were coordinately regulated by miR-150-5p and miR-150-3p is shown in Figure 2A.
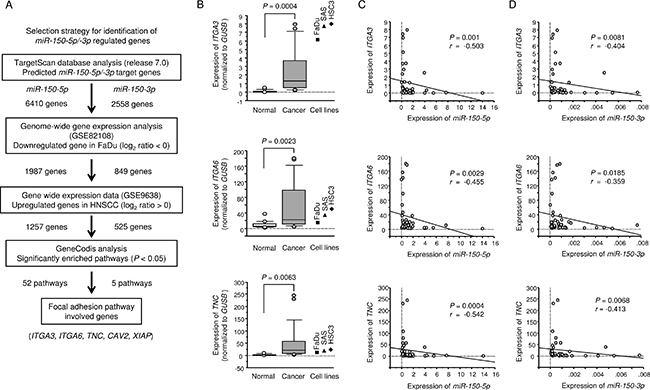
Figure 2: Identification of miR-150-5p and miR-150-3p target genes and expression levels of three genes in HNSCC clinical specimens. (A) Flow chart depicting the strategy for identification of miR-150-5p and miR-150-3p target genes. (B) Expression levels of ITGA3, ITGA6, and TNC in HNSCC clinical specimens and cell lines. GUSB was used as an internal control. (C) The negative correlation between gene expression and miR-150-5p. Spearman’s rank test was used to evaluate the correlation. (D) The negative correlation between gene expression and miR-150-3p. Spearman’s rank test was used to evaluate the correlation.
The TargetScan database (release 7.0) showed that 6,410 and 2,558 genes had putative target sites for miR-150-5p and miR-150-3p, respectively. First, we analysed genome-wide gene expression assays using FaDu cells (GEO accession number: GSE82108). A total of 1,987 and 849 genes were downregulated in miR-150-5p and miR-150-3p transfectants, respectively, and had putative binding sites in their 3′-UTRs. Next step, to evaluate upregulated genes in clinical HNSCC samples (GEO accession number: GSE9638). We identified 1,257 and 525 genes as putative target genes for miR-150-5p and miR-150-3p, respectively, in HNSCC cells.
Finally, we categorised these putative target genes into Kyoto Encyclopedia of Genes and Genomes (KEGG) pathways using the GeneCodis database, and 52 and 5 pathways were listed as putative miR-150-5 and miR-150-3p regulated pathways (Tables 3 and 4). Among these pathways, we focused on the focal adhesion pathway because both miR-150-5p and miR-150-3p markedly inhibited cancer cell migration and invasion (Figure 1D and 1E). Five genes (TNC, ITGA3, ITGA6, CAV2, and XIAP) were found to be regulated by both miR-150-5p and miR-150-3p in this pathway (Tables 5 and 6).
Table 3: Significantly enriched annotations regulated by miR-150-5p
Number of genes |
P-value |
Annotations |
|---|---|---|
33 |
7.22E-06 |
(KEGG) 05200: Pathways in cancer |
22 |
3.43E-06 |
(KEGG) 03013: RNA transport |
21 |
1.01E-05 |
(KEGG) 04141: Protein processing in endoplasmic reticulum |
20 |
1.04E-02 |
(KEGG) 04010: MAPK signaling pathway |
20 |
7.57E-06 |
(KEGG) 04120: Ubiquitin mediated proteolysis |
20 |
2.30E-06 |
(KEGG) 04110: Cell cycle |
18 |
3.57E-04 |
(KEGG) 00230: Purine metabolism |
17 |
5.42E-04 |
(KEGG) 04310: Wnt signaling pathway |
16 |
1.40E-02 |
(KEGG) 04510: Focal adhesion |
16 |
1.03E-05 |
(KEGG) 00240: Pyrimidine metabolism |
15 |
1.17E-03 |
(KEGG) 05162: Measles |
14 |
2.82E-02 |
(KEGG) 05016: Huntington’s disease |
14 |
4.34E-03 |
(KEGG) 04910: Insulin signaling pathway |
14 |
2.21E-03 |
(KEGG) 04722: Neurotrophin signaling pathway |
14 |
4.73E-05 |
(KEGG) 05222: Small cell lung cancer |
14 |
1.03E-05 |
(KEGG) 03008: Ribosome biogenesis in eukaryotes |
14 |
1.03E-05 |
(KEGG) 05220: Chronic myeloid leukemia |
13 |
4.22E-03 |
(KEGG) 03040: Spliceosome |
12 |
1.79E-02 |
(KEGG) 05160: Hepatitis C |
12 |
1.10E-03 |
(KEGG) 05215: Prostate cancer |
11 |
2.57E-02 |
(KEGG) 05145: Toxoplasmosis |
10 |
2.67E-02 |
(KEGG) 04660: T cell receptor signaling pathway |
10 |
8.29E-03 |
(KEGG) 04210: Apoptosis |
10 |
5.60E-03 |
(KEGG) 00564: Glycerophospholipid metabolism |
10 |
5.60E-03 |
(KEGG) 03015: mRNA surveillance pathway |
10 |
1.72E-04 |
(KEGG) 00510: N-Glycan biosynthesis |
9 |
2.15E-02 |
(KEGG) 04012: ErbB signaling pathway |
9 |
7.54E-03 |
(KEGG) 05212: Pancreatic cancer |
9 |
7.54E-03 |
(KEGG) 05211: Renal cell carcinoma |
9 |
5.90E-03 |
(KEGG) 04115: p53 signaling pathway |
9 |
5.90E-03 |
(KEGG) 04920: Adipocytokine signaling pathway |
9 |
5.40E-04 |
(KEGG) 04330: Notch signaling pathway |
8 |
2.68E-02 |
(KEGG) 04662: B cell receptor signaling pathway |
8 |
1.19E-02 |
(KEGG) 05214: Glioma |
8 |
1.01E-02 |
(KEGG) 04623: Cytosolic DNA-sensing pathway |
8 |
1.03E-04 |
(KEGG) 03020: RNA polymerase |
7 |
1.47E-02 |
(KEGG) 04150: mTOR signaling pathway |
7 |
5.77E-03 |
(KEGG) 03420: Nucleotide excision repair |
7 |
5.68E-03 |
(KEGG) 00970: Aminoacyl-tRNA biosynthesis |
6 |
4.91E-02 |
(KEGG) 05223: Non-small cell lung cancer |
6 |
2.93E-02 |
(KEGG) 00561: Glycerolipid metabolism |
6 |
1.95E-02 |
(KEGG) 05219: Bladder cancer |
6 |
1.63E-02 |
(KEGG) 03050: Proteasome |
6 |
9.83E-03 |
(KEGG) 04130: SNARE interactions in vesicular transport |
6 |
9.83E-03 |
(KEGG) 03030: DNA replication |
6 |
8.16E-03 |
(KEGG) 03410: Base excision repair |
5 |
1.27E-02 |
(KEGG) 00534: Glycosaminoglycan biosynthesis - heparan sulfate |
5 |
1.12E-02 |
(KEGG) 00563: Glycosylphosphatidylinositol(GPI)-anchor biosynthesis |
4 |
3.60E-02 |
(KEGG) 04320: Dorso-ventral axis formation |
4 |
3.12E-02 |
(KEGG) 00532: Glycosaminoglycan biosynthesis - chondroitin sulfate |
4 |
1.83E-02 |
(KEGG) 00670: One carbon pool by folate |
3 |
2.79E-02 |
(KEGG) 00740: Riboflavin metabolism |
Table 4: Significantly enriched annotations regulated by miR-150-3p
Number of genes |
P-value |
Annotations |
|---|---|---|
16 |
0.0024 |
(KEGG) 05200: Pathways in cancer |
10 |
0.0386 |
(KEGG) 04510: Focal adhesion |
8 |
0.0021 |
(KEGG) 04520: Adherens junction |
8 |
0.0036 |
(KEGG) 05222: Small cell lung cancer |
4 |
0.0349 |
(KEGG) 00020: Citrate cycle (TCA cycle) |
Table 5: Focal adhesion pathway regulated by miR-150-5p
Gene Symbol |
Gene Name |
conserved |
poorly conserved |
GEO9638 log2 ratio |
GSE82108 log2ratio |
|---|---|---|---|---|---|
TNC |
tenascin C |
0 |
3 |
1.416 |
−0.899 |
ITGA6 |
integrin, alpha 6 |
0 |
2 |
1.105 |
−0.052 |
VAV2 |
vav 2 guanine nucleotide exchange factor |
0 |
2 |
0.976 |
−0.169 |
SHC1 |
SHC (Src homology 2 domain containing) transforming protein 1 |
0 |
1 |
0.933 |
−0.804 |
VEGFA |
vascular endothelial growth factor A |
0 |
1 |
0.653 |
−0.265 |
GSK3B |
glycogen synthase kinase 3 beta |
1 |
0 |
0.606 |
−0.089 |
ITGA3 |
integrin, alpha 3 (antigen CD49C, alpha 3 subunit of VLA-3 receptor) |
0 |
9 |
0.583 |
−0.058 |
AKT2 |
v-akt murine thymoma viral oncogene homolog 2 |
0 |
2 |
0.533 |
−0.308 |
CAV2 |
caveolin 2 |
0 |
1 |
0.443 |
−0.914 |
ROCK1 |
Rho-associated, coiled-coil containing protein kinase 1 |
1 |
0 |
0.441 |
−0.226 |
GRB2 |
growth factor receptor-bound protein 2 |
0 |
2 |
0.382 |
−0.148 |
XIAP |
X-linked inhibitor of apoptosis |
0 |
3 |
0.341 |
−0.456 |
TNR |
tenascin R (restrictin, janusin) |
0 |
2 |
0.263 |
−0.285 |
TLN1 |
talin 1 |
0 |
3 |
0.165 |
−0.190 |
PIK3CB |
phosphoinositide-3-kinase, catalytic, beta polypeptide |
1 |
0 |
0.092 |
−0.068 |
CRK |
v-crk sarcoma virus CT10 oncogene homolog (avian) |
0 |
1 |
0.001 |
−0.069 |
Table 6: Focal adhesion pathway regulated by miR-150-3p
Gene Symbol |
Gene Name |
poorly conserved |
GSE9638 log2 ratio |
GSE82108 log2 ratio |
|---|---|---|---|---|
LAMC2 |
laminin, gamma 2 |
1 |
2.334 |
−0.8519 |
EGFR |
epidermal growth factor receptor |
1 |
1.835 |
−0.6698 |
TNC |
tenascin C |
1 |
1.416 |
−0.7192 |
ITGA6 |
integrin, alpha 6 |
1 |
1.105 |
−0.1906 |
IGF1R |
insulin-like growth factor 1 receptor |
1 |
0.611 |
−0.0533 |
PTK2 |
PTK2 protein tyrosine kinase 2 |
1 |
0.605 |
−0.4804 |
ITGA3 |
integrin, alpha 3 (antigen CD49C, alpha 3 subunit of VLA-3 receptor) |
1 |
0.583 |
−0.2200 |
CAV2 |
caveolin 2 |
1 |
0.443 |
−0.6686 |
XIAP |
X-linked inhibitor of apoptosis |
1 |
0.341 |
−0.0765 |
THBS1 |
thrombospondin 1 |
2 |
0.189 |
−0.1310 |
We next performed qRT-PCR analyses of 3 HNSCC cell lines to investigate whether restoration of miR-150-5p or miR-150-3p expression altered the mRNA expression of these 5 genes. The mRNA expression levels of these 5 candidate genes are shown in Figure 3A and Supplementary Figure 3A. Among 5 genes, we focused on ITGA3, ITGA6, and TNC genes because aberrant integrin-mediated signalling promoted cancer cell aggressiveness according to our previous studies [21, 22, 26]. Moreover, two genes CAV and XIAP have been involved in cancer pathogenesis including HNSCC by past studies [27–30]. The analysis of the expression control of these two genes by miRNAs is important theme.
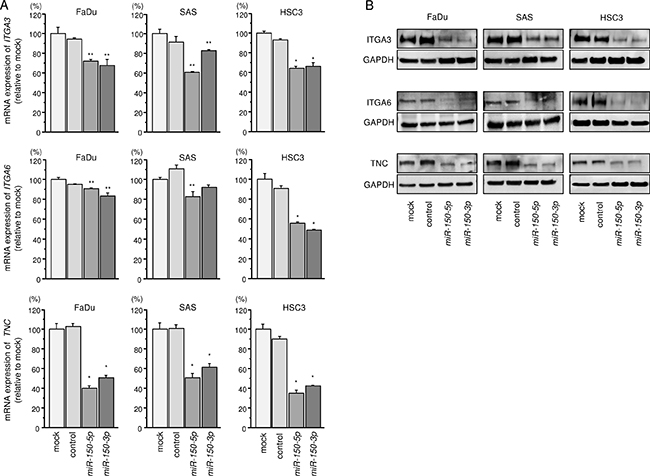
Figure 3: Regulation of target gene expression by miR-150-5p and miR-150-3p in HNSCC cell lines. (A) Expression levels of ITGA3, ITGA6, and TNC mRNAs 72 h after transfection with 10 nM miR-150-5p or miR-150-3p into cell lines. GUSB was used as an internal control. *P < 0.0001, **P < 0.008. (B) Protein expression of ITGA3, ITGA6, and TNC 72 h after transfection with miR-150-5p or miR-150-3p. GAPDH was used as a loading control.
Regulation of ITGA3, ITGA6, and TNC expression by miR-150-5p and miR-150-3p in HNSCC clinical specimens and HNSCC cells
Next, we investigated the mRNA expression levels of ITGA3, ITGA6, and TNC in 22 HNSCC clinical specimens by qRT-PCR. ITGA3, ITGA6, and TNC were significantly upregulated in HNSCC tissues (P = 0.0004, P = 0.0023, and P = 0.0063, respectively; Figure 2B). Spearman’s rank tests showed a negative correlation between the expression levels of these 3 genes and miR-150-5p (P = 0.001, P = 0.0029, and P = 0.0004, respectively; R = –0.503, R = −0.455, and R = −0.542, respectively; Figure 2C) and between the expression of these 3 genes and miR-150-3p (P = 0.0081, P = 0.0185, and P = 0.0068, respectively; R = –0.404, R = -0.359, and R = −0.413, respectively; Figure 2D).
Next, we investigated whether ITGA3, ITGA6, and TNC expression was reduced by restoration of miR-150-5p and miR-150-3p in HNSCC cells. Expression levels of these 3 genes were markedly repressed in miR-150-5p and miR-150-3p transfectant cells compared with that in mock-transfected cells (Figure 3A and 3B).
The synergistic effects of miR-150-5p and miR-150-3p were evaluated the mRNA expression levels of ITGA3, ITGA6, and TNC with co-transfection of miR-150-5p and miR-150-3p in FaDu cells. However, no synergistic effects were observed (Supplementary Figure 3B).
Immunohistochemical detection of ITGA3, ITGA6 and TNC in HNSCC clinical specimens
We also examined the expression levels of ITGA3, ITGA6 and TNC in HNSCC clinical specimens by immunohistochemical staining. ITGA3 and ITGA6 were strongly expressed in several cancer tissues (Figure 4). TNC was moderately expressed in cancer lesions (Figure 4). While low expression was observed in noncancerous regions (Figure 4).
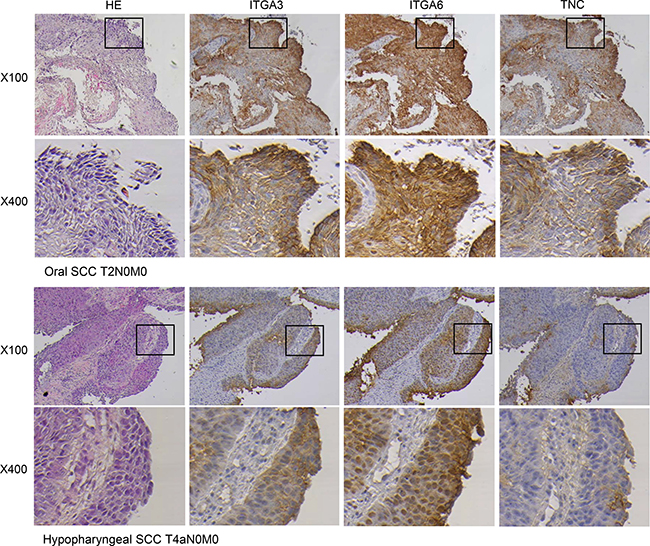
Figure 4: Immunohistochemical staining of ITGA3, ITGA6 and TNC in clinical specimens of HNSCC. ITGA3 and ITGA6 were strongly expressed in cancer lesions, while TNC was moderately expressed in cancer lesions. (100× and 400× magnification field).
Effects of ITGA3, ITGA6, and TNC knockdown on cell proliferation, migration, and invasion in FaDu cells
To investigate the oncogenic functional of ITGA3, ITGA6, and TNC in FaDu cells, we applied to loss-of-function assays using siRNAs. First, we evaluated the knockdown efficiency of si-ITGA3, si-ITGA6, and si-TNC transfection in FaDu cells. Knockdown efficiencies of siRNAs, si-ITGA3, si-ITGA6, and si-TNC were shown in Figure 5A and 5B.
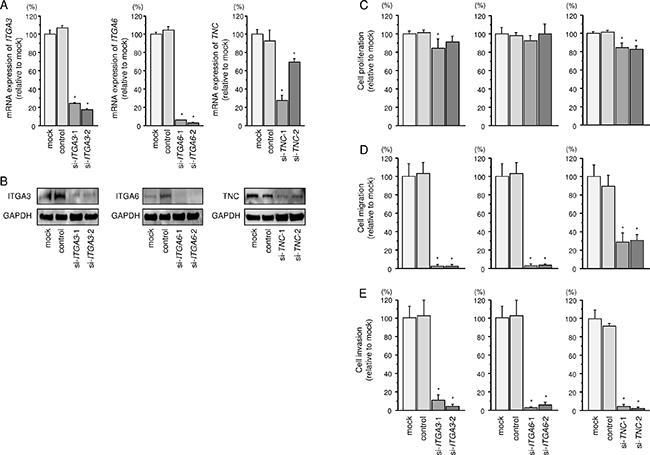
Figure 5: Effects of ITGA3, ITGA6, and TNC silencing by siRNA transfection in FaDu cells. (A) ITGA3, ITGA6, and TNC mRNA expression 72 h after transfection with 10 nM siRNA into FaDu cells. GUSB was used as an internal control.*P < 0.0001. (B) ITGA3, ITGA6, and TNC protein expression 72 h after transfection with siRNA. GAPDH was used as a loading control. (C) Cell proliferation was determined by XTT assay 72 h after transfection with siRNA. *P < 0.001. (D) Cell movement was assessed by migration assay 48 h after transfection with siRNA. *P < 0.0001. (E) Cell invasion was characterised by invasion assay 48 h after transfection with siRNA. *P < 0.0001.
Cancer cells proliferations were significantly reduced in si-ITGA3-1 and si-TNC transfectants in comparison with that in mock-transfected FaDu cells (Figure 5C). In contrast, proliferation was not inhibited in FaDu cells transfected with si-ITGA3-2 and si-ITGA6. Migration activities were significantly suppressed in si-ITGA3, si-ITGA6, and si-TNC transfectants in comparison with that in mock-transfected FaDu cells (Figure 5D). As like as migration assays, invasion activity was significantly inhibited in si-ITGA3, si-ITGA6, and si-TNC transfectants in comparison with that in mock-transfected FaDu cells (Figure 5E).
Clinical significance of ITGA3, ITGA6, and TNC expression in HNSCC
To investigate the clinical significance of ITGA3, ITGA6, and TNC in HNSCC, we analysed their associations with tumor stage and lymph node stage using the TCGA-PRAD database. The mRNA expression levels of ITGA3, ITGA6, and TNC were significantly upregulated in HNSCC clinical samples (Figure 6A).
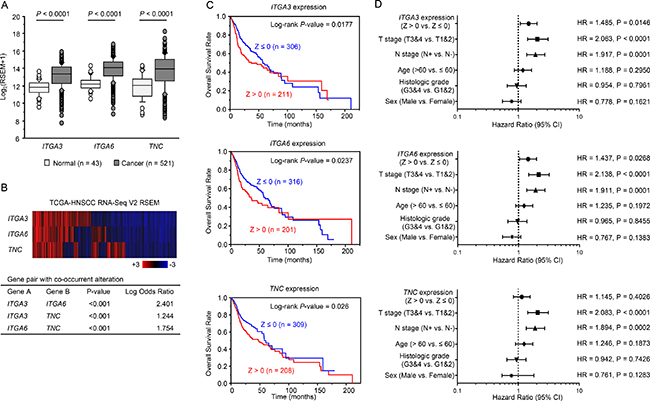
Figure 6: Clinical significance of three genes and miR-150-5p and miR-150-3p expression in HNSCC based on data from the TCGA database. (A) Comparison of ITGA3, ITGA6, and TNC mRNA expression levels between normal and tumor samples in TCGA database. (B) Heatmap visualization of gene expression based on TCGA-HNSCC RNA Seq data (Upper). All gene pairs among three genes expression pattern (mRNA Z-score > 0) showed significant co-occurrence by Fisher’s exact test (Lower). (C) Clinical outcomes in patients with altered miR-150-5p and miR-150-3p expression (CNV: amplification or gain, or mRNA: Z-score > 0) or without altered miRNA expression (CNV: diploid or het loss, and mRNA: Z-score ≤ 0), as displayed using Kaplan–Meier plots with log-rank tests. (D) Forest plot summarising hazard ratios. The X-axis displays the hazard ratio and 95% CI of each subgroup.
Heatmap visualization of gene expression showed all gene pairs among three genes expression pattern (mRNA Z-score > 0) show significant co-occurrence (Figure 6B).
Next, to examine whether the expression levels of these genes predicted overall survival, patients were divided into two groups: Z-score > 0 and Z-score ≤ 0. Higher ITGA3, ITGA6, and TNC expression levels were associated with shorter overall survival (P = 0.0177, P = 0.0237, P = 0.026, respectively; Figure 6C). Details of mRNA expression z-scores are described in Figure 7A. The distributions of ITGA3, ITGA6, and TNC genomic copy number variations are shown in Figure 7B and 7C.
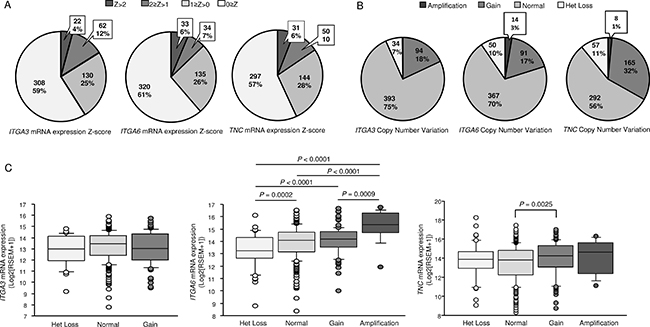
Figure 7: (A, B) Distributions of ITGA3, ITGA6, and TNC mRNA Z-scores (n = 522) and genomic copy number variations (n = 522) in HNSCC, as determined using data from TCGA. (C) Box-and-whisker plots of ITGA3, ITGA6, and TNC mRNA expression with respect to genomic copy number.
Multivariate Cox proportional hazards models were used to assess independent predictors of progression-free survival, including expression level of the gene (Z score > 0 versus Z score ≤ 0), tumor stage (T3 and T4 versus T1 and T2), lymph node stage (N+ versus N-), age at diagnosis (> 60 years versus ≤ 60 years), histologic grade (G3 and G4 versus G1 and G2), and sex (male versus female). High ITGA3 expression was a significant prognostic factor in patients with HNSCC (hazard ratio [HR] = 1.485, 95% confidence interval [CI] = 1.082–2.035, P = 0.0146; Figure 6D). Likewise, high ITGA6 expression (HR = 1.437, 95% CI = 1.043–1.975, P = 0.0268) was a significant prognostic factor (Figure 6D). Furthermore, the expression of ITGA3, ITGA6 and TNC genes were significantly higher in the T3 and T4 group than in the T1 and T2 group (HR = 2.063, HR = 2.133, HR = 2.083, respectively; P < 0.0001; Figure 6D).
From the data of the TCGA database, the expression level of miR-150-5p and miR-150-3p were extracted for each TNM stage and T stage. The expression level of miR-150-5p and miR-150-3p was significantly decreased in advanced cases. The expression level of miR-150-5p and miR-150-3p were significantly decreased in advanced T stage cases (Figure 8).
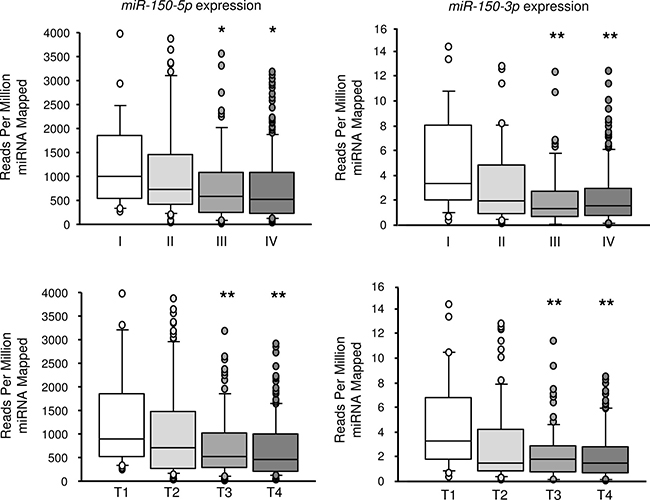
Figure 8: Expression of miR-150-5p and miR-150-3p according to TNM stage and T stage (compared with T1 or stage I). From the data of the TCGA database, the expression level of miR-150-5p and miR-150-3p was significantly decreased in advanced cases and advanced T stage cases. *P < 0.05, **P < 0.01.
DISCUSSION
The control of intercellular protein-coding/noncoding RNA expression is tightly regulated by miRNA [6]. Therefore, dysregulation of miRNAs can profoundly impact normal cell physiology and enhance oncogenesis. Identification of oncogenic and antitumor miRNAs has led us to elucidate novel miRNA-mediated cancer networks. We have sequentially obtained the miRNA expression signatures of several types of cancers and used these signatures to identify antitumor miRNA-mediated cancer pathways [11–19, 31]. Deep sequencing technology can be used to illuminate the miRNA expression signatures of cancer cells. In this study, we created deep sequencing-based miRNA expression signatures using laryngeal and hypopharyngeal squamous cell carcinoma clinical specimens.
Our signature included several antitumor miRNAs (miR-375, miR-133a, and miR-1 etc.) that had been identified in human cancers in previous studies [32–40], suggesting that our present signature was effective for identification of novel oncogenic and antitumor miRNAs in HNSCC cells and may provide a benchmark for future studies of HNSCC. Interestingly, our present signature revealed that both strands of pre-miR-150, i.e., miR-150-5p and miR-150-3p were significantly downregulated in this signature. Our recent studies demonstrated that both strands of pre-miR-144 (miR-144-5p: guide strand and miR-144-3p: passenger strand) and pre-miR-145 (miR-145-5p: guide strand and miR-145-3p: passenger strand) inhibited cancer cell aggressiveness [41–43]. These findings suggested that passenger strand of miRNAs had antitumor function in several cancer cells. Therefore, we focused on miR-150-5p and miR-150-3p and investigated the antitumor functional of these miRNAs in HNSCC cells.
Our present data demonstrated that both miR-150-5p and miR-150-3p were significantly reduced in cancer tissues, and ectopic expression of each miRNA markedly inhibited cancer cell aggressiveness. These data indicated that both strands of miR-150-5p and miR-150-3p functioned as antitumor miRNAs in HNSCC cells. Past studies have reported the aberrant expression of miR-150-5p in various cancers, suggesting that this miRNA contributes significantly to cancer pathogenesis [44]. However, the expression status of miR-150-5p was varied according to cancer type, indicating that miR-150-5p was a multifunction molecule with both oncogenic and antitumor functions depending on the cancer type [44]. In contrast, the functional significance of miR-150-3p in human cancer is still unclear. Our present study is the first report demonstrating that miR-150-3p acts as an antitumor miRNA, similar to miR-150-5p, in HNSCC cells.
Molecular mechanism of silencing of miR-150-5p and miR-150-3p in HNSCC cells is still obscure. To investigate these miRNAs expression and DNA methylation, SAS cells were treated with the demethylating agent (5-aza-dC). Expression of miR-150-5p was significantly elevated after 5-aza-dC treatment (Supplementary Figure 4). On the other hand, expression of miR-150-3p was slightly upregulated by 5-aza-dC treatment (Supplementary Figure 4). These data suggested that DNA methylation might be contributed to silencing of miR-150-5p and miR-150-3p in HNSCC cells.
We also evaluated the roles of miR-150-5p and miR-150-3p in regulating genes and pathways in HNSCC cells. We hypothesised that miR-150-5p and miR-150-3p may coordinately regulate target genes associated with HNSCC pathogenesis. To identify miRNA-regulated targets and pathways, we applied in silico and gene expression analyses, as described in our previous studies [13–17, 41]. Here, we identified 5 putative candidate genes involved in the focal adhesion pathway (TNC, ITGA3, ITGA6, CAV2, and XIAP) that were regulated by both miR-150-5p and miR-150-3p in HNSCC cells. Among these genes, our previous studies demonstrated that ITGA3, ITGA6, and CAV2 were overexpressed in cancer tissues and associated with cancer cell migration and invasion [22, 26, 28]. Moreover, ITGA3, ITGA6, and CAV2 have been shown to be directly regulated by antitumor miRNAs, i.e., miR-223, miR-29s, and miR-218, respectively [22, 26, 28]. In this study, we focused on TNC and investigated its functional roles in HNSCC.
TNC is a multifunctional extracellular matrix (ECM) glycoprotein composed of several distinct domains [45]. Expression of TNC in adult tissue is restricted, except in the context of inflammation and tissue injury [45]. Cancer cells and corresponding stromal cells also exhibit TNC expression, and high expression of TNC has been reported in several cancers [45–47]. Overexpression of TNC induces ECM deposition, and aberrant activation of ECM-mediated signalling promotes cancer cell aggressiveness, and the epithelial-mesenchymal transition (EMT) [45–47]. Several studies have demonstrated that TNC binds directly to integrins, and TNC/integrin-mediated signalling contributes to embryonic development, tissue repair, and cancer pathogenesis [46, 48]. Our previous studies showed that overexpression of ITGA6/B4 and ITGA3/B1 was involved in cancer cell migration and invasion in HNSCC and prostate cancer [22, 26]. Moreover, a recent study showed that ITGA6 is a hypoxia-inducible factor (HIF)-dependent transcriptional target gene and that ITGA6 expression is an independent prognostic factor in patients with breast cancer [49].
Our large cohort study using TCGA datasets indicated that the expression levels of ITGA3, ITGA6, and TNC were upregulated in cancer tissues. Furthermore, Kaplan–Meier survival curves revealed that high expression of these genes predicted poorer survival in patients with HNSCC. Our functional study showed that silencing of ITGA3, ITGA6, and TNC inhibited HNSCC cell migration and invasion. Metastasis is responsible for most of the mortality in patients with HNSCC. Therefore, activation of TNC/integrin receptor-mediated signalling may be a putative target in cancer treatment.
In conclusion, downregulation of dual strands of pre-miR-150 (miR-150-5p and miR-150-3p) was detected by deep sequencing-based miRNA signature analysis. The antitumor functions of these miRNAs coordinately regulate focal adhesion pathway-related genes in HNSCC cells. The expression of ITGA3, ITGA6, and TNC is involved in HNSCC pathogenesis. Identification of novel cancer networks mediated by aberrantly expressed miRNAs and antitumor miRNAs may improve our understanding of HNSCC molecular pathogenesis. Our newly created deep sequencing-based miRNA signature provides a basis for further HNSCC research.
MATERIALS AND METHODS
Clinical HNSCC specimens, cell lines, and RNA extraction
A total of 22 clinical tissue specimens were collected from patients with HNSCC who underwent surgical resection at Chiba University Hospital between 2008 and 2014. Clinicopathological features of patients with HNSCC are summarised in Table 1. All patients in this study provided informed consent, and the study protocol was approved by the Institutional Review Board of Chiba University.
Three human HNSCC cell lines, i.e., FaDu, SAS and HSC3, were investigated in this study. All cell lines were obtained from RIKEN Cell Bank (Tsukuba, Ibaraki, Japan).
Total RNA, including miRNA, was isolated using TRIzol reagent (Invitrogen, Carlsbad, CA, USA).
Small RNA deep sequencing and data mining
To obtain the miRNA expression signature, we carried out high-throughput deep sequencing using Genome Analyzer IIx (Illumina, CA, USA) with 6 pairs of tumor and normal samples (Table 1). The procedures of small RNA sequencing and data mining were performed as described in our previous studies [16].
Quantitative real-time reverse transcription PCR (qRT-PCR)
PCR quantification was carried out essentially as previously described [14, 32, 38, 50]. To quantify the expression level of miRNAs, we utilised stem-loop qRT-PCR for miR-150-5p (assay ID: 000473; Applied Biosystems, Foster City, CA, USA) and miR-150-3p (assay ID: 002637; Applied Biosystems) following the manufacturer’s protocol. TaqMan probes and primers for ITGA3 (Hs01076873_m1; Applied Biosystems), ITGA6 (Hs01041011_m1), TNC (assay ID: Hs01115665_m1), CAV2 (Hs00184597_m1), and XIAP (Hs00745222_s1) were assay-on-demand gene expression products. mRNA and miRNA data were normalised to human GUSB (assay ID: Hs99999908_m1; Applied Biosystems) and RNU48 (assay ID: 001006; Applied Biosystems), respectively.
Transfection of miRNA mimic and small interfering RNA (siRNA) into HNSCC cells
HNSCC cells were transfected with miRNA mimics for gain-of-function experiments and siRNAs for loss-of-function experiments. Pre-miR miRNA precursors (miR-150-5p, P/N: PM10070; miR-150-3p, P/N: PM12324; and negative control miR, P/N: AM17111; Applied Biosystems) were used in these assays. The following siRNAs were used in this study: stealth select RNAi siRNA, siITGA3 (P/N: HSS105531 and HSS179967; Invitrogen), siITGA6 (P/N: HSS179958 and HSS179959), and siTNC (P/N: HSS105145 and HSS105147). For transfection, RNAs were incubated with OPTI-MEM (Invitrogen) and Lipofectamine RNAiMax reagent (Invitrogen), as previously described [14, 32, 38, 50].
Cell proliferation, migration, and invasion assays
Cell proliferation, migration and invasion assays were described previously [14, 32, 38, 50].
Incorporation of miR-150-5p or miR-150-3p into RISC by Ago2 immunoprecipitation
SAS cells were transfected with 10nM miRNA by Reverse transfection. After 48h, immunoprecipitation was performed using a microRNA isolation kit, Human Ago2 (Wako, Osaka, Japan) according to the manufacturer’s protocol. Expression levels of miR-150-5p or miR-150-3p were measured by RT-qPCR methods. Detection of miRNA data were normalized to the expression of miR-26a (assay ID: 000404; Applied Biosystems), which was not affected by miR-150-5p and miR-150-3p.
Identification of putative genes regulated by miR-150-5p and miR-150-3p in HNSCC cells
Specific genes regulated by miR-150-5p and miR-150-3p were identified by a combination of in silico and genome-wide gene expression analyses. Genes regulated by miR-150-5p and miR-150-3p were listed using the TargetScan database. Oligo microarray (Agilent Technologies; Human GE 60K) was used for gene expression analysis. The microarray data were deposited into GEO (http://www.ncbi.nlm.nih.gov/geo/), with accession number GSE82108. Upregulated genes in HNSCC were obtained from publicly available data sets in GEO (accession number: GSE9638). To identify signalling pathways regulated in silico, gene expression data were analysed using the KEGG pathway categories with the GeneCodis program.
Immunohistochemistry
The formalin-fixed paraffin-embedded (FFPE) tissues were used. The patients’ backgrounds and clinicopathological characteristics are summarized in Table 1. Tissue sections were incubated overnight at 4°C with anti-ITGA3 antibodies diluted 1:100 (HPA008572; Sigma-Aldrich), anti-ITGA6 antibodies diluted 1:100 (HPA012696; Sigma-Aldrich) and anti-ITGA3 antibodies diluted 1:50 (#SC-20932; Santa Cruz Biotechnology). The procedure for immunohistochemistry was described previously [26, 32].
Western blotting
Immunoblotting was performed with rabbit anti-ITGA3 antibodies (1:250 dilution, HPA008572; Sigma-Aldrich, St. Louis, MO, USA), anti-ITGA6 antibodies (1:500 dilution, HPA012696; Sigma-Aldrich), and anti-TNC antibodies (1:400 dilution, #sc-20932; Santa Cruz Biotechnology, Dallas, TX, USA); anti-glyceraldehyde-3-phosphate dehydrogenase (GAPDH) antibodies (1:1000 dilution, ab8245; Abcam, Cambridge, UK) were used as an internal control. The procedures were described in our previous studies [14, 32, 38, 50].
The cancer genome atlas (TCGA) database analysis of HNSCC specimens
The clinical significance of ITGA3, ITGA6, and TNC in HNSCC was assessed by RNA sequencing and by using a putative copy number variation (CNV) database (predicted by the GISTIC algorithm) in HNSCC-TCGA (http://cancergenome.nih.gov). The genomic and clinical data were retrieved from cBioportal (http://www.cbioportal.org/) [51] or UCSC Cancer Browser (https://genome-cancer.ucsc.edu/proj/site/hgHeatmap/) [52], which were downloaded on June 17, 2016. Specimens with alterations in ITGA3, ITGA6, and TNC and specimens without alterations were analysed by Kaplan–Meier survival curves and log-rank statistics. Heatmap of gene expression was generated by cBioportal. The P-values and log odds ratio of co-occurrence are determined by Fisher’s exact test. Detail information on the method is described in previous paper [51].
Statistical analysis
Relationships between expression values in 2 conditions or variables were analysed using the Mann-Whitney U test or Bonferroni-adjusted Mann-Whitney U test. Spearman’s rank test was used to evaluate the correlations between the expression of miR-150-5p or miR-150-3p and target genes. We used Expert StatView software (version 5.0 SAS Institute Inc., Cary, NC, USA) for these analyses.
ACKNOWLEDGMENTS AND FUNDING
This study was supported by the KAKENHI (C), 16K20229, 15K10800, 15K10801, 25462676, and 26462596.
CONFLICTS OF INTEREST
The authors declare no conflicts of interest.
REFERENCES
1. Kulasinghe A, Perry C, Jovanovic L, Nelson C, Punyadeera C. Circulating tumour cells in metastatic head and neck cancers. Int J Cancer. 2015; 136:2515–2523.
2. Bonner JA, Harari PM, Giralt J, Cohen RB, Jones CU, Sur RK, Raben D, Baselga J, Spencer SA, Zhu J, Youssoufian H, Rowinsky EK, Ang KK. Radiotherapy plus cetuximab for locoregionally advanced head and neck cancer: 5-year survival data from a phase 3 randomised trial, and relation between cetuximab-induced rash and survival. Lancet Oncol. 2010; 11:21–28.
3. Siegel RL, Miller KD, Jemal A. Cancer statistics, 2016. CA Cancer J Clin. 2016; 66:7–30.
4. Leemans CR, Braakhuis BJ, Brakenhoff RH. The molecular biology of head and neck cancer. Nature reviews Cancer. 2011; 11:9–22.
5. Chan JY, Wei WI. Current management strategy of hypopharyngeal carcinoma. Auris Nasus Larynx. 2013; 40:2–6.
6. Bartel DP. MicroRNAs: genomics, biogenesis, mechanism, and function. Cell. 2004; 116:281–297.
7. Sethi N, Wright A, Wood H, Rabbitts P. MicroRNAs and head and neck cancer: reviewing the first decade of research. Eur J Cancer. 2014; 50:2619–2635.
8. Wiemer EA. The role of microRNAs in cancer: no small matter. Eur J Cancer. 2007; 43:1529–1544.
9. Friedman RC, Farh KK, Burge CB, Bartel DP. Most mammalian mRNAs are conserved targets of microRNAs. Genome research. 2009; 19:92–105.
10. Garzon R, Marcucci G, Croce CM. Targeting microRNAs in cancer: rationale, strategies and challenges. Nature reviews Drug discovery. 2010; 9:775–789.
11. Kikkawa N, Hanazawa T, Fujimura L, Nohata N, Suzuki H, Chazono H, Sakurai D, Horiguchi S, Okamoto Y, Seki N. miR-489 is a tumour-suppressive miRNA target PTPN11 in hypopharyngeal squamous cell carcinoma (HSCC). Br J Cancer. 2010; 103:877–884.
12. Nohata N, Hanazawa T, Kikkawa N, Sakurai D, Fujimura L, Chiyomaru T, Kawakami K, Yoshino H, Enokida H, Nakagawa M, Katayama A, Harabuchi Y, Okamoto Y, et al. Tumour suppressive microRNA-874 regulates novel cancer networks in maxillary sinus squamous cell carcinoma. Br J Cancer. 2011; 105:833–841.
13. Fukumoto I, Kinoshita T, Hanazawa T, Kikkawa N, Chiyomaru T, Enokida H, Yamamoto N, Goto Y, Nishikawa R, Nakagawa M, Okamoto Y, Seki N. Identification of tumour suppressive microRNA-451a in hypopharyngeal squamous cell carcinoma based on microRNA expression signature. Br J Cancer. 2014; 111:386–394.
14. Fukumoto I, Hanazawa T, Kinoshita T, Kikkawa N, Koshizuka K, Goto Y, Nishikawa R, Chiyomaru T, Enokida H, Nakagawa M, Okamoto Y, Seki N. MicroRNA expression signature of oral squamous cell carcinoma: functional role of microRNA-26a/b in the modulation of novel cancer pathways. Br J Cancer. 2015; 112:891–900.
15. Goto Y, Kojima S, Nishikawa R, Kurozumi A, Kato M, Enokida H, Matsushita R, Yamazaki K, Ishida Y, Nakagawa M, Naya Y, Ichikawa T, Seki N. MicroRNA expression signature of castration-resistant prostate cancer: the microRNA-221/222 cluster functions as a tumour suppressor and disease progression marker. Br J Cancer. 2015; 113:1055–1065.
16. Itesako T, Seki N, Yoshino H, Chiyomaru T, Yamasaki T, Hidaka H, Yonezawa T, Nohata N, Kinoshita T, Nakagawa M, Enokida H. The microRNA expression signature of bladder cancer by deep sequencing: the functional significance of the miR-195/497 cluster. PLoS One. 2014; 9:e84311.
17. Goto Y, Kurozumi A, Nohata N, Kojima S, Matsushita R, Yoshino H, Yamazaki K, Ishida Y, Ichikawa T, Naya Y, Seki N. The microRNA signature of patients with sunitinib failure: regulation of UHRF1 pathways by microRNA-101 in renal cell carcinoma. Oncotarget. 2016; 7:59070–59086. doi: 10.18632/oncotarget.10887.
18. Hidaka H, Seki N, Yoshino H, Yamasaki T, Yamada Y, Nohata N, Fuse M, Nakagawa M, Enokida H. Tumor suppressive microRNA-1285 regulates novel molecular targets: aberrant expression and functional significance in renal cell carcinoma. Oncotarget. 2012; 3:44–57. doi: 10.18632/oncotarget.417.
19. Fuse M, Kojima S, Enokida H, Chiyomaru T, Yoshino H, Nohata N, Kinoshita T, Sakamoto S, Naya Y, Nakagawa M, Ichikawa T, Seki N. Tumor suppressive microRNAs (miR-222 and miR-31) regulate molecular pathways based on microRNA expression signature in prostate cancer. J Hum Genet. 2012; 57:691–699.
20. Fukumoto I, Kikkawa N, Matsushita R, Kato M, Kurozumi A, Nishikawa R, Goto Y, Koshizuka K, Hanazawa T, Enokida H, Nakagawa M, Okamoto Y, Seki N. Tumor-suppressive microRNAs (miR-26a/b, miR-29a/b/c and miR-218) concertedly suppressed metastasis-promoting LOXL2 in head and neck squamous cell carcinoma. J Hum Genet. 2016; 61:109–118.
21. Kinoshita T, Hanazawa T, Nohata N, Kikkawa N, Enokida H, Yoshino H, Yamasaki T, Hidaka H, Nakagawa M, Okamoto Y, Seki N. Tumor suppressive microRNA-218 inhibits cancer cell migration and invasion through targeting laminin-332 in head and neck squamous cell carcinoma. Oncotarget. 2012; 3:1386–1400. doi: 10.18632/oncotarget.709.
22. Kinoshita T, Nohata N, Hanazawa T, Kikkawa N, Yamamoto N, Yoshino H, Itesako T, Enokida H, Nakagawa M, Okamoto Y, Seki N. Tumour-suppressive microRNA-29s inhibit cancer cell migration and invasion by targeting laminin-integrin signalling in head and neck squamous cell carcinoma. Br J Cancer. 2013; 109:2636–2645.
23. Chendrimada TP, Gregory RI, Kumaraswamy E, Norman J, Cooch N, Nishikura K, Shiekhattar R. TRBP recruits the Dicer complex to Ago2 for microRNA processing and gene silencing. Nature. 2005; 436:740–744.
24. Bartel DP. MicroRNAs: target recognition and regulatory functions. Cell. 2009; 136:215–233.
25. Hutvagner G, Zamore PD. A microRNA in a multiple-turnover RNAi enzyme complex. Science (New York, NY). 2002; 297:2056–2060.
26. Kurozumi A, Goto Y, Matsushita R, Fukumoto I, Kato M, Nishikawa R, Sakamoto S, Enokida H, Nakagawa M, Ichikawa T, Seki N. Tumor-suppressive microRNA-223 inhibits cancer cell migration and invasion by targeting ITGA3/ITGB1 signaling in prostate cancer. Cancer Sci. 2016; 107:84–94.
27. Ando T, Ishiguro H, Kimura M, Mitsui A, Mori Y, Sugito N, Tomoda K, Mori R, Harada K, Katada T, Ogawa R, Fujii Y, Kuwabara Y. The overexpression of caveolin-1 and caveolin-2 correlates with a poor prognosis and tumor progression in esophageal squamous cell carcinoma. Oncol Rep. 2007; 18:601–609.
28. Yamasaki T, Seki N, Yoshino H, Itesako T, Hidaka H, Yamada Y, Tatarano S, Yonezawa T, Kinoshita T, Nakagawa M, Enokida H. MicroRNA-218 inhibits cell migration and invasion in renal cell carcinoma through targeting caveolin-2 involved in focal adhesion pathway. J Urol. 2013; 190:1059–1068.
29. Yang XH, Feng ZE, Yan M, Hanada S, Zuo H, Yang CZ, Han ZG, Guo W, Chen WT, Zhang P. XIAP is a predictor of cisplatin-based chemotherapy response and prognosis for patients with advanced head and neck cancer. PLoS One. 2012; 7:e31601.
30. Kashkar H. X-linked inhibitor of apoptosis: a chemoresistance factor or a hollow promise. Clin Cancer Res. 2010; 16:4496–4502.
31. Koshizuka K, Hanazawa T, Fukumoto I, Kikkawa N, Okamoto Y, Seki N. The microRNA signatures: aberrantly expressed microRNAs in head and neck squamous cell carcinoma. J Hum Genet. 2017; 62:3–13.
32. Koshizuka K, Hanazawa T, Fukumoto I, Kikkawa N, Matsushita R, Mataki H, Mizuno K, Okamoto Y, Seki N. Dual-receptor (EGFR and c-MET) inhibition by tumor-suppressive miR-1 and miR-206 in head and neck squamous cell carcinoma. J Hum Genet. 2017; 62:113–121.
33. Kinoshita T, Hanazawa T, Nohata N, Okamoto Y, Seki N. The functional significance of microRNA-375 in human squamous cell carcinoma: aberrant expression and effects on cancer pathways. J Hum Genet. 2012; 57:556–563.
34. Kinoshita T, Nohata N, Fuse M, Hanazawa T, Kikkawa N, Fujimura L, Watanabe-Takano H, Yamada Y, Yoshino H, Enokida H, Nakagawa M, Okamoto Y, Seki N. Tumor suppressive microRNA-133a regulates novel targets: moesin contributes to cancer cell proliferation and invasion in head and neck squamous cell carcinoma. Biochem Biophys Res Commun. 2012; 418:378–383.
35. Kinoshita T, Nohata N, Yoshino H, Hanazawa T, Kikkawa N, Fujimura L, Chiyomaru T, Kawakami K, Enokida H, Nakagawa M, Okamoto Y, Seki N. Tumor suppressive microRNA-375 regulates lactate dehydrogenase B in maxillary sinus squamous cell carcinoma. Int J Oncol. 2012; 40:185–193.
36. Nohata N, Hanazawa T, Kikkawa N, Sakurai D, Sasaki K, Chiyomaru T, Kawakami K, Yoshino H, Enokida H, Nakagawa M, Okamoto Y, Seki N. Identification of novel molecular targets regulated by tumor suppressive miR-1/miR-133a in maxillary sinus squamous cell carcinoma. Int J Oncol. 2011; 39:1099–1107.
37. Nohata N, Hanazawa T, Kikkawa N, Mutallip M, Sakurai D, Fujimura L, Kawakami K, Chiyomaru T, Yoshino H, Enokida H, Nakagawa M, Okamoto Y, Seki N. Tumor suppressive microRNA-375 regulates oncogene AEG-1/MTDH in head and neck squamous cell carcinoma (HNSCC). J Hum Genet. 2011; 56:595–601.
38. Nohata N, Sone Y, Hanazawa T, Fuse M, Kikkawa N, Yoshino H, Chiyomaru T, Kawakami K, Enokida H, Nakagawa M, Shozu M, Okamoto Y, Seki N. miR-1 as a tumor suppressive microRNA targeting TAGLN2 in head and neck squamous cell carcinoma. Oncotarget. 2011; 2:29–42. doi: 10.18632/oncotarget.213.
39. Nohata N, Hanazawa T, Kikkawa N, Mutallip M, Fujimura L, Yoshino H, Kawakami K, Chiyomaru T, Enokida H, Nakagawa M, Okamoto Y, Seki N. Caveolin-1 mediates tumor cell migration and invasion and its regulation by miR-133a in head and neck squamous cell carcinoma. Int J Oncol. 2011; 38:209–217.
40. Nohata N, Hanazawa T, Enokida H, Seki N. microRNA-1/133a and microRNA-206/133b clusters: dysregulation and functional roles in human cancers. Oncotarget. 2012; 3:9–21. doi: 10.18632/oncotarget.424.
41. Matsushita R, Yoshino H, Enokida H, Goto Y, Miyamoto K, Yonemori M, Inoguchi S, Nakagawa M, Seki N. Regulation of UHRF1 by dual-strand tumor-suppressor microRNA-145 (miR-145-5p and miR-145-3p): Inhibition of bladder cancer cell aggressiveness. Oncotarget. 2016; 7:28460–28487. doi: 10.18632/oncotarget.8668.
42. Mataki H, Seki N, Mizuno K, Nohata N, Kamikawaji K, Kumamoto T, Koshizuka K, Goto Y, Inoue H. Dual-strand tumor-suppressor microRNA-145 (miR-145-5p and miR-145-3p) coordinately targeted MTDH in lung squamous cell carcinoma. Oncotarget. 2016; 7:72084–72098. doi: 10.18632/oncotarget.12290.
43. Matsushita R, Seki N, Chiyomaru T, Inoguchi S, Ishihara T, Goto Y, Nishikawa R, Mataki H, Tatarano S, Itesako T, Nakagawa M, Enokida H. Tumour-suppressive microRNA-144-5p directly targets CCNE1/2 as potential prognostic markers in bladder cancer. Br J Cancer. 2015; 113:282–289.
44. Wang F, Ren X, Zhang X. Role of microRNA-150 in solid tumors. Oncol Lett. 2015; 10:11–16.
45. Lowy CM, Oskarsson T. Tenascin C in metastasis: A view from the invasive front. Cell adhesion & migration. 2015; 9:112–124.
46. Yoshida T, Akatsuka T, Imanaka-Yoshida K. Tenascin-C and integrins in cancer. Cell adhesion & migration. 2015; 9:96–104.
47. Berndt A, Richter P, Kosmehl H, Franz M. Tenascin-C and carcinoma cell invasion in oral and urinary bladder cancer. Cell adhesion & migration. 2015; 9:105–111.
48. Tucker RP, Chiquet-Ehrismann R. Tenascin-C: Its functions as an integrin ligand. The international journal of biochemistry and cell biology. 2015; 65:165–168.
49. Brooks DL, Schwab LP, Krutilina R, Parke DN, Sethuraman A, Hoogewijs D, Schorg A, Gotwald L, Fan M, Wenger RH, Seagroves TN. ITGA6 is directly regulated by hypoxia-inducible factors and enriches for cancer stem cell activity and invasion in metastatic breast cancer models. Molecular cancer. 2016; 15:26.
50. Goto Y, Kojima S, Nishikawa R, Enokida H, Chiyomaru T, Kinoshita T, Nakagawa M, Naya Y, Ichikawa T, Seki N. The microRNA-23b/27b/24-1 cluster is a disease progression marker and tumor suppressor in prostate cancer. Oncotarget. 2014; 5:7748–7759. doi: 10.18632/oncotarget.2294.
51. Gao J, Aksoy BA, Dogrusoz U, Dresdner G, Gross B, Sumer SO, Sun Y, Jacobsen A, Sinha R, Larsson E, Cerami E, Sander C, Schultz N. Integrative analysis of complex cancer genomics and clinical profiles using the cBioPortal. Science signaling. 2013; 6:pl1.
52. Goldman M, Craft B, Swatloski T, Cline M, Morozova O, Diekhans M, Haussler D, Zhu J. The UCSC Cancer Genomics Browser: update 2015. Nucleic acids research. 2015; 43:D812–817.