
Introduction
Alzheimer’s disease (AD) was a kind of diseases occurred in middle and old age [1], and was associated with some neurological symptoms and cognitive problems, including memory impairment, leading by neurodegeneration or synapse loss leading to and other cognitive problems [2]. Currently, there were a total of 6 million AD patients in China [3]. Clinically, late-onset AD (LOAD) is more common type of AD and the heritability for susceptibility to LOAD was predicted nearly 80% [4]. The etiology and pathogenesis for LOAD were still not clear, and study indicated that LOAD was influenced by interactions between genetic factors and environmental factors [5, 6]. So it is necessary to find and validate biomarkers for AD prevention, especially for LOAD.
Inflammation plays a main role in AD pathogenesis, and the inflammation irritants including damaged tissues and β-amyloid plaque [7]. Interleukin-16 (IL-16) is one type of gene, encoded pro- inflammatory cytokines [8]. Studies [9] indicated that IL-16 levels increased in AD patients, confirming that IL-16 may play an important role in the progression of AD [9]. The human IL-16 gene could encode pleiotropic cytokine, which was a modulator of T cell activation [10]. However, to date, just two previous studies [11- 12] were conducted on the association between IL-16 gene single nucleotide polymorphisms (SNPs) and AD risk, but just one study focused on the correlation of rs4072111, rs1131445 polymorphisms and LOAD risk [11]. There was growing evidence demonstrating the association of adiponectin (ANP) gene SNPs with circulating adiponectin levels. rs266729and rs1501299 were two common SNPs. Some studies [13, 14] have reported the association between ANP gene polymorphisms and some metabolic diseases, such as insulin resistance and type 2 diabetes, but just one study [15] have focused on the association between ANP gene polymorphisms and LOAD.
In consideration of the limited number of study on association between ANP and IL- 16 gene and LOAD, in this study, we aimed to investigate the impact of ANP and IL- 16 gene SNPs, additional gene- gene interaction and haplotype combination on LOAD risk.
Materials and methods
Participants
This is a case-control study. Participants are consecutively recruited between January 2009 and November 2014 from the Second Affiliated Hospital of Zhengzhou University. Clinical diagnosis of probable AD was made according to the revised criteria of National Institute of Neurological and Communicative Disorders and Stroke/ Alzheimer’s Disease and Related Disorders Association (NINCDS/ ADRDA) [16], participants with advanced, severe, progressive, or unstable infectious, metabolic, immunologic, endocrinological, hepatic, hematological, pulmonary, cardiovascular, gastrointestinal, and/or urological diseases are excluded (Figure 1). At last, a total of 430 LOAD patients are included in the study, controls are those who are free of AD and matched by sex, age and ethnic background, and control participants with family history of AD are excluded. The selection and exclusion details could be found in our previous study [17].
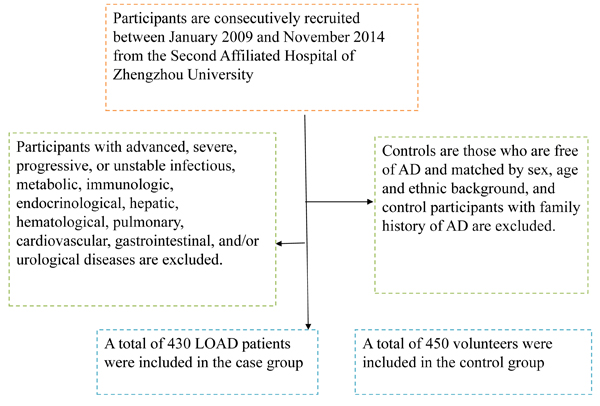
Figure 1: A flowchart on study population selection and exclusion.
Data collection
Data on demographic information, mini-mental state examination (MMSE), educational year, lifestyle risk factors, smoking and drinking status, prevalence of stroke, prevalence of diabetes and family history of AD for all participants are obtained using a questionnaire administered by trained staffs. Body weight, height and waist circumference (WC) are measured, and body mass index (BMI) are calculated. Blood samples are collected in the morning after at least 8 hours of fasting. All plasma and serum samples are frozen at -80°C until laboratory testing. Plasma glucose is measured using an oxidase enzymatic method. The concentrations of HDL cholesterol and triglycerides are assessed enzymatically using an automatic biochemistry analyzer (Hitachi Inc., Tokyo, Japan) and commercial reagents. Plasma ANP concentration was measured using Adiponectin ELISA kit (Shanghai Huzhen Biological Technology Co., Ltd. China).
Genomic DNA extraction and genotyping
SNPs within the ANP and IL-16 gene are selected according to the following methods: 1) SNPs, which have been reported associations with AD and were not been well studied; 2) SNPs, the minor allele frequency (MAF) of which were more than 5%. At last, two SNPs of ANP gene and two SNPs of IL- 16 gene are selected for genotyping in the study: rs266729, rs4072111, rs1501299 and rs1131445. Genomic DNA is extracted from EDTA-treated whole blood, using the DNA Blood Mini Kit (Qiagen, Hilden, Germany) according to the manufacturer’s instructions. Genotyping of these SNPs were performed using polymerase chain reaction and restriction fragment length polymorphism (PCR-RFLP) analysis. PCR primer sequences for each polymorphism are shown in Table 1. The PCR reactions were carried out in a final volume of 25 μl containing: 10 × PCR buffer, 4.5 mMMgCl2 (Roche, Germany), 0.4 mM of each dNTP (Fermentas, Germany), 10 pmol of each primer, 30 ng template DNA, 1 U Taq DNA polymerase (Roche, Germany) and sterile distilled water up to 25 μl. Amplification conditions started with an initial denaturation step of 5 min at 94 °C, followed by 35 cycles of 40 s denaturation (94 °C), 30 s annealing (56 °C) and 40 s extension (72 °C), ended by a final extension for 5min (72 °C).
Statistical analysis
The means and standard deviations were calculated for normally distributed continuous variables, and percentages were calculated for categorical variables. The categorical data were analyzed using χ2 test, and continuous variables were analyzed using Student’s t test. Hardy-Weinberg equilibrium (HWE), haplotype analysis and pairwise linkage disequilibrium (LD) analysis were investigated by using SNPStats (available online at http://bioinfo.iconcologia.net/SNPstats). Logistic regression was performed to investigate association between SNP and LOAD by dominant and co- dominant models. All reported P-values were two-tailed, and those less than 0.05 were considered statistically significant.
Generalized multifactor dimensionality reduction (GMDR) [18] was used to analysis the interaction among 4 SNPs, cross-validation consistency, the testing balanced accuracy, and the sign test, to assess each selected interaction were calculated. Permutation testing is also conducted to gain empirical P values of prediction accuracy as a benchmark based on 10,000 shuffles. The cross-validation consistency score is a measure of the degree of consistency with which the selected interaction is identified as the best model among all possibilities considered. Testing-balanced accuracy is a measure of the degree to which the interaction accurately predicts case-control status, and yields a score between 0.50 (indicating that the model predicts no better than chance) and 1.00 (indicating perfect prediction). Finally, the sign test, or permutation test (providing empirical P-values), for prediction accuracy can be used to measure the significance of an identified model.
Results
A total of 880 participants (514 males, 366 females) were selected, including 430 LOAD patients and 450 control subjects. The mean age of all participants was 81.7 ± 15.9 years old. The cases have the higher alcohol- drinking rate than controls. The means of FPG and TG were significantly higher in cases and controls, but the mean of HDL was lower in cases and controls. The mean of ANP concentrations was higher in controls than that in cases (Table 2).
Table 1: Description and primer sequences for 4 SNPs used for PCR analysis
SNP ID |
Chromosome |
Functional Consequence |
Major/ minor alleles |
Probe sequence |
ANP gene |
||||
rs266729 |
3:186841685 |
Upstream variant 2KB |
C/ G |
Forward: 5′- ACTTGCCCTGCCTCTGTCTG-3′ Reverse: 5′-CCTGGAGAACTGGAAGCTG-3′ |
rs1501299 |
3:186853334 |
Intron variant |
G/ T |
Forward: 5′- GGCTCAGGATGCTGTTGCTG-3′ Reverse: 5′-AGGGATGAGGGTGAAGATGGGA-3′ |
IL- 16 gene |
||||
rs1131445 |
15:81309441 |
Downstream variant 500B, utr variant 3 prime |
T/ C |
Forward: 5′-GAGATCATTCACTCATACATCTGG-3′ Reverse: 5′-TCATATACACGCTGGTTCCTTCTG-3′ |
rs4072111 |
15:81285798 |
Missense, nc transcript variant |
C/ T |
Forward: 5′-CACTGTGATCCCGGTCCAGTC-3′ Reverse: 5′-TTCAGGTACAAACCCAGCCAGC-3′ |
Table 2: General characteristics of 880 study participants in case and control group
Variables |
Case group (n=430) |
Normal group (n=450) |
p-values |
Age (year) |
81.4±16.1 |
82.3±15.7 |
0.401 |
Males, N (%) |
246 (57.2) |
268(59.6) |
0.480 |
Smoke, N (%) |
151 (35.1) |
145(32.2) |
0.364 |
Alcohol consumption, N (%) |
188 (43.7) |
160 (35.6) |
0.013 |
WC (cm) |
89.2±19.8 |
87.7±19.4 |
0.257 |
BMI (kg/m2) |
25.1±8.9 |
24.8±9.1 |
0.621 |
FPG (mmol/L) |
5.8±1.6 |
5.5±1.9 |
0.012 |
TG (mmol/L) |
1.4±0.8 |
1.3± 0.7 |
0.048 |
TC (mmol/L) |
4.6±0.8 |
4.5±0.9 |
0.082 |
HDL (mmol/L) |
1.21±0.65 |
1.34±0.63 |
0.002 |
Stroke |
16 (3.72) |
20 (4.44) |
0.255 |
MMSE (scores) |
15.16±5.51 |
29.12±4.97 |
<0.001 |
Diabetes |
36 (8.37) |
43(9.56) |
0.539 |
Educational year |
7.5±3.12 |
7.8±3.31 |
0.167 |
ANP (mg/L) |
3.65±1.06 |
5.62±1.23 |
<0.001 |
Note: Means± standard deviation for age, WC, BMI, FPG, TC, TG, HDL-C and ANP; Abbreviations: TC, total cholesterol; HDL, high density lipoprotein; FPG, fast plasma glucose; TG, triglyceride; WC, waist circumference; BMI, body mass index; MMSE, mini-mental state examination; ANP, Adiponectin. Those P- values less than 0.05 were considered statistically significant.
The frequencies for rs266729- G allele and rs1501299- T allele in ANP gene were significantly higher in LOAD cases than that in control group (30.4% vs19.4%, 32.6% vs19.9%), and T allele of rs4072111 in IL- 16 was significantly lower in LOAD cases than that in control group (19.9 % vs29.9%). Logistic regression analysis showed that LOAD risk was significantly higher in carriers with rs266729- G allele than those with CC genotype (CG+ GG versus CC), adjusted OR (95%CI) = 1.61 (1.26-1.96), and higher in carriers with rs1501299- T allele than those with GG genotype (GT+ TT versus GG), adjusted OR (95%CI) = 1.62 (1.32-2.12). In addition, we also found LOAD risk was also significantly lower in carriers with rs4072111- T allele than those with CC genotype (CT+ TT versus CC), adjusted OR (95%CI) = 0.65 (0.44-0.93). (Table 3)
Table 3: Genotype and allele frequencies of 4 SNPs between case and control group
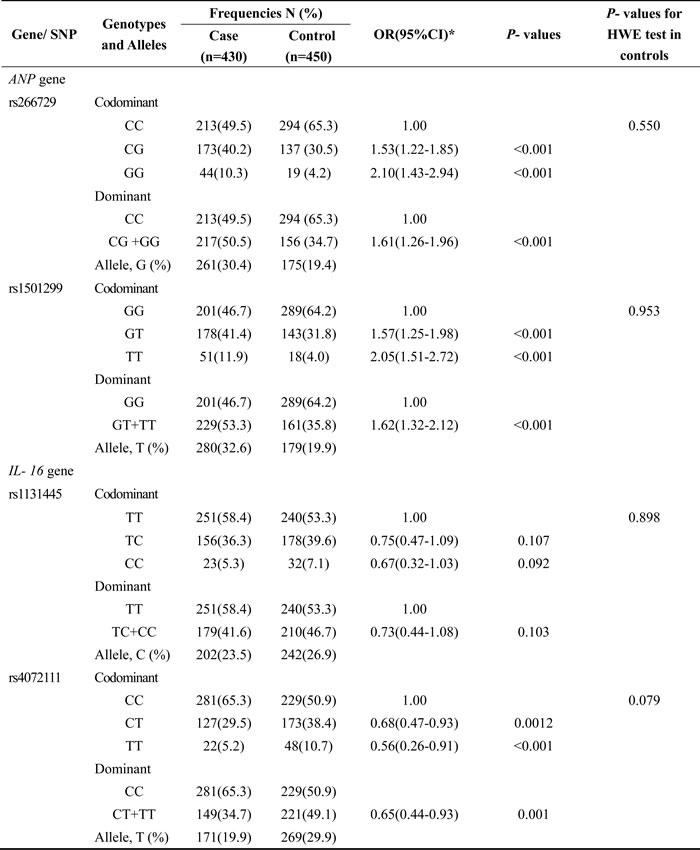
*Adjusted for gender, age, smoking and alcohol status, BMI, WC, FPG, TC, TG, HDL, educational year, prevalence of stroke, prevalence of diabetes. Those P- values less than 0.05 were considered statistically significant.
We investigate the impact of the interaction among 4 SNPs within ANP and IL- 16 gene on LOAD risk by using GMDR analysis. We found a significant two-locus model (p = 0.0100) involving rs266729 and rs4072111, and the cross-validation consistency of this model was 10/ 10, and the testing accuracy was 60.72% (Table 4). Participants with CG or GG of rs266729 and CC of rs4072111 genotype have the highest LOAD risk, compared to participants with CC of rs266729 and CT or TT of rs4072111 genotype, OR (95%CI) = 2.62(1.64 -3.58), after covariates adjustment for alcohol consumption status, FPG, TG and HDL (Table 5).
Table 4: Best gene–gene interaction models, as identified by GMDR
Locus no. |
Best combination |
Cross-validation consistency |
Testing accuracy |
p-values * |
2 |
rs266729 rs4072111 |
10/10 |
0.6072 |
0.0100 |
3 |
rs266729 rs4072111 rs1501299 |
9/10 |
0.5590 |
0.0547 |
4 |
rs266729 rs4072111 rs1501299 rs1131445 |
8/10 |
0.5399 |
0.3770 |
*Adjusted for gender, age, smoking and alcohol status, BMI, WC, FPG, TC, TG, HDL, educational year, prevalence of stroke, prevalence of diabetes. Those P- values less than 0.05 were considered statistically significant.
Table 5: Interaction analysis for rs266729 and rs4072111 by using logistic regression
rs266729 |
rs4072111 |
OR (95% CI)* |
P-values |
CC |
CT or TT |
1.00 |
- |
CG or GG |
CT or TT |
1.18 (1.04 -1.87) |
0.026 |
CC |
CC |
1.83 (1.48-2.69) |
<0.001 |
CG or GG |
CC |
2.62 (1.64 -3.58) |
<0.001 |
*Adjusted for gender, age, smoking and alcohol status, BMI, WC, FPG, TC, TG, HDL, educational year, prevalence of stroke, prevalence of diabetes. Those P- values less than 0.05 were considered statistically significant.
Pairwise LD analysis between SNPs was measured, and D′ value between rs266729 and rs1501299 was 0.826, D′ value between rs1131445 and rs4072111 was 0.861. Haplotype containing the rs266729- G and rs1501299- T alleles were associated with a statistically increased LOAD risk (OR = 1.83, 95%CI = 1.32- 2.43, P < 0.001) (Table 6), and haplotype containing the rs1131445- C and rs4072111- T alleles were associated with a statistically decreased LOAD risk (OR = 0.53, 95%CI = 0.18- 0.95, P = 0.012) (Table 7).
Table 6: Haplotype analysis on association between ANP gene and LOAD risk
Haplotypes |
rs266729 |
rs1501299 |
Frequencies |
OR(95%CI) |
p-values* |
|
Case group |
Control group |
|||||
H1 |
C |
G |
0.4601 |
0.5567 |
1.00 |
-- |
H2 |
G |
G |
0.2267 |
0.2131 |
1.13 (0.81– 1.62) |
0.592 |
H3 |
C |
T |
0.2135 |
0.1821 |
1.27 (0.90 - 1.74) |
0.602 |
H4 |
G |
T |
0.0997 |
0.0481 |
1.83 (1.32 – 2.43) |
<0.001 |
*Adjusted for gender, age, smoking and alcohol status, BMI, WC, FPG, TC, TG, HDL, educational year, prevalence of stroke, prevalence of diabetes.
Those P- values less than 0.05 were considered statistically significant.
Table 7: Haplotype analysis on association between IL- 16 and LOAD risk
Haplotypes |
rs1131445 |
rs4072111 |
Frequencies |
OR(95%CI) |
p-values* |
|
Case group |
Control group |
|||||
H1 |
T |
C |
0.5103 |
0.4367 |
1.00 |
-- |
H2 |
C |
C |
0.2624 |
0.2805 |
0.67 (0.35 – 1.02) |
0.091 |
H3 |
T |
T |
0.1926 |
0.2101 |
0.72 (0.49 - 1.06) |
0.328 |
H4 |
C |
T |
0.0347 |
0.0727 |
0.53 (0.18 – 0.95) |
0.012 |
*Adjusted for gender, age, smoking and alcohol status, BMI, WC, FPG, TC, TG, HDL, educational year, prevalence of stroke, prevalence of diabetes. Those P- values less than 0.05 were considered statistically significant.
Discussion
In the current study, we found that higher LOAD risks were significantly associated with rs266729- G allele and rs1501299- T allele than those with GG genotype. In addition, we also found that lower LOAD risk was associated with rs4072111- T allele. To date, the relationship between ANP gene polymorphism and LOAD risk was not well known, Li et al [15] firstly indicated that the susceptibility to LOAD was higher in carriers of the rs266729- G allele or carriers of the rs1501299- T allele. Previously, studies have involved in ANP gene polymorphisms and the others phenotypes. Studies have suggested that higher circulating ANP concentration was associated with lower AD risk [19, 20]. Recently, Tong et al [21] found that CC allele was associated with lower serum ANP concentrations, and GG genotype was associated with increased metabolic syndrome and insulin resistance risk [13, 22]. In terms of the correlation of LOAD risk with rs1501299, recent studies [14, 23, 24] also found that serum ANP concentrations were lower in carriers of TT allele.
In recent two studies [11, 12], IL- 16 gene was associated with LOAD risk. Khoshbakht et al [12] suggested that rs11556218 and rs4778889 polymorphisms within IL- 16 gene have a protective role in the development of sporadic AD in Iranian population. In the other study conducted by Anvar et al [11] suggested that the rs4072111 variation was associated with increased AD susceptibility in an Iranian population. Rosa et al [9] confirmed that IL-16 proteins may play an important role in progression of neurodegenerative disorders. Regarding to the relationship between rs4072111, rs1131445 and LOAD, the current study was the second study that concluded a positive association between the IL16- rs4072111 polymorphism and LOAD risk. However several studies [25- 27] have reported the association between IL- 16 gene polymorphism and risk of coronary heart disease (CHD) risk in different population. This relation many be another underlying mechanism for LOAD risk reduction by IL- 16 polymorphism, because CHD was also associated with AD risk factors, including obesity, metabolic syndrome, and insulin resistance.
In this study, LOAD risk is influenced by both ANP and IL- 16 gene, so it is interesting to investigate the impact of gene- gene interaction between the two genes on LOAD risk. In this study, GMDR model was used for interaction detection, because there were no dimensional constraints in this model. We found a significant gene- gene interaction between rs266729 and rs4072111. To our knowledge this is the first study for investigating impact of interaction between ANP and IL- 16 gene on LOAD risk in Chinese population. Previously, just two studies [17, 28] focused on the impact of gene- gene interaction on AD risk, which was conducted between APOE and PPAR -γ gene for Spain population and CYP2J2 and PPAR -γ gene for Chinese Han population. The results of this study suggest that ANP genetic variants may modify the influence of IL- 16 gene on AD risk. The underlying mechanisms for this interaction may due to that both SNP were associated with AD risk factors. We also conducted haplotype analysis in ANP gene and IL- 16 gene respectively. We found that haplotype containing the rs266729- G and rs1501299- T alleles in ANP gene were associated with a statistically increased LOAD risk, and haplotype containing the rs1131445- C and rs4072111- T alleles in IL- 16 gene were associated with a statistically decreased LOAD risk
The current study also has some limitations. Firstly, limited number of SNP in ANP and IL- 16 gene are included in current study, and in the future, more SNPs should be included in analysis. Secondly, gene- environment interaction should be investigated in the future studies, such as lifestyle, diet factors and so on. Thirdly, more detailed analysis should be conducted in other populations, for example, the gender and race difference of this relationship.
In conclusion, the results of current study indicated that LOAD risks are significantly higher in carriers with rs266729- G allele than those with CC genotype, and higher in carriers with rs1501299- T allele than those with GG genotype, and lower in carriers with rs4072111- T allele than those with CC genotype. We also found a significant gene- gene interaction between rs266729 and rs4072111, participants with CG or GG of rs266729 and CC of rs4072111 genotype have the highest LOAD risk, compared to participants with CC of rs266729 and CT or TT of rs4072111 genotype. And haplotype containing the rs266729- G and rs1501299- T alleles in ANP gene were associated with a statistically increased LOAD risk, and haplotype containing the rs1131445- C and rs4072111- T alleles in IL- 16 gene were associated with a statistically decreased LOAD risk
Acknowledgments
The writing of this paper is supported by the Second Affiliated Hospital of Zhengzhou University and PLA 148 Hospital. We thank all the partners and staffs who help us in the process of this study.
Conflicts of interest
There is no conflict of interest.
References
1. Heneka MT, O’Banion MK. Inammatory processes in Alzheimer’s disease. J Neuroimmunol. 2007; 184:69-91.
2. Song X, Mitnitski A, Zhang N, Chen W, Rockwood K, The Alzheimer’s Disease Neuroimaging Initiative. Dynamics of brain structure and cognitive function in the Alzheimer’s disease neuroimaging initiative. Journal of neurology, neurosurgery, and psychiatry. 2013; 84:71-8.
3. Yang G, Wang Y, Zeng Y, Gao GF, Liang X, Zhou M, Wan X, Yu S, Jiang Y, Naghavi M, Vos T, Wang H, Lopez AD, et al. Rapid health transition in China, 1990-2010: Findings from the Global Burden of Disease Study 2010. Lancet. 2013; 381:1987-2015.
4. Gatz M, Reynolds CA, Fratiglioni L, Johansson B, Mortimer JA, Berg S, Fiske A, Pedersen NL. Role of genes and environments for explaining Alzheimer disease. Arch Gen Psychiatry. 2006; 63:168-74.
5. Araria-Goumidi L, Lambert JC, Cottel D, Amouyel P, Chartier-Harlin MC. No association of the HLA-A2 allele with Alzheimer’s disease. Neurosci Lett. 2002; 335:75-8.
6. St George-Hyslop PH, Petit A. Molecular biology and genetics of Alzheimer’s disease. C R Biol. 2005; 328:119-30.
7. Xia MQ, Hyman BT. Chemokines/chemokine receptors in the central nervous system and Alzheimer’s disease. J Neurovirol. 1999; 5:32-41.
8. Bertram L, Tanzi RE. Alzheimer’s disease: one disorder, too many genes? Hum Mol Genet. 2004; 1:R135-41.
9. Di Rosa M, Dell’Ombra N, Zambito AM, Malaguarnera M, Nicoletti F, Malaguarnera L. Chitotriosidase and inammatory mediator levels in Alzheimer’s disease and cerebrovascular dementia. Eur J Neurosci. 2006; 23:2648-56.
10. Greig NH, Mattson MP, Perry T, Chan SL, Giordano T, Sambamurti K, Rogers JT, Ovadia H, Lahiri DK. New therapeutic strategies and drug candidates for neurodegenerative diseases: p53 and TNF-alpha inhibitors, and GLP-1 receptor agonists. Ann N Y Acad Sci. 2004; 1035:290-315.
11. Anvar NE, Saliminejad K, Ohadi M, Kamali K, Daneshmand P, Khorshid HR. Association between polymorphisms in Interleukin-16 gene and risk of late-onset Alzheimer’s disease. J Neurol Sci. 2015; 358:324-7.
12. Khoshbakht T, Soosanabadi M, Neishaboury M, Kamali K, Karimlou M, Bazazzadegan N, Khorram Khorshid HR. An Association Study on IL16 Gene Polymorphisms with the Risk of Sporadic Alzheimer’s Disease. Avicenna J Med Biotechnol. 2015; 7:128-32.
13. Lin CH, Ho CY, Liu CS, Lin WY, Li CI, Yang CW, Bau DT, Li TC, Lin CC. Influence of adiponectin gene polymorphisms on adiponectin serum level and insulin resistance index in taiwanese metabolic syndrome patients. Chin J Physiol. 2012; 55:405-411.
14. Ramya K, Ayyappa KA, Ghosh S, Mohan V, Radha V. Genetic association of ADIPOQ gene variants with type 2 diabetes, obesity and serum adiponectin levels in south Indian population. Gene. 2013; 532:253-262.
15. Li W, Yu Z, Hou D, Zhou L, Deng Y, Tian M, Feng X. Relationship between Adiponectin Gene Polymorphisms and Late-Onset Alzheimer’s Disease. PLoS ONE. 2015; 10: e0125186.
16. Dubois B, Feldman HH, Jacova C, Dekosky ST, Barberger-Gateau P, Cummings J, Delacourte A, Galasko D, Gauthier S, Jicha G, Meguro K, O’Brien J, Pasquier F, et al. Research criteria for the diagnosis of Alzheimer’s disease: revising the NINCDS-ADRDA criteria. Lancet Neurol. 2007; 6:734-746.
17. Geng S, Wang Y, Sun Y, Li J, Yin H, Zeng Z, Yang X, Zhang Y, Wang Y. Gene- gene Interaction between CYP2J2 and PPAR - gene on Late-Onset Alzheimer’s disease in the eastern Chinese Han Population. Behav Brain Res. 2016; 322:362-367.
18. Lou XY, Chen GB, Yan L, Ma JZ, Zhu J, Elston RC, Li MD. A generalized combinatorial approach for detecting gene-by gene and gene-by-environment interactions with application to nicotine dependence. Am J Hum Genet. 2007; 80:1125-1137.
19. Teixeira AL, Diniz BS, Campos AC, Miranda AS, Rocha NP, Talib LL, Gattaz WF, Forlenza OV. Decreased levels of circulating adiponectin in mild cognitive impairment and Alzheimer’s disease. Neuromolecular Med. 2013; 15:115-121.
20. Pákáski M, Fehér A, Juhász A, Drótos G, Fazekas OC, Kovács J, Janka Z, Kálmán J. Serum adipokine levels modified by donepezil treatment in Alzheimer’s disease. J Alzheimers Dis. 2014; 38:371-377.
21. Tong G, Wang N, Leng J, Tong X, Shen Y, Yang J, Ye X, Zhou L, Zhou Y. Common variants in adiponectin gene are associated with coronary artery disease and angiographical severity of coronary atherosclerosis in type 2 diabetes. Cardiovasc Diabetol. 2013; 12:67.
22. Zadjali F, Al-Yahyaee S, Hassan MO, Albarwani S, Bayoumi RA. Association of adiponectin promoter variants with traits and clusters of metabolic syndrome in Arabs: family-based study. Gene. 2013; 527:663-669.
23. Chu H, Wang M, Zhong D, Shi D, Ma L, Tong N, Zhang Z. AdipoQ polymorphisms are associated with type 2 diabetes mellitus: a meta-analysis study. Diabetes Metab Res Rev. 2013; 29:532-545.
24. Mtiraoui N, Ezzidi I, Turki A, Chaieb A, Mahjoub T, Almawi WY. Single-nucleotide polymorphisms and haplotypes in the adiponectin gene contribute to the genetic risk for type 2 diabetes in Tunisian Arabs. Diabetes Res Clin Pract. 2012; 97:290-297.
25. Huang H, Zeng Z, Zhang L, Liu R, Li X, Qiang O, Zhang Q, Chen Y. The association of interleukin-16 gene polymorphisms with susceptibility of coronary artery disease. Clin Biochem. 2013; 46:241-4.
26. Tong Z, Li Q, Zhang J, Wei Y, Miao G, Yang X. Association between interleukin 6 and interleukin 16 gene polymorphisms and coronary heart disease risk in a Chinese population. J Int Med Res. 2013; 41:1049-56.
27. Wu J, Wang Y, Zhang Y, Li L. Association between interleukin-16 polymorphisms and risk of coronary artery disease. DNA Cell Biol. 2011; 30:305-8.
28. Combarros O, Rodríguez-Rodríguez E, Mateo I, Vázquez-Higuera JL, Infante J, Berciano J, Sánchez-Juan P. APOE dependent-association of PPAR - genetic variants with Alzheimer’s disease risk. Neurobiol Aging. 2011; 32:547.e1-6.