
INTRODUCTION
Gastric cancer (GC) is one of the leading causes of cancer-related deaths worldwide. There are an estimated 1,000,000 new cases of GC and 723,000 cases of GC-related deaths each year [1]. The conventional white light gastroscopic biopsy and histology studies that play a critical role in GC diagnosis are facing huge challenges due to limitations of sampling error and labor intensity [2–5]. These disadvantages of traditional diagnostic methods have been hindering GC from being diagnosed at early stages and resulting in a poor prognosis, where there was no significant improvement in the last 35 years [6]. As has been demonstrated, if GC can be accurately diagnosed the first time malignancy is suspected, curative treatments can be provided to get a better prognosis [7, 8].
The combination of molecular probes and gastrointestinal endoscopy has emerged as a new method to diagnose and predict the prognosis of gastrointestinal neoplasms [9–11]. Peptide probes consisting of only a few highly specific amino acids exhibit numerous advantages, including high affinity, rapid binding kinetics, short blood-clearance time and low immunogenicity, and have technological advantages in detecting malignant lesions [12]. It has been well documented that some diagnostic markers expressed by various cancers can be specifically bound by targeted peptides. In the last decade, a number of molecular markers including cluster of differentiation 44 (CD44), have been identified in the tissue of GC, and shown clinical association with poor prognosis of GC [13–17]. However, previous reports mainly focused on the diagnostic value of peptide probes but not studied their predictive value in prognosis.
CD44, a glycoprotein of cell-surface, is closely associated with tumor metastasis and cancer stem cell (CSC) differentiation [18–20], which, regardless of its variation, has been demonstrated to play an important role in the progression of malignancies including GC [21–24]. We previously reported the RP-1, a peptide screened from a 12-mer phage peptide library, can specifically bind to CD44 protein, but didn’t focus on its prognostic and diagnostic value [25]. The purpose of the current study was to validate the specificity and affinity of RP-1 in both in vitro and in vivo experiments, and to explore the diagnostic and prognostic potentials of RP-1 for GC, therefore supporting RP-1 as an ideal molecular probe for further clinical application in both diagnosis and prognosis prediction of GC.
RESULTS
RP-1 demonstrated high specificity and affinity to CD44 positive cells
Two cell lines were generated through transfection: MKN-28-con cells with no CD44 expression and MKN-28-CD44-ox cells with CD44 overexpression labeled with EGFP (Figure 1B, 1F). In these co-cultures, MKN-28 cells not expressing CD44 transgenes bound considerably lower amounts of RP-1 peptide, while those CD44-overexpressing cells had an apparent binding of RP-1 peptides to CD44 on the cell membrane (Figure 1A). No fluorescent signal was detected on cells stained with WYP (Figure 1E). Then Pearson correlation test was conducted and indicated a positive linear correlation between the binding of RP-1 and CD44 positivity (R2 = 0.872, P < 0.001) (Figure 1I). The results demonstrated that RP-1 could bind to GC cells through CD44 expressed on the cell membrane. A non-linear increase in fluorescent intensity of FITC-RP-1 was observed from 0 to 2.5μM, whereas the fluorescent intensity of FITC-WYP remained at a low level, which signal was considered to be non-specific (Figure 1J). The equilibrium dissociation constant (Kd) was calculated to be 135 nM with a least squares fit, suggesting that RP-1 peptide bound to SGC-7901 cells with a high affinity.
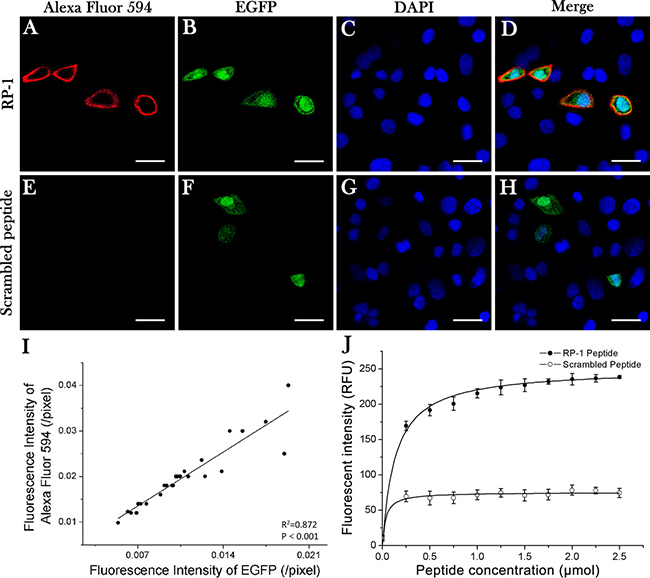
Figure 1: Specificity and affinity of RP-1 binding to CD44. Confocal laser microscopy images were obtained after co-cultures were incubated with Alexa Fluor 594 labeled RP-1 peptide for 20 min. (A) Specific binding of RP-1 peptide was found on MKN-28 cells with CD44 overexpression but not on non-transfected MKN-28 cells. (E) No binding of scrambled peptide was detected. (B, F) Transfected MKN-28 cells showed a green fluorescence signal of EGFP. (C, G) DAPI staining of co-cultured cells. (D, H) Colocalization (merged images) of EGFP- and Alexa Fluor 594- induced fluorescence. Scale bar, 25 μm. (I) A linear positive correlation between fluorescent intensities of EGFP and Alexa Fluor 594 (R2 = 0.872, P < 0.001). (J) The affinity of FITC-RP-1 to SGC-7901 cells was calculated with an equilibrium dissociation constant of Kd = 135 nM (R2 = 0.98), whereas no binding of FITC-WYP was detected.
Low toxicity of RP-1 peptide
Gastric cancer cells MKN-28, SGC-7901, BGC-823 and human gastric epithelial cell line GES-1 were incubated with FITC-RP-1 peptide of different concentrations for 72 h, and then cell viabilities were measured. The cell viabilities of MKN-28, SGC-7901, BGC-823 and GES-1 at the maximum tested concentration of 200 μM, were more than 85%, 86%, 84% and 91% respectively (Figure 2A). The cytotoxicity at maximum tested concentration of 200 μM was also evaluated at different times points (Figure 2B). All the results indicated that FITC-RP-1 exhibited a low cytotoxicity ex vivo. Then the toxicity of FITC-RP-1 peptide was tested in vivo. No loss in body weight was found during one week’s observation after injection (Figure 2C), and no remarkable inflammation in organs was observed from H&E staining studies in both FITC-RP-1 and control group (Figure 2D). The results of animal experiments indicated that FITC-RP-1 peptide had a low toxicity in vivo.
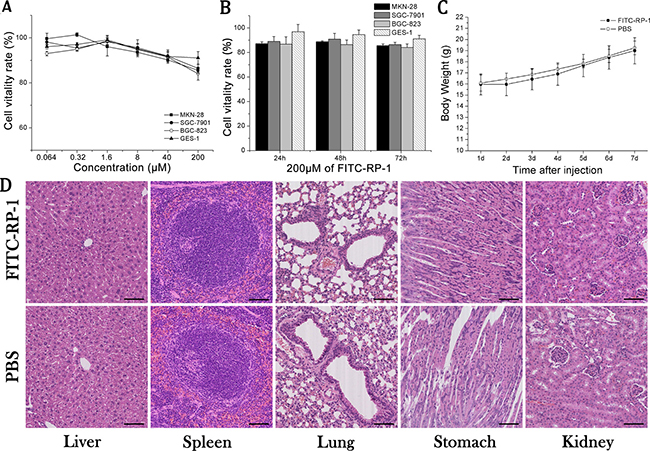
Figure 2: The toxicity of FITC-RP-1 ex vivo and in vivo. (A) Cell viabilities of MKN-28, SGC-7901 and BGC-823 cells incubated with FITC-RP-1 at different concentrations for 72 h. (B) Cell viabilities of MKN-28, SGC-7901 and BGC-823 cells incubated with FITC-RP-1 of 200 μM at different time points. (C) Body weight of nude mice was measured one week after intravenous injection of FITC-RP-1. (D) H&E staining of normal organs harvested one week after intravenous injection of FITC-RP-1 and PBS. Scale bar, 140 μm.
Specific binding of RP-1 to subcutaneous xenografts in vivo
FITC-RP-1 and FITC-WYP were injected at a dosage of 1 μg/g body weight via tail veins in SGC-7901 subcutaneous xenograft models and fluorescence images were taken at 1 to 6 h after injection. The accumulation of FITC-RP-1 in tumor reached a peak at 3 h, while no obvious accumulation of FITC-WYP was observed (Figure 3A). Fluorescent intensity detected in gastrointestinal tract was significantly affected by the gastrointestinal contents that showed strong fluorescent signals (Figure 3A). Fluorescent intensity was quantified at the region of interest (ROI) of the tumor tissues (Figure 3B). Tumor tissues and normal organs of interest were harvested 3h after injection, and their fluorescence images showed an accumulation of RP-1 in tumor tissue and liver (Figure 3C). Then fluorescent intensity of excised tissues was quantified. In tumor, liver, stomach and kidney tissues, the fluorescent intensity values of RP-1 were 1.14 × 10⁹, 5.58 × 10⁸, 2.28 × 10⁸ and 2.00 × 10⁸ (p/sec/cm2/sr) /(μW/cm2), respectively (Figure 3D). And t-test on fluorescent intensity values of tumor and other organs showed a statistical significance with P < 0.001. Although fluorescent signal was also detected in normal organs, it was weaker than that of tumor tissue. It was speculated that the slight fluorescent signal detected in the stomach of RP-1 group might be caused by low expression of CD44 on normal gastric mucosa and non-specific binding of RP-1. Since fluorescent signal in tumor tissue was significantly higher than that in stomach, the application of FITC-RP-1 for in vivo GC detection would be hardly affected. Besides, fluorescence signal was almost undetectable 6 h after intravenous injection, which suggested that RP-1 exhibited a property of fast elimination.
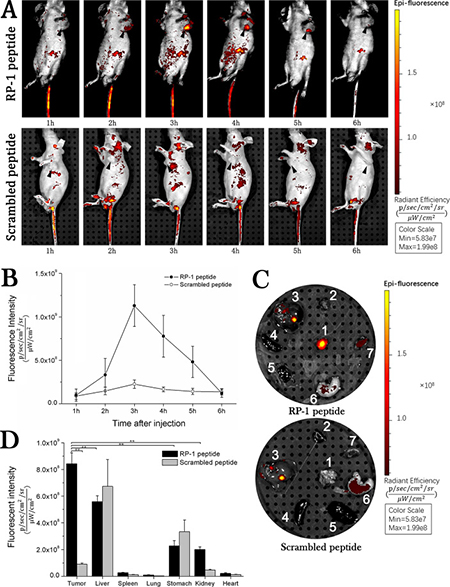
Figure 3: In vivo fluorescence imaging. RP-1 showed a high binding specificity to subcutaneous transplantation of SGC-7901 cells. (A) Fluorescence image of nude mice subcutaneously transplanted with SGC-7901 cells by intravenous injection. (B) Fluorescent intensity values at ROI of tumor tissue. The accumulation of RP-1 in tumor reached its maximum at 3h, while no obvious accumulation of control peptide was observed. (C) Fluorescence images of excised organs (1, tumor; 2, heart; 3, liver; 4, spleen; 5, lung; 6, stomach; 7, kidney) from mice in RP-1 and control group, respectively. (D) Fluorescent intensity values and statistical analysis of excised organs. RP-1 had a prominent uptake in tumor tissues while only slight accumulation in normal tissues.
Specificity of RP-1 binding to CD44 on tumor tissue
Tumor tissues were harvested when fluorescence signal of tumor reached its peak and were prepared for frozen sections. Increased fluorescence of tumor cells was detected only in the frozen sections from RP-1 group, and fluorescence signals were observed both on cell membrane and in cytoplasm (Figure 4A–4D). RP-1 targeted at GC tumor cells instead of intercellular matrix or vascular cells in vivo. Immunohistochemistry studies showed positive staining on the cell membrane and cytoplasm in paraffin sections incubated with Biotin-RP-1 peptide or anti-CD44 antibody, indicating that RP-1 might bind to tumor cells through CD44 (Figure 4E–4H).
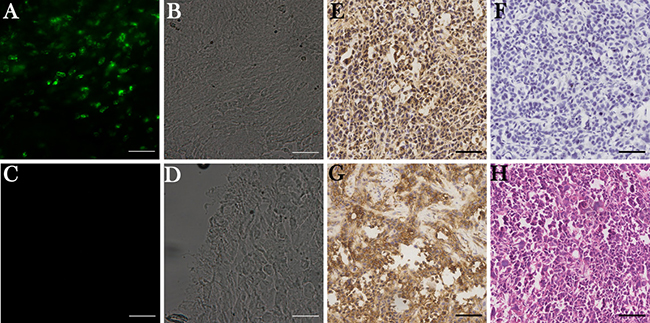
Figure 4: RP-1 binding to CD44 in tumor tissues. (A–D) Fluorescence imaging of tumor tissue sections 3h after peptide injections. (A) Increased fluorescence signal was detected on tumor cells instead of intercellular matrix and vascular cells in RP-1 group. (C) No fluorescence signal was detected in control group. (B, D) Corresponding phase contrast images. (E–G) Immunohistochemical staining of RP-1, controlled peptide and anti-CD44 monoclonal antibody. (E) In RP-1 group, biotin labeled RP-1 had positive staining on cell membrane and in cytoplasm. (F) No obvious staining was observed for biotin labeled control peptide. (G) Positive membranous staining and cytoplasmic staining were observed in anti-CD44 antibody group. (H) H&E staining of tumor specimen. Scale bar, 140 μm.
Cut-off scores of RP-1 and anti-CD44 antibody
In RP-1 and anti-CD44 antibody IHC staining of gastric carcinomas and surrounding tissues, immunoreactivities were observed both on cell membrane and in cytoplasm (Figure 5A–5H). Anti-CD44 antibody positive staining could be found in tumor cells and some lymphocytes (Figure 5A–5B), whereas RP-1 was positive only in tumor cells (Figure 5C–5D). Intensity of RP-1 (and antibody, figure not shown) staining of each sample was scored as 0 (Figure 5E), 1 (Figure 5F), 2 (Figure 5G) and 3 (Figure 5H). Then immunohistochemistry scores (HSCOREs) of all samples on TMA were calculated, and through t-test, it was demonstrated that the HSCOREs of GC samples stained with RP-1 or anti-CD44 antibody were significantly higher than that of surrounding tissue samples (P < 0.001) (Figure 5I). In Pearson correlation test, a linear positive correlation was observed between RP-1 and anti-CD44 antibody staining (R2 = 0.523, P < 0.001) (Figure 5J). The receiver operating characteristic (ROC) curves of RP-1 and anti-CD44 antibody were generated by using the SPSS software, version 21.0. The scores 0.33 and 0.20 corresponding to point (0.19, 0.64) and (0.13, 0.73), which were closest to (0.0, 1.0) and maximized in both sensitivity and specificity for diagnosis, were selected as the cut-off scores of anti-CD44 antibody and RP-1, respectively (Figure 5K, 5L). The corresponding AUCs of anti-CD44 antibody and RP-1 were 0.77 and 0.86, which suggested that both antibody and RP-1 exhibited a high diagnostic values.
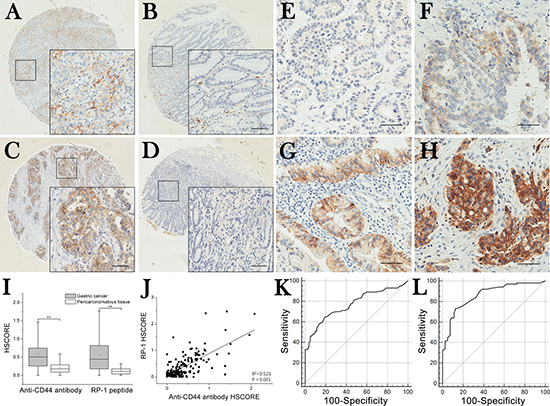
Figure 5: TMA immunohistochemistry staining and selection of cut-off scores. (A) Gastric carcinoma tissues stained with anti-CD44 antibody. (B) Surrounding tissue stained with anti-CD44 antibody. (C) Gastric carcinoma tissue stained with RP-1. (D) Surrounding tissue stained with RP-1. (E–H) Negative (i = 0), weak (i = 1), moderate (i = 2) and strong (i = 3) positive RP-1 staining of TMA samples. Scale bar, 140 μm. (I) HSCOREs of gastric adenocarcimomas were significantly higher than those of surrounding tissues (P < 0.001). (J) Correlation between RP-1 and anti-CD44 antibody staining intensity. A linear positive correlation was observed between RP-1 and anti-CD44 antibody staining (R2 = 0.523, P < 0.001). (K) The cut-off score of anti-CD44 antibody was determined to be 0.33 with ROC (sensitivity, 64.0%; specificity, 81.2%). (L) The cut-off score of RP-1 was determined to be 0.22 with ROC (sensitivity, 73.0%; specificity, 87.5%).
RP-1 exhibited similar sensitivity and specificity with anti-CD44 antibody
Positivity of RP-1 staining was observed in 73 gastric carcinoma tissue samples and 10 surrounding tissue samples, and positivity of anti-CD44 antibody in 64 gastric carcinoma samples and 15 surrounding tissue samples. RP-1 had a sensitivity of 73.0% and a false-positive rate of 12.5%, while anti-CD44 antibody had a sensitivity of 64.0% and a false-positive rate of 18.7% (Table 1). Result of χ2-test indicated that RP-1 shared similar sensitivity and specificity with anti-CD44 antibody (P = 0.124 and P = 0.403, respectively). In comparison with histological study, RP-1 and antibody had Kappa statistics of 0.592 and 0.441 respectively, suggesting that both RP-1 and anti-CD44 antibody exhibited good consistency with histological studies. Then we calculated and compared AUCs of RP-1 and anti-CD44 antibody, and found that RP-1 exhibited a diagnostic accuracy with comparable to that of anti-CD44 antibody (z = 2.520, P = 0.093). In a word, both anti-CD44 antibody and RP-1 were highly accurate in diagnosing GC and could be considered as ideal bio-probes for the molecular diagnosis of GC.
Table 1: The positivities of RP-1 and anti-CD44 antibody in carcinomas and pericarcinomatous tissues
Gastric carcinomas tissues |
Pericarcinomatous tissues |
||||||
|---|---|---|---|---|---|---|---|
RP-1 |
RP-1 |
||||||
Positive |
Negative |
Total |
Positive |
Negative |
Total |
||
Antibody |
Positive |
55 |
9 |
64 |
1 |
14 |
15 |
Negative |
18 |
18 |
36 |
9 |
56 |
65 |
|
Total |
73 |
27 |
100 |
10 |
70 |
80 |
|
RP-1 positivity was associated with patient survival
The positive rates of RP-1 in GC with respect to several clinicopathological variables were presented in Table 2. The results of χ2-test indicated that RP-1 positivity was associated with age (≤ 64.4 years vs. > 64.4 years) and patient survival status. Positive rate of RP-1 was lower in survivals than non-survivals (P < 0.001). However, there was no significant correlation between RP-1 positivity and other clinicopathological features including gender, WHO classification, histological differentiation, pT status, pN status, pM status and clinicopathological stage (P > 0.05, Table 2). Besides, RP-1 positivity could be observed in all clinicopathological stages. Furthermore, there was no statistical difference among the RP-1 positive rates in GC of different stages (P = 0.615, data not shown). Thus, we found that RP-1 could possibly make a role in helping to detect GC at an early stage.
Table 2: The relationship between RP-1 positivity and clinicopathological variables
All cases |
RP-1 staining |
|||
|---|---|---|---|---|
Positive (%) |
Negative (%) |
P-value |
||
Gender |
||||
Male |
64 |
47 (47.0) |
17 (17.0) |
0.895 |
Female |
36 |
26 (26.0) |
10 (10.0) |
|
Age at surgery (years) |
||||
> 64.4 |
46 |
34 (34.0) |
12 (12.0) |
0.036 |
≤ 64.4 |
54 |
39 (39.0) |
15 (15.0) |
|
WHO classification |
||||
Adenocarcinoma |
66 |
50 (50.0) |
16 (16.0) |
0.182 |
Tubular adenocarcinoma |
19 |
14 (14.0) |
5 (5.0) |
|
Mucinous adenocarcinoma |
8 |
3 (3.0) |
5 (5.0) |
|
Signet ring cell carcinoma |
4 |
4 (4.0) |
1 (1.0) |
|
Undifferentiated carcinoma |
3 |
2 (2.0) |
0 (0.0) |
|
Histological differentiation |
||||
Well differentiated |
26 |
9 (9.0) |
6 (6.0) |
0.066 |
Moderately differentiated |
69 |
53 (53.0) |
21 (21.0) |
|
Poorly differentiated |
5 |
11 (11.0) |
0 (0.0) |
|
pT status |
||||
pT1 |
8 |
5 (5.0) |
3 (3.0) |
0.399 |
pT2 |
9 |
6 (6.0) |
1 (1.0) |
|
pT3 |
66 |
45 (45.0) |
20 (20.0) |
|
pT4 |
17 |
17 (17.0) |
3 (3.0) |
|
pN status |
||||
pN0 |
27 |
21 (21.0) |
6 (6.0) |
0.101 |
pN1 |
15 |
7 (7.0) |
8 (8.0) |
|
pN2 |
28 |
22 (22.0) |
6 (6.0) |
|
pN3 |
30 |
23 (23.0) |
7 (7.0) |
|
pM status |
||||
pM0 |
91 |
65 (65.0) |
26 (26.0) |
0.260 |
pM1 |
9 |
8 (8.0) |
1 (1.0) |
|
Clinicopathological stage |
||||
I |
10 |
6 (6.0) |
4 (4.0) |
0.526 |
II |
32 |
22 (22.0) |
10 (10.0) |
|
III |
50 |
38 (38.0) |
12 (12.0) |
|
IV |
8 |
7 (7.0) |
1 (1.0) |
|
Survival |
||||
Died |
69 |
58 (58.0) |
11 (11.0) |
< 0.001 |
Survived |
31 |
15 (15.0) |
16 (16.0) |
|
Poor prognosis of GC was associated with positive RP-1
In univariate survival analysis, Kaplan-Meier survival curve was used and log-rank test was performed to calculate P values for determining clinicopathological variables that had significant impact on patient survival. According to Kaplan-Meier analysis, several known clinicopathological features were significantly associated with patient survival (Figure 6), such as pT status (P = 0.001), pN status (P = 0.012), pM status (P < 0.001), and clinicopathological stage (P < 0.001) (Table 3). Kaplan-Meier analysis also revealed a strong association between RP-1 positivity and antibody positivity with survival time (P < 0.001 and P = 0.002, respectively) (Table 3). The median survival time was 22.0 months in patients with positive RP-1 staining and not reached (NR) in patients with negative RP-1 staining (Table 3). Patients with positive RP-1 and antibody staining had similar median survival time (22.0 months vs. 20.0 months), but in Kaplan-Meier curve patients with negative RP-1 had a longer median survival time (of not reached) than those with negative antibody staining. Therefore, RP-1 was considered to possess the capacity to predict GC patient’s prognosis.
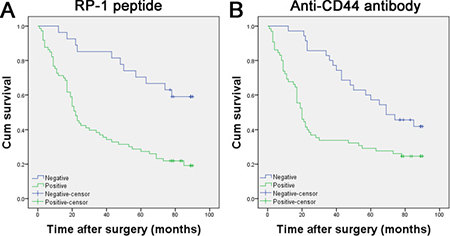
Figure 6: Kaplan–Meier curves for survival of gastric adenocarcinoma patients. (A) Positive RP-1 staining was associated with poor prognosis (P < 0.001). (B) Positive anti-CD44 antibody staining was associated with poor prognosis (P = 0.002).
Table 3: Univariate survival analysis on clinicopathological variables and RP-1 positivity
Variable |
All cases |
Mean survival (months) |
Median survival (months) |
P-value |
|---|---|---|---|---|
Age at surgery (years) |
||||
> 64.4 |
54 |
41.6 |
23.0 |
0.078 |
≤ 64.4 |
46 |
52.2 |
43.0 |
|
WHO classification |
||||
Adenocarcinoma |
66 |
45.1 |
28.0 |
0.154 |
Tubular adenocarcinoma |
19 |
50.2 |
65.0 |
|
Mucinous adenocarcinoma |
8 |
68.4 |
78.0 |
|
Signet ring cell carcinoma |
4 |
28.0 |
25.0 |
|
Undifferentiated carcinoma |
3 |
18.0 |
21.0 |
|
Histological differentiation |
||||
Well differentiated |
26 |
57.8 |
NR |
0.064 |
Moderately differentiated |
69 |
42.8 |
28.0 |
|
Poorly differentiated |
5 |
35.8 |
30.0 |
|
pT status |
||||
pT1 |
8 |
81.6 |
NR |
0.001 |
pT2 |
9 |
52.0 |
63.0 |
|
pT3 |
66 |
47.0 |
34.0 |
|
pT4 |
17 |
25.2 |
17.0 |
|
pN status |
||||
pN0 |
27 |
61.5 |
65.0 |
0.012 |
pN1 |
15 |
57.3 |
69.0 |
|
pN2 |
28 |
43.1 |
22.0 |
|
pN3 |
30 |
30.8 |
19.0 |
|
pM status |
||||
pM0 |
91 |
49.8 |
47.0 |
< 0.001 |
pM1 |
9 |
12.9 |
7.0 |
|
Clinicopathological stage |
||||
I |
10 |
68.3 |
NR |
< 0.001 |
II |
32 |
60.3 |
63.0 |
|
III |
50 |
38.4 |
21.0 |
|
IV |
8 |
14.3 |
7.0 |
|
RP-1 staining |
||||
Positive |
73 |
37.3 |
22.0 |
< 0.001 |
Negative |
27 |
71.3 |
NR |
|
Antibody staining |
||||
Positive |
64 |
36.8 |
20.0 |
0.002 |
Negative |
36 |
64.6 |
69.0 |
Notes: NR, not reached.
RP-1 can be used as an independent predictor of GC survival
Multiple Cox proportional hazards regression was carried out to confirm the value of each variable identified in univariate survival analysis in independently predicting patient survival (Table 4). Among all the variables, pT stage (P = 0.027), pM stage (P = 0.012), antibody positivity (P = 0.001) and RP-1 positivity (P < 0.001) were found to be independent prognostic factors for the overall survival of GC patients (Table 4). Relative risk (RR) and its 95% confidence interval (CI) of RP-1 positivity was 0.284 and 0.142–0.567, which suggested that RP-1 positivity was an ideal independent predictor of survival (Table 4).
Table 4: Multivariate analysis on overall survival (Cox regression model)
Variable |
β |
Relative risk |
95% Confidence interval |
P-value |
|---|---|---|---|---|
RP-1 positivity |
−1.260 |
0.284 |
0.142–0.567 |
< 0.001 |
Anti-CD44 antibody positivity |
−1.022 |
0.360 |
0.199–0.650 |
0.001 |
pT status |
0.027 |
|||
pT (1) |
−3.019 |
0.049 |
0.006–0.393 |
0.005 |
pT (2) |
−1.406 |
0.245 |
0.063–0.960 |
0.043 |
pT (3) |
−0.522 |
0.593 |
0.330–1.067 |
0.081 |
pM status |
−1.989 |
0.137 |
0.114–1.796 |
0.012 |
DISCUSSION
Gastric cancer is one of the most common malignances with a high incidence and low 5-year survival rate due to a lack of sensitive and specific methods for in-situ detection or diagnosis. In the last decade, a number of molecular biomarkers of prognostic and diagnostic values for GC have been identified. Since the development of molecular imaging techniques in combination with endoscopy, accurate diagnosis and prediction of prognosis have gradually been more meaningful and feasible than ever. Recently, a serious of studies demonstrated the diagnostic and prognostic values of CD44 expression in human cancers including GC [26–31]. These evidences implied the possibility of predicting prognosis and making diagnosis at the early stage via molecular imaging of CD44 protein, because CD44 can be expressed in a large amount in cancer cells even at early stage of GC. As has been previously reported, RP-1 is a peptide that has both high affinity and specificity to CD44 protein [25]. In this study, we further validated the high sensitivity, specificity and affinity, and low toxicity of the targeted molecular bio-probe RP-1 by performing a series of in vivo, ex vivo and in vitro experiments.
Previous researches mainly focused on the biological characteristics and in-situ diagnostic values of peptide bio-probes [29, 32], but less attention has been paid to their prognostic capacities. Many factors associated with poor prognosis can be expressed by malignant cells even at an early stage. Thus, early detection of these prognostic factors may provide us with critical information regarding prognosis so that early treatment can be initiated. In this study, RP-1 exhibited capacities of both assisting diagnosis and predicting prognosis of GC, which were based on its high affinity and specificity in binding to CD44, a protein that is highly related to malignancies. Interestingly, RP-1 positive staining was observed in GC tissues from patients of all clinicopathological stages, and the positive rate had no significant correlation with clinicopathological stage. Patients with positive RP-1 staining had poorer prognosis than those with negative staining, and RP-1 positivity was proved to be an independent predictor of poor prognosis. These evidences thus indicate that RP-1 can be used in the diagnosis and prognosis prediction in GC of all stages.
With the development of imaging instruments, several optical techniques including Raman spectroscopy, optical coherence tomography (OCT), and confocal fluorescence endomicroscopy have been invented for the endoscopic detection of gastric malignant lesions [12, 33–35]. Some other studies have confirmed the prospect that the topical application of a peptide in Barrett’s esophagus in vivo through endoscopy, which can realize accurate early diagnosis [36]. An ideal bio-probe that can be used in endoscopic diagnosis should have such characterizations as high biocompatibility, high binding affinity, deep tissue penetration, rapid kinetics and low immunogenicity. In our study, RP-1 bio-probe with low molecular weight showed high biological affinity and low toxicity. Considering its capacities of diagnosis and predicting prognosis, RP-1 can be applied in combination with gastrointestinal endoscopy as a tool to assist diagnosis and predict prognosis at the same time.
In our study, results of tissue microarray analysis of GC patients showed that negative RP-1 staining was more associated with good prognosis compared with anti-CD44 monoclonal antibody staining, and positivity of both RP-1 and anti-CD44 antibody were comparably associated with poor prognosis. The reason may lie in the differences between the binding domains of RP-1 and antibody to CD44 protein. In a published article, the binding domain of RP-1 to CD44 protein was identified with molecular docking, which showed that RP-1 may bind to CD44 through Glu37 and Asn94 of the hyaluronan binding domain of CD44 protein [25]. However, the three-dimensional structure and special domain function of CD44 protein remain unclear. Thus, we still cannot rule out the possibility that RP-1 might bind to other domains of CD44 protein. At least, it is likely that the specific molecular domain targeted by RP-1 is closely related to GC patient’s prognosis. Further researches are needed for evaluating the diagnostic and prognostic values of the specific binding domains of CD44 protein.
There are also some limitations of our study despite the encouraging results we obtained. First, tissue auto-fluorescence can exist in in vivo fluorescence imaging, which may jeopardize the validity of the result. Therefore, a near-infrared fluorescein with higher efficient tissue penetration should be considered in further researches [37]. Second, although RP-1 had a relatively high sensitivity and specificity, false-positivity was still possible. To solve this issue, a bio-probe complex consisting of different bio-probes targeting at gastric carcinoma tissues can be synthesized and applied through a multi-spectral fiber endoscope with the capacity of detecting several fluorescence at different wave lengths [38, 39]. Third, the sample size of our study included only 100 cases of GC from the same geographical area and the evaluation of diagnosis and prognostic prediction may be limited by sampling error. It is necessary to verify the potential role of RP-1 using a larger sample size in further studies.
In conclusion, we have validated the specificity and affinity of RP-1 through a series of ex vivo and in vivo experiments and confirmed its value in diagnosis and prognosis prediction by tissue microarrays. The biological characteristics of RP-1 support its further clinical application as an ideal bio-probe in both accessory diagnosis and prognosis prediction of GC.
MATERIALS AND METHODS
Peptide synthesis
The RP-1 peptide (WHPWSYLWTQQA; ChinaPeptides Co LTD, Shanghai, China) was synthesized with the purity higher than 95%. The scrambled peptide WYP (WYPLAHWQTSWQ) consisting of the same amino acids was also synthesized as the control peptide. Peptides were labeled with fluorescein isothiocyanate (FITC), Alexa Fluor 594 or biotin at the N-terminus for further experiments.
Cell lines
Human gastric adenocarcinoma cell lines MKN-28, SGC-7901 and BGC-823 of various differentiation grades and human gastric epithelial cells GES-1 were selected. All four cell lines were cultured in Roswell Park Memorial Institute 1640 Medium (RPMI 1640, HyClone, Utah, USA) supplemented with 10% fetal bovine serum (Gibco, California, USA) and 1% penicillin/streptomycin (HyClone, Utah, USA) and maintained in a 5% CO2 incubator at 37°C. All cell lines were obtained from the Cell Bank of Type Culture Collection of the Chinese Academy of Sciences, Shanghai, China.
Establishment of CD44-expressing cell lines
Plasmids containing cDNA of CD44 protein were synthesized by GENECHEM, Shanghai, China. Using Pfu polymerase and two oligonucleotides (TCCGCTCGAGATGGACAAGTTTTGGTGGCACG and ATCGGAATTCTTACACCCCAATCTTCATGTC), the CD44 cDNA was cloned into Xhol and ECOR1 sites of GV146 (GENECHEM, Shanghai, China) by recombinant PCR. Then, CD44-negative MNK-28 cells were transfected with the plasmid with Lipofectamine 2000 reagent (Invitrogen, California, USA), and then the efficiency of CD44 expression in MKN-28 cells was tested. Finally, two cell lines were generated as following: MKN-28-con with no CD44 expression and MKN-28-CD44-ox with CD44 overexpression labeled with enhanced green fluorescent protein (EGFP).
Immunofluorescence
For the preparation of confocal laser microscopy, the transfected MNK-28 cancer cells were washed with phosphate buffer saline (PBS) three times, then fixed with 4% paraformaldehyde at ambient temperature for 30 min, and blocked with 5% BSA (w/v) in PBS at 37°C for 1 h. The blocked cells were sequentially incubated with 100 μM RP-1 or WYP labeled with Alexa Fluor 594 for 20 min, and counterstained with 4,6-diamidino-2-phenylindole (DAPI). The coverslips were mounted with glycerol–gelatin containing anti-fading buffer (Bioworld, Minnesota, USA) and examined with a confocal laser microscope (Leica, Solms, Germany). For the evaluation of the correlation of fluorescent intensities between CD44-EGFP and RP-1-Fluor 594, a semi-quantitative analysis was performed with ImageJ 1.48v software (National Institutes of Health, Maryland, USA) by randomly selecting and observing 10 fields of vision. Finally, the Pearson correlation analysis was performed by using SPSS software, version 21.0 (IBM, New York, USA).
Measurement of RP-1’s binding affinity to GC cells
5 × 10⁵ SGC-7901 cells were inoculated into each well of a multi-well plate 24h before measurement. Both FITC- RP-1 and FITC-WYP peptide were serially diluted with RPMI 1640 culture medium containing no serum at concentrations ranged from 0 to 2.5 μM at 0.25 μM intervals, and incubated with SGC-7901 cells at ambient temperature for 15 min [40]. After washing twice with pre-cold PBS/0.2% Tween-20 solution, the unbound peptide was rinsed off, and cells were subsequently fixed in 4% paraformaldehyde at ambient temperature for 20 min. Then 200 μL PBS was added to each well for retaining moisture, and the fluorescent intensity (I) was measured with a microplate reader (Bio-Rad, Hercules, CA, USA). The equilibrium dissociation constant (Kd) was calculated using a least squares fit of the data with Origin 8.0 software (OriginLab, Massachusetts, USA). I was calculated using the Michaelis-Menten equation I = Imax([X])/(Kd+[X]), in which Imax was the maximum fluorescent intensity corresponding to peptide binding at saturation, which was calculated from the plots; I was the fluorescent intensity measured above; [X] was the concentration of total peptides and estimated to be the concentration of unbound peptide [41].
Animal model
All animal procedures were approved by the Ethics Committee of Xi’an Jiaotong University and conducted in accordance with the Helsinki Declaration (1975). Athymic nude mice (male, 4–5 weeks old, with a body weight of 20–25 g) were obtained from the Animal Experiment Center of Xi’an Jiaotong University, Xi’an, China. The SGC-7901 tumor xenografts were generated by subcutaneous injection of 5–8 × 10⁶ SGC-7901 cells suspended in 200 μL culture medium into the left axilla of mice. The cells were allowed to grow for 2 weeks until tumor volume reached an estimate of 1 cm3.
Evaluation of RP-1 peptide toxicity
Cell Counting Kit-8 (CCK-8, Beyotime, Shanghai, China) assay and animal experiments were performed to evaluate the in vitro and in vivo toxicity of RP-1 peptide, respectively. For CCK-8 assay, 5 × 10³ MKN-28, SGC-7901, BGC-823 and GES-1 cells in 100 μL culture medium were incubated into each well of a 96-well plate 24 h before peptide was added. All cells were incubated with FITC-RP-1 0.064 to 200 μM. After incubation for 24 h, 48 h or 72 h, 10 μL CCK-8 reagent were added into each well and further incubated for 3 h. Then, the absorbance at 450 nm was measured with a microplate reader (Bio-Rad, Hercules, CA, USA). In animal experiments, FITC-RP-1 or PBS 1 mg/kg was intravenously injected via the tail vein. The body weight of nude mice was measured every day. Then normal organs were obtained from nude mice one week after injection, fixed in a 10% formalin solution and embedded with paraffin. Hematoxylin and eosin (H&E) staining was performed for observing the histological changes. All histopathological evaluations were conducted by two independent pathologists.
In vivo fluorescence imaging
In vivo fluorescence imaging was performed with the IVIS Spectrum Imaging System and analyzed with the IVIS Living Imaging 4.2 software (Xenogen, California, USA). Identical imaging settings (exposure time: 40s; binning: 16; lens aperture [f/stop]: 4; field of view: 13.3) were used for capturing images. Fluorescent intensity was normalized and presented as (p/sec/cm2/sr)/(μW/cm2). The mice from the experimental group (n = 10) and control group (n = 10) were intravenously injected with 1 mg/kg FITC-RP-1 and FITC-WYP, respectively. Mice anesthetized with isoflurane were subjected to optical imaging at each hour since 1h after injection. Finally, solid tumors, tissues, and organs were all harvested and rinsed with PBS for further analysis of the distribution of FITC-RP-1.
Microscopic analysis of RP-1 peptide binding to mouse xenografts ex vivo
Once fluorescence signal reached its peak at the site of tumor, subcutaneous tumor tissues were harvested for further experiment. After shock-frozen with liquid nitrogen, tumor tissues were cut into 5 μm sections and fixed in 4% paraformaldehyde at ambient temperature for 30 min. The coverslips were mounted with glycerol–gelatin containing anti-fading buffer (Bioworld, Minnesota, USA). Finally, the fluorescence images of frozen sections were captured with a fluorescent microscope (Nikon-Eclipse, Tokyo, Japan)
Immunohistochemistry
Prepared paraffin-embedded sections were deparaffinized, rehydrated, retrieved and blocked with 5% BSA (w/v) in PBS at ambient temperature for 30 min. Then, sections were incubated with 100 μM biotin labeled RP-1 peptide or human specific rabbit anti-CD44 monoclonal antibody (1:200, ZSGB-BIO, Beijing, China) overnight at 4°C. After PBS washing for three times, sections were subsequently incubated with streptavidin-HRP (1:500, Proteintech, Wuhan, China) and goat anti-rabbit secondary antibody (1:300, BOSTER, Wuhan, China). Diaminobenzidine (DAB, ZSGB-BIO, Beijing, China) was used as a chromogen. Finally, the sections were counterstained with hematoxylin and mounted with neutral balsam.
Tissue microarrays (TMA)
Two TMA slides (Shanghai Outdo Biotech Co LTD, Shanghai, China), each containing 100 GC tissues samples (including 66 adenocarcinoma, 19 tubular adenocarcinoma, 8 mucinous adenocarcinoma, 2 undifferentiated carcinoma and 5 signet-ring cell carcinoma tissue samples) and 80 surrounding tissue samples from 100 patients, were used to evaluate the diagnostic and prognostic effects of RP-1. Samples were obtained from treatment-naive patients with written informed consent signed and dated. Age of the 100 patients with GC ranged from 32 to 81 years (mean, 64.4 years). Their clinicopathological characteristics were described in Table 2. The TNM stage of all patients with GC was assessed according to the American Joint Commission for Cancer (AJCC 7th edition) and tumors were histologically classified according to the criteria described by the World Health Organization (2000). The Medical Ethics Committee of Taizhou Hospital of Zhejiang province reviewed and approved all studies.
We performed immunohistochemical staining of TMA slides with RP-1 and human specific anti-CD44 monoclonal antibody by following the procedure described in the section Immunohistochemistry. The immunoreactivity was assessed with the immunohistochemistry score (HSCORE) system, which evaluated the staining intensity and percentages of positive cells stained at a specific magnitude of intensity. The HSCORE was calculated using the equation HSCORE=∑Pi(i) (i = 0, 1, 2, 3, Pi = 0–100%), in which i was the staining intensity (0, no staining; 1, weak staining; 2, moderate staining; 3, strong staining) and Pi was the percentage of positive cells on a scale of 0% to 100%. Positive cell count was assessed in 5 randomly selected fields of vision with a microscope (400×). All immunohistochemical evaluations were conducted by two independent pathologists who also assessed peptide toxicity as described above.
Receiver–operator curve (ROC) analysis was performed to determine the cut-off score for both RP-1 peptide and anti-CD44 monoclonal antibody. The score closest to the point (0.0, 1.0) with maximum sensitivity and specificity was identified as the cut-off score. Samples with a HSCORE of cut-off value or below were considered as negative staining, otherwise they were considered as positive staining.
Statistical analysis
Statistical analysis was conducted with SPSS software, version 21.0 (IBM, New York, USA). Kappa values were used to determine the consistency of histological and immunohistochemical results between RP-1 peptide and anti-CD44 antibody. Independent sample t-test was performed to decide existence of statistical difference in fluorescent intensity values between tumor and other normal organs. The ROC analysis was carried out to decide the cut-off value for RP-1 and anti-CD44 antibody. The area under the curve (AUC) was calculated to compare the diagnostic accuracy of RP-1 and anti-CD44 antibody. χ2-test was used to assess the association between each clinicopathological variable and RP-1 staining intensity, while log-rank test was used for assessing the association between survival and each clinicopathological variable. Multiple Cox proportional hazards regression was performed to verify if RP-1 positivity can be used as an independent risk factor for prognosis of GC. All statistical tests were two-tailed tests and P value < 0.05 was considered to be of statistical significance.
ACKNOWLEDGMENTS AND FUNDING
This work was supported by the National Natural Science Foundation of China (No.81172359 and 81472747).
CONFLICTS OF INTEREST
The authors proclaim that they have no conflicts of interest in this study.
REFERENCES
1. Ferlay J, Soerjomataram I, Dikshit R, Eser S, Mathers C, Rebelo M, Parkin DM, Forman D, Bray F. Cancer incidence and mortality worldwide: sources, methods and major patterns in GLOBOCAN 2012. International journal of cancer. 2015; 136:E359–386.
2. Hartgrink HH, Jansen EPM, van Grieken NCT and van de Velde CJH. Gastric cancer. The Lancet. 2009; 374:477–490.
3. Lee H, Min BH, Lee JH, Son HJ, Kim JJ, Rhee JC, Kim S, Rhee PL. Survival outcome associated with the screening interval for gastric cancer in Korea. Digestion. 2011; 84:142–148.
4. Kim YS, Park HA, Kim BS, Yook JH, Lee MS. Efficacy of screening for gastric cancer in a Korean adult population: a case-control study. Journal of Korean medical science. 2000; 15:510–515.
5. Nam SY, Choi IJ, Park KW, Kim CG, Lee JY, Kook MC, Lee JS, Park SR, Lee JH, Ryu KW, Kim YW. Effect of repeated endoscopic screening on the incidence and treatment of gastric cancer in health screenees. European journal of gastroenterology & hepatology. 2009; 21:855–860.
6. Liang H, Kim YH. Identifying molecular drivers of gastric cancer through next-generation sequencing. Cancer letters. 2013; 340:241–246.
7. Yamashita K, Sakuramoto S, Nemoto M, Shibata T, Mieno H, Katada N, Kikuchi S, Watanabe M. Trend in gastric cancer: 35 years of surgical experience in Japan. World journal of gastroenterology. 2011; 17:3390–3397.
8. Strong VE, Wu AW, Selby LV, Gonen M, Hsu M, Song KY, Park CH, Coit DG, Ji JF, Brennan MF. Differences in gastric cancer survival between the U.S. and China. Journal of surgical oncology. 2015; 112:31–37.
9. Goetz M, Wang TD. Molecular imaging in gastrointestinal endoscopy. Gastroenterology. 2010; 138:828–833 e821.
10. Kanda M, Kodera Y. Recent advances in the molecular diagnostics of gastric cancer. World journal of gastroenterology. 2015; 21:9838–9852.
11. Li M, Wang TD. Targeted endoscopic imaging. Gastrointestinal endoscopy clinics of North America. 2009; 19:283–298.
12. Kwon YS, Cho YS, Yoon TJ, Kim HS, Choi MG. Recent advances in targeted endoscopic imaging: Early detection of gastrointestinal neoplasms. World journal of gastrointestinal endoscopy. 2012; 4:57–64.
13. Duraes C, Almeida GM, Seruca R, Oliveira C, Carneiro F. Biomarkers for gastric cancer: prognostic, predictive or targets of therapy? Virchows Archiv. 2014; 464:367–378.
14. Lim L, Michael M, Mann GB, Leong T. Adjuvant therapy in gastric cancer. Journal of clinical oncology. 2005; 23:6220–6232.
15. Doventas A, Bilici A, Demirell F, Ersoy G, Turna H, Doventas Y. Prognostic significance of CD44 and c-erb-B2 protein overexpression in patients with gastric cancer. Hepato-gastroenterology. 2012; 59:2196–2201.
16. Yoshikawa T, Tsuburaya A, Kobayashi O, Sairenji M, Motohashi H, Yanoma S, Noguchi Y. Plasma concentrations of VEGF and bFGF in patients with gastric carcinoma. Cancer letters. 2000; 153:7–12.
17. Xia P, Xu X-Y. Prognostic significance of CD44 in human colon cancer and gastric cancer: Evidence from bioinformatic analyses. Oncotarget. 2016; 7:45538–45546. doi: 10.18632/oncotarget.9998.
18. Wu Y, Li Z, Zhang C, Yu K, Teng Z, Zheng G, Wang S, Liu Y, Cui L, Yu X. CD44 family proteins in gastric cancer: a meta-analysis and narrative review. International journal of clinical and experimental medicine. 2015; 8:3595–3606.
19. Takaishi S, Okumura T, Tu S, Wang SS, Shibata W, Vigneshwaran R, Gordon SA, Shimada Y, Wang TC. Identification of gastric cancer stem cells using the cell surface marker CD44. Stem cells. 2009; 27:1006–1020.
20. Lau WM, Teng E, Chong HS, Lopez KA, Tay AY, Salto-Tellez M, Shabbir A, So JB, Chan SL. CD44v8-10 is a cancer-specific marker for gastric cancer stem cells. Cancer research. 2014; 74:2630–2641.
21. Ghaffarzadehgan K. Expression of cell adhesion molecule CD44 in gastric adenocarcinoma and its prognostic importance. World journal of gastroenterology. 2008; 14:6376.
22. Xin Y, Grace A, Gallagher MM, Curran BT, Leader MB, Kay EW. CD44V6 in gastric carcinoma: a marker of tumor progression. Applied Immunohistochemistry & Molecular Morphology. 2001; 9:138–142.
23. Yong C-S, Yang C-MO, Chou Y-H, Liao C-S, Lee C-W, Lee C-C. CD44/CD24 expression in recurrent gastric cancer: a retrospective analysis. BMC gastroenterology. 2012; 12:1.
24. Cao L, Hu X, Zhang J, Liang P, Zhang Y. CD44(+) CD324(-) expression and prognosis in gastric cancer patients. Journal of surgical oncology. 2014; 110:727–733.
25. Zhang D, Jia H, Wang Y, Li WM, Hou YC, Yin SW, Wang TD, He SX, Lu SY. A CD44 specific peptide developed by phage display for targeting gastric cancer. Biotechnology letters. 2015; 37:2311–2320.
26. Hong RL, Lee WJ, Shun CT, Chu JS, Chen YC. Expression of CD44 and Its Clinical Implication in Diffuse–Type and Intestinal–Type Gastric Adenocarcinomas. Oncology. 1995; 52:334–339.
27. Dacosta RS, Wilson BC, Marcon NE. New optical technologies for earlier endoscopic diagnosis of premalignant gastrointestinal lesions. Journal of gastroenterology and hepatology. 2002; 17:S85–S104.
28. Li M, Zhang B, Zhang Z, Liu X, Qi X, Zhao J, Jiang Y, Zhai H, Ji Y, Luo D. Stem cell-like circulating tumor cells indicate poor prognosis in gastric cancer. BioMed research international. 2014; 2014:981261.
29. Liu L, Yin J, Liu C, Guan G, Shi D, Wang X, Xu B, Tian Z, Zhao J, Nie Y, Wang B, Liang S, Wu K, et al. In vivo molecular imaging of gastric cancer in human-murine xenograft models with confocal laser endomicroscopy using a tumor vascular homing peptide. Cancer letters. 2015; 356:891–898.
30. Pietrantonio F, De Braud F, Da Prat V, Perrone F, Pierotti MA, Gariboldi M, Fanetti G, Biondani P, Pellegrinelli A, Bossi I. A review on biomarkers for prediction of treatment outcome in gastric cancer. Anticancer research. 2013; 33:1257–1266.
31. Mayer B, Jauch K, Schildberg F, Funke I, G¨¹nthert U, Figdor C, Johnson J. De-novo expression of CD44 and survival in gastric cancer. The Lancet. 1993; 342:1019–1022.
32. Lee KJ, Lee JH, Chung HK, Choi J, Park J, Park SS, Ju EJ, Park J, Shin SH, Park HJ, Ko EJ, Suh N, Kim I, et al. Novel peptides functionally targeting in vivo human lung cancer discovered by in vivo peptide displayed phage screening. Amino acids. 2015; 47:281–289.
33. Molckovsky A, Song LM, Shim MG, Marcon NE, Wilson BC. Diagnostic potential of near-infrared Raman spectroscopy in the colon: differentiating adenomatous from hyperplastic polyps. Gastrointestinal endoscopy. 2003; 57:396–402.
34. Neumann H, Kiesslich R, Wallace MB, Neurath MF. Confocal laser endomicroscopy: technical advances and clinical applications. Gastroenterology. 2010; 139:388–392, 392 e381–382.
35. Liu J, Zuo X, Li C, Yu T, Gu X, Zhou C, Li Z, Goetz M, Kiesslich R, Li Y. In vivo molecular imaging of epidermal growth factor receptor in patients with colorectal neoplasia using confocal laser endomicroscopy. Cancer letters. 2013; 330:200–207.
36. Sturm MB, Joshi BP, Lu S, Piraka C, Khondee S, Elmunzer BJ, Kwon RS, Beer DG, Appelman HD, Turgeon DK, Wang TD. Targeted imaging of esophageal neoplasia with a fluorescently labeled peptide: first-in-human results. Science translational medicine. 2013; 5:184ra161.
37. Li G, Xing Y, Wang J, Conti PS, Chen K. Near-infrared fluorescence imaging of CD13 receptor expression using a novel Cy5.5-labeled dimeric NGR peptide. Amino acids. 2014; 46:1547–1556.
38. Miller SJ, Lee CM, Joshi BP, Gaustad A, Seibel EJ, Wang TD. Targeted detection of murine colonic dysplasia in vivo with flexible multispectral scanning fiber endoscopy. Journal of biomedical optics. 2012; 17:021103.
39. Joshi BP, Miller SJ, Lee CM, Seibel EJ, Wang TD. Multispectral endoscopic imaging of colorectal dysplasia in vivo. Gastroenterology. 2012; 143:1435–1437.
40. Li M, Anastassiades CP, Joshi B, Komarck CM, Piraka C, Elmunzer BJ, Turgeon DK, Johnson TD, Appelman H, Beer DG. Affinity peptide for targeted detection of dysplasia in Barrett’s esophagus. Gastroenterology. 2010; 139:1472–1480.
41. Benedict CA, MacKrell AJ, Anderson WF. Determination of the binding affinity of an anti-CD34 single-chain antibody using a novel, flow cytometry based assay. Journal of immunological methods. 1997; 201:223–231.