
Introduction
Acute promyelocytic leukemia (APL) is a distinct subtype of acute myeloid leukemia (AML) accounting for about 5% of all cases. APL is characterized by abnormal promyelocytes infiltrating bone marrow and other hematopoietic organs, and t(15;17) translocation leading to PML-RARα fusion gene [1]. Induction treatment of APL combining all-trans retinoic acid (ATRA) with anthracycline-based chemotherapy induces a complete remission rate of 90–95% and a cure rate of more than 80% [2,3]. However, improving the relapse rate and incidence of early death may pose the greatest challenge for the future management of APL. The current risk-stratification system for APL is based only on the white-cell and platelet count [4], although these parameters could not be confirmed in the German AMLCG trial for younger patients [5]. New molecular biomarkers may help to make a better risk stratification of APL patients and to identify those with a poorer prognosis.
Lymphoid enhancer-binding factor 1 (LEF1) is a downstream effector of the Wnt/β-catenin signaling pathway, which controls cell growth and differentiation [6]. Dysregulation of LEF1 expression may result in several disease patterns, as the Wnt signaling plays a pivotal role in development and cancerogenesis and also controls self-renewal, proliferation and differentiation of many types of stem cells [7]. However, specific functions of LEF1 apart from Wnt signaling have also been reported [8], suggesting that this factor may have a more complex role. In fact, in human CD34+ hematopoietic progenitor cells, inhibition of LEF1 but not of β-catenin, impaired proliferation and apoptosis mechanisms of this cell population, supporting the hypothesis of a β-catenin–independent function of LEF1 in early human myelopoiesis [9]. Recent data in murine model demonstrated that LEF1 is an important factor for hematopoietic stem and progenitor function and that its stem cell regulatory role depends on its DNA binding ability [10].
In normal human hematopoiesis, LEF1 plays a pivotal role not only in the development of B- and T-lymphocytes but also in granulopoiesis. In fact, in healthy individuals LEF1 mRNA levels reached a maximum at the promyelocytic stage of differentiation and declined during the last steps of granulocyte maturation [11]. Recently, deregulated LEF1 expression, as a mediator of the Wnt pathway, has been implicated in leukemic transformation [12]. High LEF1 expression has been reported as a favorable prognostic marker in cytogenetically normal AML [13], whereas it is associated with poor prognosis in adult B precursor acute lymphoblastic leukemia [14] and in chronic lymphocytic leukemia [15,16]. Moreover, a marked downregulation of LEF1 has been associated with disease progression in myelodysplastic syndromes [17]. By contrast, no studies of the prognostic value of LEF1 expression in adult de novo APL have yet been reported. The PML-RARα fusion gene encodes an aberrant transcription factor that shares target genes associated with Wnt signaling [18]. Given the functional role of LEF1 in hematopoiesis and its putative prognostic impact on several hematological malignancies, we evaluated the prognostic significance of LEF1 expression in adult de novo APL.
Results
LEF1 expression and pretreatment patient characteristics
The clinical and biological characteristics of the patients included in the study are listed in Table 1. Patients with LEF1high expression had lower white blood cell (WBC) counts at baseline (1.8 vs 12.0 x10⁹/L; p < 0.0001), and were less likely to carry a FLT3-ITD than LEF1low patients (12.8% vs 35.9%, respectively, p = 0.02). The association between LEF1low and the presence of FLT3-ITD was also confirmed when the 11 (14.1%) patients with FLT3-TKD were included among patients with FLT3 mutations (p = 0.03) or, on the contrary, in the group of FLT3 wild type patients, as compared to those bearing FLT3-ITD (p = 0.03). Early death occurred in 9 (23%) cases in the LEF1low group versus no case in the LEF1high group (OR = 0.04; p= 0.002). Using the PETHEMA relapse risk criteria [16], there were 24 (31%), 40 (51%), and 14 (18%) patients with high, intermediate and low-risk relapse, respectively. LEF1low expression was associated with a higher frequency of a high relapse risk score (53.9% vs 7.7%, OR=0.07; p < 0.0001). The LEF1high group showed a trend toward a statistically significant association with a lower median age (p = 0.08). This trend was confirmed by a statistically significant difference (p = 0.02) when comparing the LEF1 median expression value in patients aged < 60 and > 60 years (Figure 1). No significant differences were observed regarding CD34, CD2, CD56, bcr3 positivity and LEF1 gene expression.
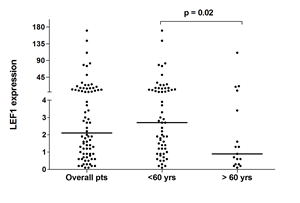
Figure 1: qRT-PCR LEF1 expression in APL patients. Expression of LEF1 in the overall cohort and in the two groups of patients younger than 60 and older than 60 years. Each dot represents a patient. The lines indicate the median for each group.
Table 1: Clinical and molecular features of LEF1 expression in APL patients.
LEFhigh (n = 39) |
LEF1low (n = 39) |
P |
|
Sex M/F |
18/21 |
19/20 |
1 |
Median age, y.rs (range) |
44 (16-75) |
50 (20-88) |
0.08 |
Median WBC, 109/L (range) |
1.8 (0.5-36.5) |
12.0 (0.6-147.0) |
< 0.0001 |
Median PLT, 109/L (range) |
22.0 (4.0-464.0) |
22 (5.0-85.0) |
0.4 |
M3/M3v |
38/1 |
36/3 |
0.6 |
Sanz score Low-Intermediate (%) High (%) |
36 (92.3%) 3 (7.7%) |
18 (46.1%) 21 (53.9%) |
< 0.0001 |
FLT3 mutation status ITD WT TDK |
5 (12.8%) 28 (71.8%) 6 (15.4%) |
14 (35.9%) 19 (48.7%) 6 (15.4%) |
0.02 |
bcr3/bcr1-2 fusion transcript |
19/20 |
16/23 |
0.6 |
CD34 +/- |
13/26 |
9/30 |
0.4 |
CD2 +/- |
7/32 |
11/28 |
0.4 |
CD56 +/- |
3/33 |
3/27 |
1 |
Early death (%) |
0 |
9 (23%) |
0.002 |
Relapse (%) |
8 (20.5%) |
6 (15.3%) |
0.7 |
LEF1 expression and outcome
Among the 78 patients included in the study, the probability of remaining alive after 6 years was 88.4% (95% CI, 77.7%-99.1%) in the LEF1high versus 58.7 % (95% CI, 42.4%-75.1%) in the LEF1low (p=0.007) group (Figure 2A). On the other hand, no differences between the two groups were observed in terms of RFS and CIR (Supplementary Figure S1A). We performed multivariate analyses to determine the prognostic significance of LEF1 expression after adjusting for the impact of other known risk factors. Cox analysis was performed for hazard OS: among all tested factors (age, relapse risk grade, FLT3 mutational status, LEF1 expression) LEF1high expression had an independent prognostic value (HR = 3.4; 95% CI, 1.0-10.5, p=0.03), together with FLT3-ITD (HR = 3.9; 95% CI, 1.2-11.8, p=0.01) and age > 60 y.rs (HR = 6.6; 95% CI, 2.7-16.2, p<0.0001) (Table 2). The recurrence rate in our series was 20%; relapsed patients were distributed equally in the two groups (6 in the LEF1low and 8 in the LEF1high group). Survival analysis of 61 (78%) APL patients < 60 years revealed that the LEF1high group again had a significantly longer OS (p = 0.03) (Figure 2B), whereas no differences were observed between the two groups in terms of RFS and CIR (Supplementary Figure S1B). Cox analysis for OS confirmed only LEF1high expression as an independent prognostic factor (HR=5.4; 95% CI, 1.0 -27.5, p =0.04) (Table 2). Among the 17 (22%) patients over the age of 60 years, those with LEF1high expression showed a higher median survival (6.5 years vs 0.04 years in the LEF1low group, p = 0.05) (Figure 2C). Cox analysis showed no difference in terms of OS between the two groups (Table 3). RFS and CIR analysis were not performed in this subgroup because of low number of patients obtaining CR.
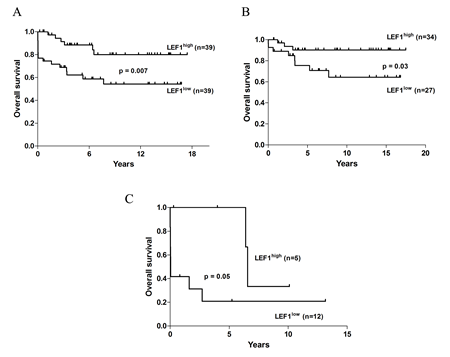
Figure 2: OS analysis of APL patients according to the LEF1 expression value. (A) OS of the entire cohort of APL patients. (B) OS analysis of patients aged younger than 60 years. (C) OS of patients aged older than 60 years.
Table 2: Multivariate analyses according to the Cox proportional hazards model. Results obtained in all 78 APL patients included in the study (top), and in patients younger than 60 years (bottom). HR indicates hazard ratio; CI, confidence interval.
Overall cohort |
||
HR (95% CI) |
P |
|
Variable |
||
Age, <60 vs > 60 years |
6.58 (2.6-16.1) |
<0.0001 |
FLT3, ITD vs WT + TDK |
3.9 (1.2-11.8) |
0.01 |
LEF1 expression, LEF1high vs LEF1low |
3.3 (1.0-10.5) |
0.03 |
Sanz score, L-I vs H |
1.7 (0.5 -5.0) |
0.3 |
Young (<60 years) patients |
||
HR (95% CI) |
P |
|
Variable |
||
LEF1 expression, LEF1high vs LEF1low |
5.4 (1.0-27.0) |
0.04 |
FLT3, ITD vs WT + TDK |
0.4 (0.08-2.0) |
0.2 |
Sanz’s score, L-I vs H |
1.0 (0.2 -3.8) |
0.9 |
Table 3: Results of Cox analysis in the older than 60 years APL patients included in the study. HR indicates hazard ratio; CI, confidence interval.
HR (95% CI) |
P |
|
Variable |
||
LEF1 expression, LEF1high vs LEF1low |
3.7 (0.7- 18.9) |
0.1 |
FLT3, ITD vs WT +TDK |
0.8 (0.1- 3.8) |
0.8 |
Sanz’s score, L-I vs H |
1.4 (0.3 -6.4) |
0.5 |
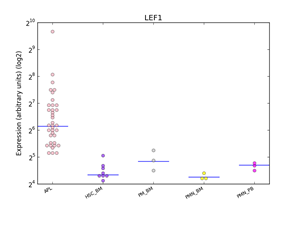
Figure 3: Distributions of LEF1 expression in human haematopoiesis and in APL based on the HemaExplorer platform. Each dot in the plot corresponds to the expression of LEF1 in a microarray experiment. Horizontal lines represent the median expression value for each class of cells. Expression is given on the y-axis on a log2 scale. HSC_BM indicates hematopoietic stem cells from bone marrow; PM_BM, Promyelocytes from bone marrow; PMN_BM, Polymorphonuclear cells from bone marrow; PMN_PB, Polymorphonuclear cells from peripheral blood.
In silico analysis of LEF1 expression in APL
Using the HemaExplorer platform we observed that the LEF1 gene expression median value was higher than in human physiological hematopoiesis (Figure 3). In silico analysis of the differential expression of the LEF1 gene in APL identified 9 differentially expressed, up-modulated genes (ETS1, FAIM3, CCR7, IL7R, LCK, IL2RB, ITK, RASGRP1, TRBC1), associated with a high expression of LEF1 (Figure 4); GO analysis revealed that the majority of these genes is involved in the regulation of apoptosis (FAIM3, IL2RB, LCK, ETS1).
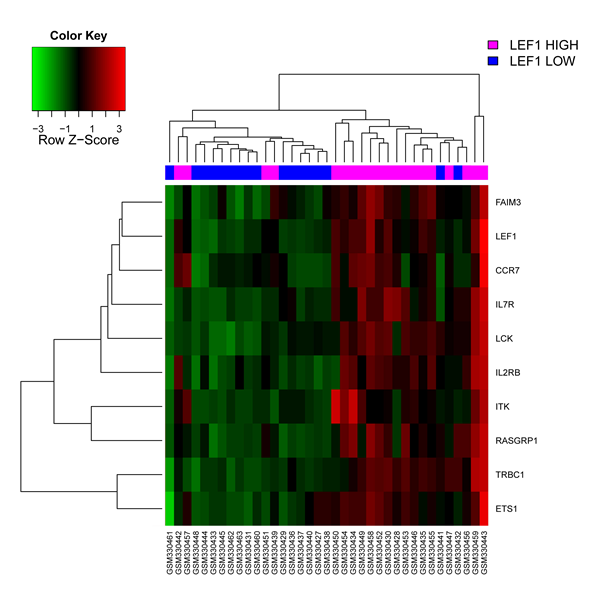
Figure 4: In silico analysis of LEF1 expression in APL. Heatmap image of the 9 differentially expressed genes associated with higher LEF1 expression levels. Each column represents 1 of the 37 APL patients.
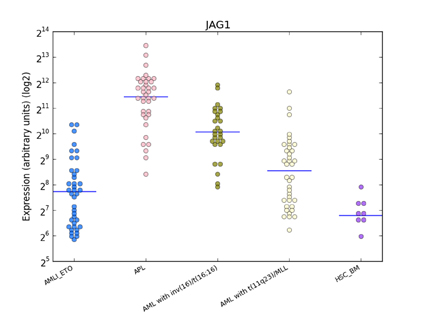
Figure 5: Distribution of JAG1 expression in human haematopoiesis and in AML based on the HemaExplorer platform. Each dot in the plot corresponds to the JAG1 expression in a microarray experiment. Horizontal lines represent the median expression value for each class of cells. Expression is given on the y-axis on a log2 scale. HSC_BM indicates hematopoietic stem cells from bone marrow; PM_BM, promyelocytes from bone marrow; AMLI_ETO, AML with t(8;21); APL, AML with t(15;17); AML with inv(16)/t(16;16), AML with inv(16)/t(16;16); AML with t(11q23)/MLL, AML with t(11q23)/MLL.
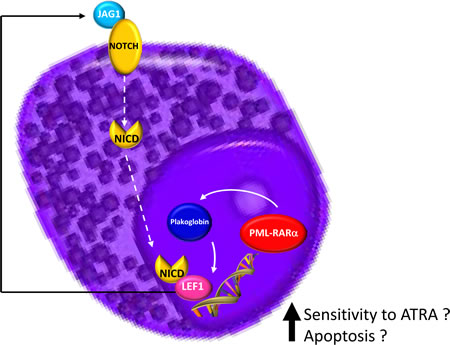
Figure 6: Schematic model summarizing the hypothesis at the basis of LEF1 gene overexpression in APL.
Discussion
To our knowledge, this is the first study to examine LEF1 expression in a large cohort of APL patients and its correlation with clinical features and outcome. The association of LEF1high status with a longer OS was confirmed in multivariate analyses adjusting for the most important prognostic factors in APL, such as age, FLT3 status and Sanz score. This fact indicates that LEF1 gene expression analysis is capable of discriminating APL patients with a poor outcome. In a recent paper analyzing 17 APL cases it was reported that patients with PML-RARα or AML1-ETO fusion genes had higher LEF1 expression levels compared with AML cases without these translocations [19]. No data analysis was performed on the association between LEF1 expression and clinical or biological features. The survival rate of APL elderly patients (>60 y.rs) is still controversial. While the European APL Group (EAG) and GIMEMA demonstrated that the survival rate of elderly APL was lower than that of younger patients [20,21], the PETHEMA group reported no significant difference [22]. Moreover, recently the Japan Adult Leukemia Study Group (JALSG) demonstrated that elderly APL patients were more prone to develop complications, which resulted in a lower OS [23]. Such evidence prompted us firstly to analyze the associations between LEF1 gene expression and survival in the entire cohort and then to perform survival analysis by age (< 60 and > 60 y.rs). In both cases, the analysis showed that the LEF1high group had a better outcome in terms of OS, revealing that LEF1high status was a favorable prognostic marker in both age groups. Concerning patients younger than 60 years, two points should be highlighted: the first one is that these data were confirmed by multivariate analysis; secondly, the worst OS in the LEF1low group cannot be explained by the association with ED, as only two cases of ED were observed in the younger than 60 years group.
Moreover, a higher proportion of patients in the LEF1low group died before reaching first CR due to severe bleeding/infections and/or differentiation syndrome. It has been reported that these events are influenced mainly by older age, FLT3-ITD mutation status, WBC and platelet count at diagnosis [24-26]. According to these parameters, among the 9 patients who died early, 7 (77.7%) were classified as high risk and elderly, and 3 (33.3%) were FLT3-ITD positive. Of note, all patients belonged to the LEF1low group. Therefore, our data indicate that LEF1 gene expression, related to the Sanz score, age and the FLT3-ITD mutation, may be involved in the biological processes that underlie the prompt response to treatment, and that patients with low LEF1 expression showed a significantly poorer outcome. We found that FLT3-ITD mutations are associated with low LEF1 expression. This finding is in agreement with previous data describing this association in cytogenetically normal AML patients [13]. The prognostic significance of the FLT3-ITD mutation in APL remains controversial, as conflicting results have so far been reported about the correlation between FLT3 status and OS. In fact, while some studies reported no association with outcome [26], others reported a poor outcome for FLT3-ITD-positive APL patients [27-30]. It is noteworthy that in our multivariate analysis performed on the two different patient groups according to age, the presence of the FLT3-ITD mutation was not associated with differences in terms of OS.
Dysregulated Wnt signaling has been identified in primary AML blasts, where it has been associated with poor survival [31-33]. If we consider LEF1 expression as an activator of the Wnt pathway how can we explain, from a biological point of view, the paradoxical association in APL patients of a higher LEF1 gene expression with a better prognosis? A possible explanation for this is that LEF1 gene expression in the APL context is not a mark of a deregulated Wnt signaling. It has been reported that the PML-RARα fusion gene (but also PLZF-RARα and AML1-ETO) can induce plakoglobin (γ-catenin) expression in cell lines as well as in primary patient samples, resulting in transcriptional activation of LEF1 [18]. The recent discovery made during a study of the mechanisms at the basis of the differentiation of bulge stem cells is intriguing. Indeed, it has been observed that LEF1 crosstalks with the Notch signaling pathway, as JAG1 is its downstream target [34]. This information is particularly relevant because it is known that JAG1 is more strongly expressed in APL than in other AML subtypes [35] and that it is rapidly downregulated by ATRA treatment of NB4 cells and primary APL blasts [36,37]. JAG1 upregulation in APL was also confirmed by our bioinformatics analysis (Figure 5). Moreover, recent findings support the hypothesis that Notch signaling is important in the pathogenesis of APL. In fact, bioinformatics analysis showed a Notch signature in both human APL and in mouse model cells, and experiments revealed that Notch inhibition blocked the enhanced self renewal in a pre-leukemic PML-RARα murine model [38]. Therefore, these data suggest that Notch signaling is a key downstream target of PML-RARα. Further evidence of the relationship between LEF1 and Notch signaling is the finding that the Notch intracellular domain (NICD) has been identified as a coactivator of LEF1; the effects of Notch on LEF1 activity are direct and not due to modulation of components of the Wnt signaling cascade [8]. Taken together, these data allow us to hypothesize a LEF1 pathogenetic role in the context of APL (Figure 6).
Our in silico analysis revealed that LEF1high status is characterized by an upregulation of genes that are differentially expressed in this group of patients, mostly linked to B-T cell function. It is noteworthy that 6 (CCR7, IL7R, LCK, IL2RB, ITK, RASGRP1) of the 9 genes were included among the signature of the 200 genes showing the strongest absolute correlation with LEF1 expression levels in cytogenetically normal AML [13]. GO analysis showed that some of them are involved in apoptosis regulation mechanisms. This fact might explain the association between a high LEF1 gene expression and lower WBC count. The ETS1 gene has been described to contribute to human granulocytic differentiation. During the ATRA-induced granulocytic differentiation process in human NB4 promyelocytic and HL60 myeloblastic leukemia cell lines, the Ets-1 oncogenic protein is both down-regulated and inactivated; on the other hand, ETS1 overexpression induces apoptosis [39].
Our data suggest that LEF1 plays a role in APL but this circumstance is probably linked to stem cell aging. Unlike other forms of AML, APL is less frequently diagnosed in the elderly, indeed the median age at presentation is usually 40-45 years [40]. The observation in our study that LEF1 overexpression is related with age suggests that the mechanisms underlying the APL pathogenesis may be different and age-related.
In conclusion, our study has shown that LEF1 expression is a strong independent OS prognostic factor in APL; LEF1 expression was measured by qRT-PCR, a routine technique in most diagnostic laboratories and therefore easy to use in clinical applications. It could therefore be useful to improve risk stratification and to develop better tailored treatment strategies in APL patients affected by LEF1 low expression [41]. The observation, provided by in silico gene expression analysis, that LEF1 expression is associated with biologic changes, mostly in terms of apoptosis regulation, will need to be experimentally confirmed, as well as the mechanisms regulating LEF1 and their role in the pathogenesis of APL.
Methods
Patients
One hundred and three consecutive patients with newly diagnosed APL were observed and treated with the AIDA-0493 [42] and AIDA-2000 [3] protocols at the Hematology Section, Bari University Hospital, between January 1996 and December 2012. The diagnosis was initially morphological and was confirmed in all cases by detection of the PML-RARα fusion gene as reported [43]. LEF1 expression analysis by quantitative real-time PCR (qRT-PCR) was performed in 78 patients with sufficient available material (median age 45 years, range 16 to 88 years; 37 males and 41 females). The median follow-up time was 5.7 years for the entire cohort. All treatments were administered in accordance with the Declaration of Helsinki and approved by the institutional local review board, and all patients provided written informed consent. All 78 patients started induction treatment but 9 (11.5%) died within 30 days of admission (4 of them before definitive therapy could be instituted), 7 (8.9%) patients due to hemorrhagic/infective complications and 2 (2.5%) patients to the differentiation syndrome.
Molecular analyses
Total RNA derived from bone marrow (BM) cells was reverse transcribed into cDNA using the QuantiTect reverse transcription kit (Qiagen, Chatsworth, CA, USA). Gene expression analysis was carried out by qRT-PCR experiments using the LightCycler 480 Probes Master mix on the LightCycler 480II (Roche Diagnostics, Indianapolis, IN, USA). All samples were run in triplicate as technical replicates; a pool of cDNA derived from BM cells of 5 healthy individuals was used as calibrator. LEF1 expression was measured using a RealTime intron-spanning ready assay recognizing all 4 major human LEF1 isoforms (assay ID 103366, Roche), and normalized to GUSB (β-glucuronidase) expression (assay ID 144221, Roche). Amplifications were carried out at 95°C for 10 min, followed by 45 cycles of 95°C (10 sec), 60°C (30 sec), 72°C (1 sec). Advanced relative quantification analysis was performed using the LightCycler 480 Software 1.5.1, based on the ∆∆Ct method.
FLT3 (ITD and TKD) mutations were investigated on total BM RNA by allele specific oligonucleotide (ASO) - PCR and PCR followed by enzymatic digestion [44,45].
Immunophenotypic analyses
Leukemic cell analysis was performed on bone marrow cells by standard immunofluorescence methods using monoclonal antibodies directed against CD2, CD3, CD4, CD5, CD7, CD8, CD10, CD11b, CD13, CD14, CD15, CD16, CD19, CD33, CD34, CD45, CD56, CD117, and HLA-DR (Becton Dickinson, Milan, Italy). All cases were studied by direct immunofluorescence. Flow cytometric analysis was performed on a FACSCantoTM II flow cytometer (Becton Dickinson Immunocytometry System, Mountain View, CA, USA). A sample was considered antigen-positive if ≥ 20% of the leukemic cells reacted with a particular monoclonal antibody.
Statistical Analyses
APL samples were dichotomized at the median value and divided into two expression groups: a low LEF1 group (LEF1low) with LEF1 values below the median value (< 2.1 fold change) and a high LEF1 group (LEF1high) with LEF1 values above the median value (> 2.1 fold change). Clinical and biological features between groups were compared using the Fisher exact test for categorical data and the nonparametric Mann-Whitney U test for continuous variables. A p value <0.05 was considered significant. Survival curves were calculated by the Kaplan-Meier method with log-rank comparing differences between survival curves. Overall survival (OS) endpoints, measured from the date of diagnosis, were dead or alive at last follow-up. Relapse-free survival (RFS) was counted from the achievement of documented complete remission (CR) until relapse or death due to any cause, both considered uncensored events. The cumulative incidence of relapse (CIR) was estimated with the use of the proper nonparametric estimator, and between-group comparisons were performed with Gray’s K-sample test [46,47]. Multivariable Cox proportional hazards models were used to study factors (LEF1 expression, FLT3 mutation status, age and relapse risk grade) associated with survival endpoints; no variable selection technique was used, and all variables remained in the multivariable model. Statistical analyses were carried out using GraphPad Prism version 6.01 for Windows (GraphPad Software, San Diego, CA) and XLSTAT version 2013.4.05 (AddinsoftTM).
In silico analysis of the biological role of LEF1 in APL
We examined LEF1 and Notch ligand Jagged-1 (JAG1) gene expression in human hematopoiesis and in APL using the HemaExplorer platform [48]. To evaluate the biological impact of LEF1 differential expression in APL, we downloaded raw data from the publicly available dataset GSE13159 (Affymetrix HG-U133_Plus_2, available on the Gene Expression Omnibus,GEO, repository, http://www.ncbi.nlm.nih.gov/geo/); the dataset reported gene expression and clinical annotated data of 37 APL patients [49]. Raw gene expression data of APL patients were analyzed using R statistical language version 3.0.1 (URL http://www.r-project.org/). All samples were normalized and summarized with the Robust Multichip Average (RMA) normalization method. The mean intensity of the three probe sets for LEF1 was calculated, and the one with the highest mean, 221558_s_at, was used to measure LEF1 expression levels and to classify the samples into two groups: low or high LEF1 expression, on the basis of the median expression value. Filtering was performed according to genes variability, and probe sets with an InterQuartile Range (IQR) <0.5 and without the associated gene symbol were excluded. To collapse and convert probe sets level expression data to gene-level, the probe set with the highest mean intensity for each gene was considered. After filtering and collapsing, 9990 probe sets were detected. Empirical Bayes t-test for Class Comparison analysis, imposing a False Discovery Rate (FDR) of <0.05 (p value adjustment method= Benjamini–Hochberg) identified the differentially expressed and up-modulated genes associated with a high expression of LEF1. Gene Ontology (GO) analysis was performed using the DAVID web server (http://david.abcc.ncifcrf.gov/) [50]. Only GO terms with a p-value < 0.01 were considered enriched and shown.
Acknowledgments
This work was supported by “Associazione Italiana contro le Leucemie (AIL)-BARI”.
The authors would like to thank Ms. MVC Pragnell, B.A. for language revision of the manuscript.
References
1. Sanz MA, Grimwade D, Tallman MS, Lowenberg B, Fenaux P, Estey EH, Naoe T, Lengfelder E, Büchner T, Döhner H, Burnett AK, Lo-Coco F. Management of acute promyelocytic leukemia: recommendations from an expert panel on behalf of the European LeukemiaNet. Blood. 2009; 113: 1875-1891.
2. Sanz MA, Martín G, González M, León A, Rayón C, Rivas C, Colomer D, Amutio E, Capote FJ, Milone GA, De La Serna J, Román J, Barragán E, Bergua J, Escoda L, Parody R, et al. Risk-adapted treatment of acute promyelocytic leukemia with all-trans-retinoic acid and anthracycline monochemotherapy: a multicenter study by the PETHEMA group. Blood. 2004; 103: 1237-1243.
3. Lo-Coco F, Avvisati G, Vignetti M, Breccia M, Gallo E, Rambaldi A, Paoloni F, Fioritoni G, Ferrara F, Specchia G, Cimino G, Diverio D, Borlenghi E, Martinelli G, Di Raimondo F, et al. Front-line treatment of acute promyelocytic leukemia with AIDA induction followed by risk-adapted consolidation for adults younger than 61 years: results of the AIDA-2000 trial of the GIMEMA Group. Blood. 2010; 116: 3171–3179.
4. Sanz MA, Lo Coco F, Martín G, Avvisati G, Rayón C, Barbui T, Díaz-Mediavilla J, Fioritoni G, González JD, Liso V, Esteve J, Ferrara F, Bolufer P, Bernasconi C, Gonzalez M, Rodeghiero F, et al. Definition of relapse risk and role of non anthracycline drugs for consolidation in patients with acute promyelocytic leukemia: a joint study of the PETHEMA and GIMEMA cooperative groups. Blood. 2000; 96: 1247-1253.
5. Lengfelder E, Haferlach C, Saussele S, Haferlach T, Schultheis B, Schnittger S, Ludwig WD, Staib P, Aul C, Grüneisen A, Kern W, Reichle A, Serve H, Berdel WE, Braess J, Spiekermann K, et al. High dose ara-C in the treatment of newly diagnosed acute promyelocytic leukemia: long-term results of the German AMLCG. Leukemia. 2009; 23: 2248–2258.
6. Reya T, Clevers H. Wnt signalling in stem cells and cancer. Nature. 2005; 434: 843-850.
7. Holland JD, Klaus A, Garratt AN, Birchmeier W. Wnt signaling in stem and cancer stem cells. Curr Opin Cell Biol. 2013; 25: 254-264.
8. Ross DA, Kadesch T. The notch intracellular domain can function as a coactivator for LEF-1. Mol Cell Biol. 2001; 21: 7537-7544.
9. Skokowa J, Cario G, Uenalan M, Schambach A, Germeshausen M, Battmer K, Zeidler C, Lehmann U, Eder M, Baum C, Grosschedl R, Stanulla M, Scherr M, Welte K. LEF-1 is crucial for neutrophil granulocytopoiesis and its expression is severely reduced in congenital neutropenia. Nat Med. 2006; 12: 1191-1197.
10. Edmaier KE, Stahnke K, Vegi N, et al. Expression of the lymphoid enhancer factor 1 (Lef-1) is required for normal hematopoietic stem and progenitor cell function. Leukemia. 2013. doi:10.1038/leu.2013.238.
11. Skokowa J, Welte K. LEF-1 is a decisive transcription factor in neutrophil granulopoiesis. Ann N Y Acad Sci. 2007; 1106: 143-151.
12. Petropoulos K, Arseni N, Schessl C, Stadler CR, Rawat VP, Deshpande AJ, Heilmeier B, Hiddemann W, Quintanilla-Martinez L, Bohlander SK, Feuring-Buske M, Buske C. A novel role for Lef-1, a central transcription mediator of Wnt signaling, in leukemogenesis. J Exp Med. 2008; 205: 515-522.
13. Metzeler KH, Heilmeier B, Edmaier KE, Rawat VP, Dufour A, Döhner K, Feuring-Buske M, Braess J, Spiekermann K, Büchner T, Sauerland MC, Döhner H, Hiddemann W, Bohlander SK, Schlenk RF, Bullinger L, et al. High expression of lymphoid enhancer-binding factor-1 (LEF1) is a novel favorable prognostic factor in cytogenetically normal acute myeloid leukemia. Blood. 2012; 120: 2118-2126.
14. Kühnl A, Gökbuget N, Kaiser M, Schlee C, Stroux A, Burmeister T, Mochmann LH, Hoelzer D, Hofmann WK, Thiel E, Baldus CD. Overexpression of LEF1 predicts unfavorable outcome in adult patients with B-precursor acute lymphoblastic leukemia. Blood. 2011; 118: 6362-6367.
15. Erdfelder F, Hertweck M, Filipovich A, Uhrmacher S, Kreuzer KA. High lymphoid enhancer-binding factor-1 expression is associated with disease progression and poor prognosis in chronic lymphocytic leukemia. Hematol Rep. 2010; 2: e3.
16. Gutierrez A Jr, Tschumper RC, Wu X, Shanafelt TD, Eckel-Passow J, Huddleston PM 3rd, Slager SL, Kay NE, Jelinek DF. LEF-1 is a prosurvival factor in chronic lymphocytic leukemia and is expressed in the preleukemic state of monoclonal B-cell lymphocytosis. Blood. 2010; 116: 2975-2983.
17. Pellagatti A, Marafioti T, Paterson JC, Malcovati L, Della Porta MG, Jädersten M, Pushkaran B, George TI, Arber DA, Killick S, Giagounidis A, Hellström-Lindberg E, Cazzola M, Wainscoat JS, Boultwood J. Marked downregulation of the granulopoiesis regulator LEF1 is associated with disease progression in the myelodysplastic syndromes. Br J Haematol. 2009; 146: 86-90.
18. Müller-Tidow C, Steffen B, Cauvet T, Tickenbrock L, Ji P, Diederichs S, Sargin B, Köhler G, Stelljes M, Puccetti E, Ruthardt M, deVos S, Hiebert SW, Koeffler HP, Berdel WE, Serve H. Translocation products in acute myeloid leukemia activate the Wnt signaling pathway in haematopoietic cells. Mol Cell Biol. 2004; 24: 2890-2904.
19. Fu Y, Zhu H, Wu W, Xu J, Chen T, Xu B, Qian S, Li J, Liu P. Clinical significance of lymphoid enhancer-binding factor 1 expression in acute myeloid leukemia. Leuk Lymphoma. 2013. doi:10.3109/10428194.2013.805759.
20. Edmaier Ades L, Chevret S, De Botton S, Thomas X, Dombret H, Beve B, Sanz M, Guerci A, Miguel JS, Dela Serna J, Garo C, Stoppa AM, Reman O, Stamatoulas A, Fey M, Cahn JY, et al. Outcome of acute promyelocytic leukemia treated with all trans retinoic acid and chemotherapy in elderly patients: the European group experience. Leukemia. 2005; 19: 230-233.
21. Mandelli F, Latagliata R, Avvisati G, Fazi P, Rodeghiero F, Leoni F, Gobbi M, Nobile F, Gallo E, Fanin R, Amadori S, Vignetti M, Fioritoni G, Ferrara F, Peta A, Giustolisi R, et al. Treatment of elderly patients (> or = 60 years) with newly diagnosed acute promyelocytic leukemia. Results of the Italian multicenter group GIMEMA with ATRA and idarubicin (AIDA) protocols. Leukemia. 2003; 17: 1085-1090.
22. Sanz MA, Vellenga E, Rayón C, Díaz-Mediavilla J, Rivas C, Amutio E, Arias J, Debén G, Novo A, Bergua J, de la Serna J, Bueno J, Negri S, Beltrán de Heredia JM, Martín G. All-trans retinoic acid and anthracycline monochemotherapy for the treatment of elderly patients with acute promyelocytic leukemia. Blood. 2004; 104: 3490-3493.
23. Ono T, Takeshita A, Kishimoto Y, Kiyoi H, Okada M, Yamauchi T, Tsuzuki M, Horikawa K, Matsuda M, Shinagawa K, Monma F, Ohtake S, Nakaseko C, Takahashi M, Kimura Y, Iwanaga M, et al. Long-term outcome and prognostic factors of elderly patients with acute promyelocytic leukemia. Cancer Sci. 2012; 103: 1974-1978.
24. de la Serna J, Montesinos P, Vellenga E, Rayón C, Parody R, León A, Esteve J, Bergua JM, Milone G, Debén G, Rivas C, González M, Tormo M, Díaz-Mediavilla J, González JD, Negri S, et al. Causes and prognostic factors of remission induction failure in patients with acute promyelocytic leukemia treated with all-trans retinoic acid and idarubicin. Blood. 2008; 111: 3395-3402.
25. Lehmann S, Ravn A, Carlsson L, Antunovic P, Deneberg S, Möllgård L, Derolf AR, Stockelberg D, Tidefelt U, Wahlin A, Wennström L, Höglund M, Juliusson G. Continuing high early death rate in acute promyelocytic leukemia: a population-based report from the Swedish Adult Acute Leukemia Registry. Leukemia. 2011; 25: 1128-1134.
26. Gale RE, Hills R, Pizzey AR, Kottaridis PD, Swirsky D, Gilkes AF, Nugent E, Mills KI, Wheatley K, Solomon E, Burnett AK, Linch DC, Grimwade D; NCRI Adult Leukaemia Working Party. Relationship between FLT3 mutation status, biologic characteristics, and response to targeted therapy in acute promyelocytic leukemia. Blood. 2005; 106: 3768-3776.
27. Chillón MC, Santamaría C, García-Sanz R, Balanzategui A, Sarasquete ME, Alcoceba M, Marín L, Caballero MD, Vidriales MB, Ramos F, Bernal T, Díaz-Mediavilla J, García de Coca A, Peñarrubia MJ, Queizán JA, Giraldo P, et al. Long FLT3 internal tandem duplications and reduced PML-RARα expression at diagnosis characterize a high-risk subgroup of acute promyelocytic leukemia patients. Haematologica. 2010; 95: 745-751.
28. Schnittger S, Bacher U, Haferlach C, Kern W, Alpermann T, Haferlach T. Clinical impact of FLT3 mutation load in acute promyelocytic leukemia with t(15;17)/PMLRARA. Haematologica. 2011; 96: 1799-1807.
29. Barragán E, Montesinos P, Camos M, González M, Calasanz MJ, Román-Gómez J, Gómez-Casares MT, Ayala R, López J, Fuster Ó, Colomer D, Chillón C, Larrayoz MJ, Sánchez-Godoy P, González-Campos J, Manso F, et al. Prognostic value of FLT3 mutations in patients with acute promyelocytic leukemia treated with all-trans retinoic acid and anthracycline monochemotherapy. Haematologica. 2011; 96: 1470-1477.
30. Hong SD, Kim YK, Kim HN, Lee SR, Ahn JS, Yang DH, Lee JJ, Lee IK, Shin MG, Kim HJ. Treatment outcome of all-trans retinoic acid/anthracycline combination chemotherapy and the prognostic impact of FLT3/ITD mutation in acute promyelocytic leukemia patients. Korean J Hematol. 2011; 46: 24-30.
31. Ysebaert L, Chicanne G, Demur C, De Toni F, Prade-Houdellier N, Ruidavets JB, Mansat-De Mas V, Rigal-Huguet F, Laurent G, Payrastre B, Manenti S, Racaud-Sultan C. Expression of beta-catenin by acute myeloid leukemia cells predicts enhanced clonogenic capacities and poor prognosis. Leukemia. 2006; 20: 1211–1216.
32. Xu J, Suzuki M, Niwa Y, Hiraga J, Nagasaka T, Ito M, Nakamura S, Tomita A, Abe A, Kiyoi H, Kinoshita T, Naoe T. Clinical significance of nuclear non-phosphorylated beta-catenin in acute myeloid leukaemia and myelodysplastic syndrome. Br J Haematol. 2008; 140: 394-401.
33. Chen CC, Gau JP, You JY, Lee KD, Yu YB, Lu CH, Lin JT, Lan C, Lo WH, Liu JM, Yang CF. Prognostic significance of beta-catenin and topoisomerase IIalpha in de novo acute myeloid leukemia. Am J Hematol. 2009; 84: 87-92.
34. Zhang Y, Yu J, Shi C, Huang Y, Wang Y, Yang T, Yang J. Lef1 contributes to the differentiation of bulge stem cells by nuclear translocation and cross-talk with the Notch signaling pathway. Int J Med Sci. 2013; 10: 738-746.
35. Payton JE, Grieselhuber NR, Chang LW, Murakami M, Geiss GK, Link DC, Nagarajan R, Watson MA, Ley TJ. High throughput digital quantification of mRNA abundance in primary human acute myeloid leukemia samples. J Clin Invest. 2009; 119: 1714-1726.
36. Alcalay M, Meani N, Gelmetti V, Fantozzi A, Fagioli M, Orleth A, Riganelli D, Sebastiani C, Cappelli E, Casciari C, Sciurpi MT, Mariano AR, Minardi SP, Luzi L, Muller H, Di Fiore PP, et al. Acute myeloid leukemia fusion proteins deregulate genes involved in stem cell maintenance and DNA repair. J Clin Invest. 2003; 112: 1751-1761.
37. Meani N, Minardi S, Licciulli S, Gelmetti V, Coco FL, Nervi C, Pelicci PG, Müller H, Alcalay M. Molecular signature of retinoic acid treatment in acute promyelocytic leukemia. Oncogene. 2005; 24: 3358-3368.
38. Grieselhuber NR, Klco JM, Verdoni AM, Lamprecht T, Sarkaria SM, Wartman LD, Ley TJ. Notch signaling in acute promyelocytic leukemia. Leukemia. 2013; 27: 1548-1557.
39. Lulli V, Romania P, Riccioni R, Boe A, Lo-Coco F, Testa U, Marziali G. Transcriptional silencing of the ETS1 oncogene contributes to human granulocytic differentiation. Haematologica. 2010; 95: 1633-1641.
40. Alcalay M, Zangrilli D, Fagioli M, Pandolfi PP, Mencarelli A, Lo Coco F, Biondi A, Grignani F, Pelicci PG. Expression pattern of the RAR alpha-Pml fusion gene in acute promyelocytic leukemia. Proc Natl Acad Sci USA. 1992; 89: 4840-4844.
41. Lo-Coco F, Avvisati G, Vignetti M, Thiede C, Orlando SM, Iacobelli S, Ferrara F, Fazi P, Cicconi L, Di Bona E, Specchia G, Sica S, Divona M, Levis A, Fiedler W, Cerqui E, et al. Retinoic acid and arsenic trioxide for acute promyelocytic leukemia. N Engl J Med. 2013; 369: 111-121.
42. Avvisati G, Lo-Coco F, Paoloni FP, Petti MC, Diverio D, Vignetti M, Latagliata R, Specchia G, Baccarani M, Di Bona E, Fioritoni G, Marmont F, Rambaldi A, Di Raimondo F, Kropp MG, Pizzolo G, et al. AIDA 0493 protocol for newly diagnosed acute promyelocytic leukemia: very long-term results and role of maintenance. Blood. 2011; 117: 4716-4725.
43. van Dongen JJ, Macintyre EA, Gabert JA, Delabesse E, Rossi V, Saglio G, Gottardi E, Rambaldi A, Dotti G, Griesinger F, Parreira A, Gameiro P, Diáz MG, Malec M, Langerak AW, San Miguel JF, Biondi A. Standardized RT-PCR analysis of fusion gene transcripts from chromosome aberrations in acute leukemia for detection of minimal residual disease. Report of the BIOMED-1 Concerted Action: investigation of minimal residual disease in acute leukemia. Leukemia. 1999; 13: 1901-1928.
44. Nakao M, Yokota S, Iwai T, Kaneko H, Horiike S, Kashima K, Sonoda Y, Fujimoto T, Misawa S. Internal tandem duplication of the flt3 gene found in acute myeloid leukemia. Leukemia. 1996; 10: 1911-1918.
45. Yamamoto Y, Kiyoi H, Nakano Y, Suzuki R, Kodera Y, Miyawaki S, Asou N, Kuriyama K, Yagasaki F, Shimazaki C, Akiyama H, Saito K, Nishimura M, Motoji T, Shinagawa K, Takeshita A, et al. Activating mutation of D835 within the activation loop of FLT3 in human hematologic malignancies. Blood. 2001; 97: 2434-2439.
46. Gray RJ. A class of K-sample tests for comparing the cumulative incidence of a competing risk. Ann Statist. 1988; 16: 1141-1154.
47. Kim HT. Cumulative incidence in competing risks data and competing risks regression analysis. Clin Cancer Res. 2007; 13: 559-565.
48. Bagger FO, Rapin N, Theilgaard-Mönch K, Kaczkowski B, Jendholm J, Winther O, Porse B. HemaExplorer: a Web server for easy and fast visualization of gene expression in normal and malignant hematopoiesis. Blood. 2012; 119: 6394-6395.
49. Kohlmann A, Kipps TJ, Rassenti LZ, Downing JR, Shurtleff SA, Mills KI, Gilkes AF, Hofmann WK, Basso G, Dell’orto MC, Foà R, Chiaretti S, De Vos J, Rauhut S, Papenhausen PR, Hernández JM, et al. An international standardization programme towards the application of gene expression profiling in routine leukaemia diagnostics: the Microarray Innovations in LEukemia study prephase. Br J Haematol. 2008; 142: 802-807.
50. Dennis G Jr, Sherman BT, Hosack DA, Yang J, Gao W, Lane HC, Lempicki RA. DAVID: Database for Annotation, Visualization, and Integrated Discovery. Genome Biol. 2003; 4: P3.