
INTRODUCTION
There were an estimated 14.1 million new cancer cases and 8.2 million cancer-related deaths in 2012 worldwide [1, 2]. Although recent advances in the diagnosis and treatment of various cancers have improved patient prognosis, most malignancies still impose a heavy burden on society. Cancer is a multifactorial, chronic disease caused by both endogenous (genetic, immune, and endocrine disorders) and exogenous factors (environmental carcinogens and unhealthy behaviors) [1]. Among these etiological factors, gene-environment interactions have been shown to play key roles in cancer development.
The maintenance of genomic integrity is essential for human health. However, DNA damage can occur due to exposure to various chemicals, environmental agents, and ultraviolet radiation. DNA damage can also occur naturally. For example, metabolic processes can generate compounds that damage DNA, which include reactive oxygen and reactive nitrogen species. There are five major DNA damage repair pathways in humans: nucleotide excision repair (NER), base excision repair, double-strand break repair, mismatch repair, and homologous recombination [3]. Failure to properly repair DNA damage can lead to tumorigenesis. The versatile NER pathway is responsible for excising DNA lesions including cross-links, bulky adducts, thymidine dimers, alkylating damage, and oxidative DNA damage [3].
There are at least eight core functional genes in the NER pathway. These include Excision repair cross complementing group 1 (ERCC1) and Xeroderma pigmentosum group (XP) A-G. XPG, also known as ERCC5, is located on chromosome 13q22-q33 [4]. The XPG gene encodes a single-strand specific DNA endonuclease of 1,186 amino acids that cleaves the damaged DNA strand at the 3’ end [5]. Defects in the XPG gene can impair DNA repair resulting in genomic instability and carcinogenesis [6]. Single nucleotide polymorphisms (SNPs) in the XPG gene have been associated with various cancers including colorectal [7], lung [8, 9], gastric [10, 11], and laryngeal [12]. However, different studies have achieved conflicting results. For example, Duan et al. found that rs2296147 T>C in XPG was associated with an increased risk of gastric cancer [13], but this association was not replicated in other studies [10, 11]. The discordances might be attributed to the limited sample sizes of individual studies, different sources of controls, and ethnic variation. In this study, we performed a meta-analysis of the associations between six potentially functional SNPs: rs1047768 T>C, rs2296147 T>C, rs2227869 G>C, rs2094258 C>T, rs751402 C>T, and rs873601 G>A in the XPG gene and the risk of cancer.
RESULTS
Study characteristics
A total of 215 articles were identified using the Web of Science, Scopus, and PubMed. An additional 26 potential relevant articles were identified in the CNKI and WanFang databases. After screening the titles and abstracts, 135 studies remained for further full-text review. We excluded 17 meta-analyses and reviews as well as 69 studies that did not assess the SNPs of interest. A detailed assessment was then performed of 49 studies. Two of these studies were removed, one because there was a lack of detailed genotype data and the other because of study population overlap. The final meta-analysis included 47 articles. There were 22 articles with 12,833 cases and 151,86 controls for rs1047768 T>C [7-9, 12, 14-31], 14 studies with 11,327 cases and 12,684 controls for rs2296147 T>C [9-11, 13, 18, 24, 26-28, 32-37], 11 studies with 5,898 cases and 7,448 controls for rs2227869 G>C [8, 9, 14, 17, 18, 20, 22, 25, 38-40], 17 studies with 9,826 cases and 10,552 controls for rs2094258 C>T [10, 11, 18, 24, 26-28, 34-37, 41-46], 21 studies with 10,369 cases and 11,207 controls for rs751402 C>T [10, 13, 24, 26-29, 31, 32, 36, 37, 42-45, 47-52], and 14 studies with 10,873 cases and 12,535 controls for rs873601 G>A [9-11, 18, 24, 26-28, 32, 34, 36, 52-54]. A flow chart summarizing the process of relevant study identification is shown in Figure 1, and the study characteristics are shown in Table 1.
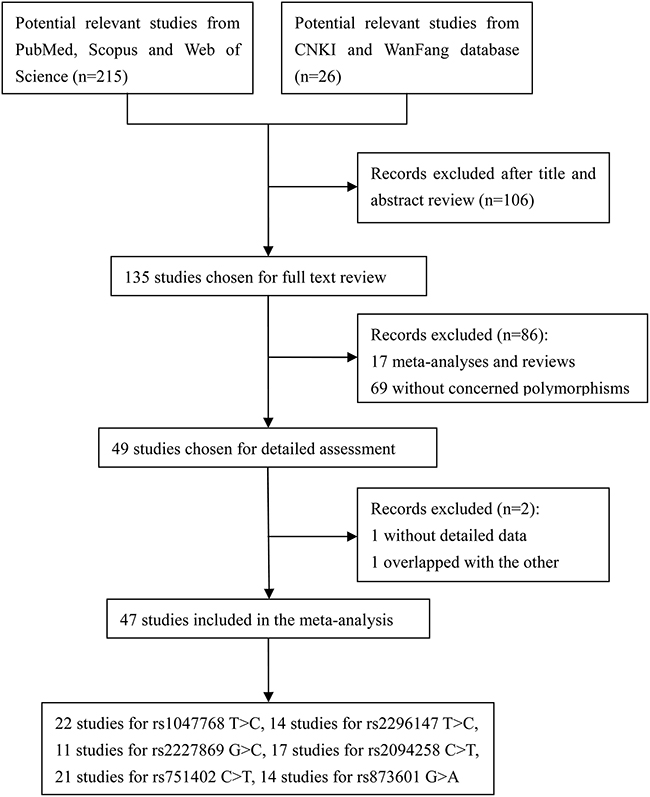
Figure 1: Flow diagram showing the process used to identify eligible studies.
Table 1: Characteristics of the studies included in the meta-analysis
Author |
Year |
Country |
Ethnicity |
Source |
Cancer |
Case |
Control |
MAF |
HWE |
Score |
||||||
|---|---|---|---|---|---|---|---|---|---|---|---|---|---|---|---|---|
BB |
Bb |
bb |
All |
BB |
Bb |
bb |
All |
|||||||||
rs1047768 T>C |
||||||||||||||||
Shen M |
2005 |
China |
Asian |
PB |
Lung |
55 |
49 |
14 |
118 |
63 |
36 |
13 |
112 |
0.28 |
0.037 |
10 |
Zienolddiny S |
2006 |
Norway |
Caucasian |
PB |
Lung |
60 |
119 |
137 |
316 |
109 |
126 |
138 |
373 |
0.54 |
<0.001 |
11 |
Moreno V |
2006 |
Spain |
Caucasian |
HB |
Colorectal |
114 |
184 |
53 |
351 |
105 |
164 |
51 |
320 |
0.42 |
0.325 |
11 |
Garcia-Closas M |
2006 |
Spain |
Caucasian |
HB |
Bladder |
188 |
530 |
385 |
1103 |
222 |
506 |
366 |
1094 |
0.57 |
0.052 |
12 |
Xie WM |
2007 |
China |
Asian |
PB |
HCC |
194 |
195 |
38 |
427 |
235 |
196 |
48 |
479 |
0.30 |
0.451 |
11 |
Abbasi R |
2009 |
Germany |
Caucasian |
PB |
Laryngeal |
43 |
127 |
78 |
248 |
115 |
320 |
212 |
647 |
0.57 |
0.762 |
13 |
Hussain SK |
2009 |
China |
Asian |
PB |
Gastric |
97 |
61 |
12 |
170 |
189 |
168 |
29 |
386 |
0.29 |
0.173 |
13 |
Ma H |
2012 |
USA |
Caucasian |
HB |
SCCHN |
184 |
506 |
369 |
1059 |
179 |
507 |
379 |
1065 |
0.59 |
0.669 |
11 |
Sakoda LC |
2012 |
USA |
Caucasian |
PB |
Lung |
108 |
378 |
256 |
742 |
245 |
722 |
507 |
1474 |
0.59 |
0.656 |
15 |
He J |
2013 |
China |
Asian |
HB |
Gastric |
571 |
469 |
85 |
1125 |
610 |
474 |
112 |
1196 |
0.29 |
0.155 |
13 |
Paszkowska-Szczur K |
2013 |
Poland |
Caucasian |
PB |
Melanoma |
128 |
291 |
214 |
633 |
242 |
623 |
465 |
1330 |
0.58 |
0.189 |
13 |
Li X |
2014 |
China |
Asian |
HB |
Laryngeal |
49 |
101 |
60 |
210 |
46 |
97 |
67 |
210 |
0.55 |
0.333 |
9 |
Mirecka A |
2014 |
Poland |
Caucasian |
HB |
Prostate |
128 |
272 |
221 |
621 |
154 |
368 |
259 |
781 |
0.57 |
0.260 |
9 |
Li XC |
2014 |
China |
Asian |
HB |
Gastric |
37 |
95 |
85 |
217 |
29 |
93 |
95 |
217 |
0.65 |
0.414 |
8 |
Na N |
2015 |
China |
Asian |
HB |
Breast |
161 |
140 |
24 |
325 |
171 |
134 |
20 |
325 |
0.27 |
0.352 |
10 |
Paszkowska-Szczur K |
2015 |
Poland |
Caucasian |
HB |
Colorectal |
104 |
221 |
138 |
463 |
242 |
623 |
465 |
1330 |
0.58 |
0.189 |
9 |
He J |
2016 |
China |
Asian |
HB |
Neuroblastoma |
135 |
93 |
20 |
248 |
307 |
198 |
26 |
531 |
0.24 |
0.409 |
10 |
Hua RX |
2016 |
China |
Asian |
HB |
Colorectal |
970 |
758 |
173 |
1901 |
1023 |
812 |
142 |
1977 |
0.28 |
0.266 |
10 |
Hua RX |
2016 |
China |
Asian |
HB |
Gastric |
607 |
445 |
90 |
1142 |
625 |
461 |
87 |
1173 |
0.27 |
0.875 |
11 |
Li RJ |
2016 |
China |
Asian |
HB |
Gastric |
57 |
92 |
67 |
216 |
68 |
87 |
61 |
216 |
0.48 |
0.004 |
7 |
Wang MY |
2016 |
China |
Asian |
HB |
Prostate |
491 |
433 |
80 |
1004 |
534 |
440 |
81 |
1055 |
0.29 |
0.461 |
10 |
Bai Y |
2016 |
China |
Asian |
HB |
Gastric |
41 |
98 |
55 |
194 |
32 |
106 |
87 |
225 |
0.62 |
0.975 |
6 |
rs2296147 T>C |
||||||||||||||||
Shao MH |
2007 |
China |
Asian |
HB |
Lung |
570 |
304 |
52 |
926 |
590 |
358 |
31 |
979 |
0.21 |
0.008 |
10 |
Doherty JA |
2011 |
USA |
Mixed |
PB |
Endometrial |
194 |
356 |
165 |
715 |
199 |
364 |
157 |
720 |
0.47 |
0.696 |
11 |
Duan Z |
2012 |
China |
Asian |
HB |
Gastric |
257 |
122 |
24 |
403 |
260 |
132 |
11 |
403 |
0.19 |
0.232 |
11 |
He J |
2012 |
China |
Asian |
HB |
Gastric |
700 |
371 |
54 |
1125 |
742 |
398 |
56 |
1196 |
0.21 |
0.779 |
13 |
Ma H |
2012 |
USA |
Caucasian |
HB |
SCCHN |
280 |
532 |
244 |
1056 |
294 |
543 |
228 |
1065 |
0.47 |
0.440 |
11 |
Sakoda LC |
2012 |
USA |
Caucasian |
PB |
Lung |
182 |
385 |
174 |
741 |
407 |
723 |
341 |
1471 |
0.48 |
0.565 |
15 |
Zhu ML |
2012 |
China |
Asian |
HB |
ESCC |
757 |
305 |
53 |
1115 |
699 |
368 |
50 |
1117 |
0.21 |
0.860 |
13 |
Yang WG |
2012 |
China |
Asian |
HB |
Gastric |
208 |
105 |
24 |
337 |
196 |
110 |
41 |
347 |
0.28 |
<0.001 |
9 |
Yang B |
2013 |
China |
Asian |
HB |
Prostate |
37 |
49 |
143 |
229 |
25 |
46 |
167 |
238 |
0.80 |
<0.001 |
8 |
Na N |
2015 |
China |
Asian |
HB |
Breast |
188 |
104 |
33 |
325 |
199 |
98 |
28 |
325 |
0.24 |
0.003 |
9 |
Sun Z |
2015 |
China |
Asian |
HB |
NPC |
119 |
177 |
76 |
372 |
111 |
180 |
80 |
371 |
0.46 |
0.660 |
11 |
Chen YZ |
2016 |
China |
Asian |
HB |
Gastric |
442 |
217 |
33 |
692 |
475 |
264 |
32 |
771 |
0.21 |
0.535 |
11 |
He J |
2016 |
China |
Asian |
HB |
Neuroblastoma |
160 |
79 |
9 |
248 |
343 |
170 |
18 |
531 |
0.19 |
0.583 |
10 |
Hua RX |
2016 |
China |
Asian |
HB |
Colorectal |
1169 |
644 |
88 |
1901 |
1213 |
692 |
72 |
1977 |
0.21 |
0.027 |
9 |
Hua RX |
2016 |
China |
Asian |
HB |
Gastric |
725 |
364 |
53 |
1142 |
746 |
388 |
39 |
1173 |
0.20 |
0.182 |
11 |
rs2227869 G>C |
||||||||||||||||
Shen M |
2005 |
China |
Asian |
PB |
Lung |
103 |
14 |
1 |
118 |
100 |
11 |
0 |
111 |
0.05 |
0.583 |
11 |
Garcia-Closas M |
2006 |
Spain |
Caucasian |
HB |
Bladder |
1050 |
91 |
2 |
1143 |
1046 |
90 |
0 |
1136 |
0.04 |
0.164 |
12 |
Huang WY |
2006 |
USA |
Caucasian |
PB |
Colorectal |
598 |
52 |
1 |
651 |
601 |
60 |
1 |
662 |
0.05 |
0.694 |
14 |
Hooker S |
2008 |
USA |
African |
HB |
Prostate |
234 |
20 |
0 |
254 |
274 |
27 |
0 |
301 |
0.05 |
0.415 |
7 |
Hussain SK |
2009 |
China |
Asian |
PB |
Gastric |
174 |
13 |
0 |
187 |
314 |
56 |
3 |
372 |
0.08 |
0.773 |
13 |
Ma H |
2012 |
USA |
Caucasian |
HB |
SCCHN |
987 |
70 |
2 |
1059 |
974 |
90 |
2 |
1066 |
0.04 |
0.958 |
11 |
Sakoda LC |
2012 |
USA |
Caucasian |
PB |
Lung |
1 |
63 |
680 |
744 |
2 |
110 |
1362 |
1474 |
0.96 |
0.886 |
15 |
Santos LS |
2013 |
Portugal |
Caucasian |
HB |
Thyroid |
99 |
6 |
1 |
106 |
184 |
27 |
1 |
212 |
0.02 |
0.993 |
8 |
Paszkowska-Szczur K |
2013 |
Poland |
Caucasian |
PB |
Melanoma |
567 |
67 |
2 |
636 |
1168 |
162 |
2 |
1332 |
0.06 |
0.137 |
13 |
Mirecka A |
2014 |
Poland |
Caucasian |
HB |
Prostate |
485 |
83 |
3 |
571 |
682 |
99 |
1 |
782 |
0.06 |
0.181 |
9 |
Paszkowska-Szczur K |
2015 |
Poland |
Caucasian |
HB |
Colorectal |
372 |
55 |
2 |
429 |
1168 |
162 |
2 |
1332 |
0.06 |
0.137 |
9 |
rs2094258 C>T |
||||||||||||||||
He J |
2012 |
China |
Asian |
HB |
Gastric |
457 |
518 |
150 |
1125 |
457 |
560 |
179 |
1196 |
0.62 |
0.728 |
13 |
Ma H |
2012 |
USA |
Caucasian |
HB |
SCCHN |
706 |
295 |
37 |
1038 |
721 |
291 |
41 |
1053 |
0.82 |
0.092 |
11 |
Yang WG |
2012 |
China |
Asian |
HB |
Gastric |
131 |
149 |
57 |
337 |
145 |
166 |
36 |
347 |
0.66 |
0.252 |
10 |
Zhu ML |
2012 |
China |
Asian |
HB |
ESCC |
414 |
524 |
177 |
1115 |
424 |
525 |
168 |
1117 |
0.61 |
0.793 |
13 |
Yang B |
2013 |
China |
Asian |
HB |
Prostate |
61 |
75 |
93 |
229 |
58 |
75 |
105 |
238 |
0.40 |
<0.001 |
9 |
Na N |
2015 |
China |
Asian |
HB |
Breast |
102 |
157 |
66 |
325 |
131 |
147 |
47 |
325 |
0.63 |
0.581 |
10 |
Sun Y |
2015 |
China |
Asian |
HB |
Laryngeal |
140 |
106 |
25 |
271 |
152 |
101 |
18 |
271 |
0.75 |
0.826 |
11 |
Sun Z |
2015 |
China |
Asian |
HB |
NPC |
209 |
68 |
95 |
372 |
211 |
66 |
94 |
371 |
0.66 |
<0.001 |
10 |
Chen YZ |
2016 |
China |
Asian |
HB |
Gastric |
287 |
304 |
101 |
692 |
291 |
368 |
112 |
771 |
0.62 |
0.803 |
11 |
He J |
2016 |
China |
Asian |
HB |
Neuroblastoma |
116 |
93 |
39 |
248 |
203 |
254 |
74 |
531 |
0.62 |
0.701 |
10 |
Hua RX |
2016 |
China |
Asian |
HB |
Colorectal |
797 |
856 |
248 |
1901 |
899 |
881 |
197 |
1977 |
0.68 |
0.378 |
10 |
Feng YB |
2016 |
China |
Asian |
HB |
Gastric |
15 |
75 |
87 |
177 |
15 |
96 |
127 |
238 |
0.26 |
0.577 |
6 |
Hua RX |
2016 |
China |
Asian |
HB |
Gastric |
499 |
508 |
135 |
1142 |
527 |
524 |
122 |
1173 |
0.67 |
0.623 |
11 |
Lu JJ |
2016 |
China |
Asian |
HB |
Gastric |
17 |
67 |
100 |
184 |
13 |
72 |
121 |
206 |
0.24 |
0.605 |
6 |
Ma SH |
2016 |
China |
Asian |
HB |
Breast |
27 |
136 |
157 |
320 |
15 |
96 |
127 |
238 |
0.26 |
0.577 |
7 |
Yang LQ |
2016 |
China |
Asian |
HB |
Gastric |
71 |
74 |
10 |
155 |
121 |
111 |
14 |
246 |
0.72 |
0.076 |
6 |
Ying MF |
2016 |
China |
Asian |
HB |
Pancreatic |
87 |
92 |
16 |
195 |
117 |
115 |
22 |
254 |
0.69 |
0.400 |
7 |
rs751402 C>T |
||||||||||||||||
Shao MH |
2007 |
China |
Asian |
HB |
Lung |
105 |
429 |
433 |
967 |
110 |
425 |
448 |
983 |
0.67 |
0.544 |
11 |
Yoon AJ |
2011 |
Taiwan |
Asian |
HB |
HCC |
11 |
52 |
33 |
96 |
32 |
137 |
167 |
336 |
0.70 |
0.614 |
6 |
Duan Z |
2012 |
China |
Asian |
HB |
Gastric |
47 |
181 |
172 |
400 |
29 |
165 |
206 |
400 |
0.72 |
0.605 |
11 |
He J |
2012 |
China |
Asian |
HB |
Gastric |
148 |
491 |
486 |
1125 |
137 |
499 |
560 |
1196 |
0.68 |
0.110 |
13 |
Zavras AI |
2012 |
Taiwan |
Mixed |
HB |
OSCC |
31 |
110 |
98 |
239 |
32 |
137 |
167 |
336 |
0.70 |
0.614 |
9 |
Meng X |
2013 |
China |
Asian |
HB |
Salivary gland |
11 |
63 |
59 |
133 |
23 |
55 |
64 |
142 |
0.64 |
0.065 |
8 |
Na N |
2015 |
China |
Asian |
HB |
Breast |
45 |
152 |
128 |
325 |
41 |
147 |
137 |
325 |
0.65 |
0.872 |
10 |
Sun Z |
2015 |
China |
Asian |
HB |
NPC |
237 |
118 |
17 |
372 |
235 |
117 |
19 |
371 |
0.21 |
0.377 |
11 |
Wang H |
2016 |
China |
Asian |
HB |
Breast |
1 |
10 |
90 |
101 |
11 |
39 |
51 |
101 |
0.70 |
0.398 |
9 |
Chen YZ |
2016 |
China |
Asian |
HB |
Gastric |
93 |
313 |
286 |
692 |
89 |
331 |
351 |
771 |
0.67 |
0.416 |
11 |
He J |
2016 |
China |
Asian |
HB |
Neuroblastoma |
38 |
114 |
96 |
248 |
82 |
241 |
208 |
531 |
0.62 |
0.380 |
10 |
Hua RX |
2016 |
China |
Asian |
HB |
Colorectal |
248 |
860 |
792 |
1900 |
301 |
952 |
724 |
1977 |
0.61 |
0.680 |
10 |
Guo BW |
2016 |
China |
Asian |
HB |
Gastric |
22 |
73 |
47 |
142 |
21 |
136 |
117 |
274 |
0.68 |
0.029 |
5 |
Feng YB |
2016 |
China |
Asian |
HB |
Gastric |
24 |
83 |
70 |
177 |
28 |
107 |
101 |
236 |
0.65 |
0.967 |
6 |
Hua RX |
2016 |
China |
Asian |
HB |
Gastric |
161 |
555 |
426 |
1142 |
189 |
551 |
433 |
1173 |
0.60 |
0.537 |
11 |
Li RJ |
2016 |
China |
Asian |
HB |
Gastric |
22 |
106 |
88 |
216 |
18 |
103 |
95 |
216 |
0.68 |
0.174 |
8 |
Lu JJ |
2016 |
China |
Asian |
HB |
Gastric |
24 |
91 |
69 |
184 |
22 |
97 |
87 |
206 |
0.66 |
0.510 |
6 |
Ma SH |
2016 |
China |
Asian |
HB |
Breast |
43 |
150 |
127 |
320 |
28 |
101 |
107 |
236 |
0.67 |
0.580 |
7 |
Yang LQ |
2016 |
China |
Asian |
HB |
Gastric |
33 |
73 |
49 |
155 |
32 |
111 |
103 |
246 |
0.64 |
0.807 |
6 |
Wang MY |
2016 |
China |
Asian |
HB |
Prostate |
104 |
458 |
442 |
1004 |
111 |
467 |
477 |
1055 |
0.67 |
0.834 |
10 |
Zhou RM |
2016 |
China |
Asian |
HB |
Gastric |
61 |
196 |
174 |
431 |
46 |
193 |
193 |
432 |
0.67 |
0.827 |
12 |
rs873601 G>A |
||||||||||||||||
Shao MH |
2007 |
China |
Asian |
HB |
Lung |
260 |
493 |
220 |
973 |
277 |
494 |
217 |
988 |
0.47 |
0.907 |
11 |
He J |
2012 |
China |
Asian |
HB |
Gastric |
274 |
560 |
291 |
1125 |
327 |
605 |
264 |
1196 |
0.47 |
0.616 |
13 |
Ma H |
2012 |
USA |
Caucasian |
HB |
SCCHN |
66 |
427 |
565 |
1058 |
83 |
411 |
572 |
1066 |
0.73 |
0.445 |
11 |
Sakoda LC |
2012 |
USA |
Caucasian |
PB |
Lung |
51 |
299 |
392 |
742 |
107 |
584 |
783 |
1474 |
0.73 |
0.894 |
15 |
Yang WG |
2012 |
China |
Asian |
HB |
Gastric |
96 |
163 |
78 |
337 |
91 |
164 |
91 |
346 |
0.50 |
0.333 |
10 |
Zhu ML |
2012 |
China |
Asian |
HB |
ESCC |
314 |
566 |
235 |
1115 |
311 |
565 |
241 |
1117 |
0.47 |
0.601 |
13 |
Na N |
2015 |
China |
Asian |
HB |
Breast |
99 |
156 |
70 |
325 |
109 |
150 |
66 |
325 |
0.43 |
0.276 |
10 |
Zhao F |
2015 |
China |
Asian |
HB |
Pancreatic |
105 |
111 |
30 |
246 |
118 |
107 |
21 |
246 |
0.30 |
0.637 |
8 |
Chen YZ |
2016 |
China |
Asian |
HB |
Gastric |
172 |
333 |
187 |
692 |
205 |
396 |
170 |
771 |
0.48 |
0.415 |
11 |
He J |
2016 |
China |
Asian |
HB |
Neuroblastoma |
70 |
112 |
66 |
248 |
137 |
270 |
124 |
531 |
0.49 |
0.686 |
10 |
Wang B |
2016 |
China |
Asian |
HB |
HCC |
163 |
271 |
104 |
538 |
271 |
408 |
214 |
893 |
0.47 |
0.014 |
12 |
Hua RX |
2016 |
China |
Asian |
HB |
Colorectal |
476 |
954 |
471 |
1901 |
550 |
1025 |
402 |
1977 |
0.46 |
0.057 |
10 |
Hua RX |
2016 |
China |
Asian |
HB |
Gastric |
311 |
557 |
274 |
1142 |
323 |
598 |
252 |
1173 |
0.47 |
0.424 |
11 |
Zhou RM |
2016 |
China |
Asian |
HB |
Gastric |
115 |
215 |
101 |
431 |
132 |
200 |
100 |
432 |
0.46 |
0.152 |
12 |
Abbreviations: HB, hospital-based; PB, population-based; PCR-RFLP, polymerase chain reaction-restriction fragment length polymorphism; MAF, minor allele frequency; HWE, Hardy-Weinberg equilibrium; HCC, hepatocellular carcinoma; SCCHN, squamous cell carcinoma of the head and neck; ESCC, esophageal squamous cell carcinoma; OSCC, oral squamous cell carcinoma; NPC, nasopharyngeal carcinoma.
Meta-analysis results
We observed no significant association between rs1047768 T>Cand overall cancer risk (Table 2). However, in stratified analysis, rs1047768 T>C was associated with an increased risk of lung cancer under homozygous [odds ratio (OR) = 1.32, 95% confidence interval (CI) = 1.06–1.64], heterozygous (OR = 1.35, 95% CI = 1.10–1.65), dominant (OR = 1.35, 95% CI = 1.12–1.63), and allele contrast (OR = 1.14, 95% CI = 1.02–1.27) models.
Table 2: Associations between the six SNPs in the XPG gene and cancer risk
Variables |
No. of studies |
No. of cases |
No. of controls |
Homozygous |
Heterozygous |
Recessive |
Dominant |
Allele |
|||||
OR |
P het |
OR |
P het |
OR |
P het |
OR |
P het |
OR |
P het |
||||
rs1047768 T>C |
CC vs. TT |
CT vs. TT |
CC vs. CT/TT |
CC/CT vs. TT |
C vs. T |
||||||||
All |
22 |
12833 |
15186 |
1.03 (0.95–1.11) |
0.010 |
1.03 (0.97–1.09) |
0.192 |
1.00 (0.93–1.07) |
0.171 |
1.03 (0.98–1.09) |
0.038 |
1.01 (0.98–1.05) |
0.012 |
Ethnicity |
|||||||||||||
Caucasian |
9 |
5536 |
7084 |
1.03 (0.88–1.21) |
0.012 |
1.04 (0.95–1.14) |
0.061 |
1.00 (0.93–1.07) |
0.344 |
1.04 (0.90–1.20) |
0.011 |
1.01 (0.94–1.10) |
0.011 |
Asian |
13 |
7297 |
8102 |
1.03 (0.92–1.16) |
0.081 |
1.02 (0.96–1.10) |
0.493 |
1.00 (0.90–1.11) |
0.116 |
1.03 (0.96–1.10) |
0.304 |
1.02 (0.97–1.07) |
0.105 |
Cancer type |
|||||||||||||
Lung |
3 |
1176 |
1959 |
1.32 (1.06–1.64) |
0.175 |
1.35 (1.10–1.65) |
0.278 |
1.08 (0.92–1.26) |
0.360 |
1.35 (1.12–1.63) |
0.172 |
1.14 (1.02–1.27) |
0.059 |
Colorectal |
3 |
2715 |
3627 |
0.95 (0.63–1.45) |
0.006 |
0.96 (0.86–1.08) |
0.480 |
0.99 (0.70–1.39) |
0.012 |
0.94 (0.78–1.14) |
0.133 |
0.99 (0.91–1.07) |
0.020 |
Gastric |
6 |
3064 |
3413 |
0.88 (0.74–1.05) |
0.118 |
0.98 (0.88–1.09) |
0.263 |
0.88 (0.74–1.05) |
0.279 |
0.97 (0.87–1.07) |
0.127 |
0.93 (0.82–1.04) |
0.073 |
Others |
10 |
5878 |
7517 |
1.04 (0.93–1.15) |
0.507 |
1.05 (0.96–1.14) |
0.670 |
1.01 (0.93–1.10) |
0.725 |
1.05 (0.97–1.14) |
0.628 |
1.03 (0.98–1.08) |
0.659 |
rs2296147 T>C |
CC vs. TT |
CT vs. TT |
CC vs. CT/TT |
CC/CT vs. TT |
C vs. T |
||||||||
All |
15 |
11327 |
12684 |
1.10 (1.00–1.12) |
0.068 |
0.95 (0.90–1.01) |
0.480 |
1.08 (0.99–1.18) |
0.057 |
0.97 (0.92–1.03) |
0.297 |
1.00 (0.96–1.04) |
0.118 |
Gastric |
5 |
3699 |
3890 |
1.11 (0.76–1.60) |
0.026 |
0.95 (0.86–1.04) |
0.945 |
1.13 (0.78–1.63) |
0.025 |
0.96 (0.88–1.06) |
0.697 |
0.99 (0.91–1.07) |
0.197 |
rs2227869 G>C |
CC vs. GG |
GC vs. GG |
CC vs. GC/GG |
GC/CC vs. GG |
C vs. G |
||||||||
All |
11 |
5898 |
7448 |
1.67 (0.82–3.41) |
0.924 |
0.90 (0.80–1.02) |
0.153 |
0.98 (0.73–1.32) |
0.699 |
0.92 (0.81–1.03) |
0.108 |
0.93 (0.83–1.04) |
0.079 |
PB |
5 |
2336 |
3951 |
1.08 (0.37–3.10) |
0.793 |
0.80 (0.65–0.99) |
0.239 |
0.89 (0.65–1.21) |
0.766 |
0.81 (0.66–1.00) |
0.170 |
0.84 (0.71–0.99) |
0.115 |
HB |
6 |
3562 |
4829 |
2.46 (0.91–6.67) |
0.852 |
0.96 (0.82–1.11) |
0.198 |
2.48 (0.91–6.74) |
0.865 |
0.98 (0.84–1.13) |
0.190 |
1.00 (0.87–1.15) |
0.202 |
rs2094258 C>T |
TT vs. CC |
CT vs. CC |
TT vs. CT/CC |
CT/TT vs. CC |
T vs. C |
||||||||
All |
17 |
9826 |
10552 |
1.09 (1.00–1.19) |
0.025 |
1.00 (0.94–1.07) |
0.314 |
1.07 (0.99–1.16) |
0.089 |
1.02 (0.97–1.09) |
0.081 |
1.03 (0.99–1.08) |
0.015 |
Gastric |
7 |
3812 |
4177 |
0.99 (0.86–1.15) |
0.083 |
0.95 (0.86–1.05) |
0.734 |
1.01 (0.89–1.14) |
0.119 |
0.96 (0.88–1.06) |
0.409 |
0.98 (0.92–1.05) |
0.133 |
rs751402 C>T |
TT vs. CC |
CT vs. CC |
TT vs. CT/CC |
CT/TT vs. CC |
T vs. C |
||||||||
All |
21 |
10369 |
11207 |
1.18 (1.00–1.39) |
<0.001 |
1.10 (0.99–1.23) |
0.082 |
1.02 (0.94–1.10) |
0.006 |
1.11 (0.98–1.25) |
<0.001 |
1.08 (0.98–1.18) |
<0.001 |
Gastric |
10 |
4664 |
5150 |
1.38 (1.12–1.70) |
0.020 |
1.14 (1.05–1.24) |
0.936 |
1.27 (1.06–1.51) |
0.053 |
1.17 (1.08–1.26) |
0.437 |
1.17(1.07–1.27) |
0.043 |
rs873601 G>A |
AA vs. GG |
GA vs. GG |
AA vs. GA/GG |
GA/AA vs. GG |
A vs. G |
||||||||
All |
14 |
10873 |
12535 |
1.14 (1.06–1.24) |
0.193 |
1.06 (0.99–1.13) |
0.904 |
1.08 (0.99–1.17) |
0.035 |
1.08 (1.02–1.15) |
0.841 |
1.06 (1.02–1.10) |
0.234 |
Gastric |
5 |
3727 |
3918 |
1.18 (1.04–1.34) |
0.333 |
1.04 (0.93–1.16) |
0.663 |
1.16 (1.04–1.28) |
0.263 |
1.08 (0.98–1.20) |
0.578 |
1.09 (1.02–1.16) |
0.336 |
No significant association was observed between rs2296147 T>C and overall cancer risk. Similarly, there was no significant association between rs2227869 G>C and overall cancer risk. However, a significant association was identified in population-based studies when the data were stratified based on the source of the controls under heterozygous (OR = 0.80, 95% CI = 0.65–0.99) and allele contrast (OR = 0.84, 95% CI = 0.71–0.99) models. We observed an association between rs2094258 C>T and overall cancer risk under the homozygous model (OR = 1.09, 95% CI = 1.00–1.19), which approached borderline statistical significance. Another borderline significant association was observed between rs751402 C>T and overall cancer risk under the homozygous model (OR = 1.18, 95% CI = 1.00–1.39). In the stratified analysis, a significant association was observed for gastric cancer under homozygous (OR = 1.38, 95% CI = 1.12–1.70), heterozygous (OR = 1.14, 95% CI = 1.05–1.24), recessive (OR = 1.27, 95% CI = 1.06–1.51), dominant (OR = 1.17, 95% CI = 1.08–1.26), and allele contrast (OR = 1.17, 95% CI = 1.07–1.27) models.
A significant association was observed between rs873601 G>A and overall cancer risk under homozygous (OR = 1.14, 95% CI = 1.06–1.24), dominant (OR = 1.08, 95% CI = 1.02–1.15), and allele contrast (OR = 1.06, 95% CI = 1.02-1.10) models (Figure 2). The association with gastric cancer remained statistically significant under homozygous (OR = 1.18, 95% CI = 1.04–1.34), recessive (OR = 1.16, 95% CI = 1.04–1.28), and allele contrast (OR = 1.09, 95% CI = 1.02–1.16) models.
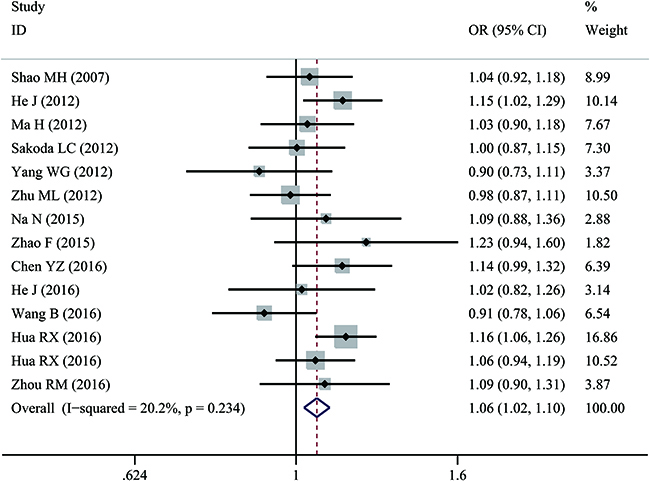
Figure 2: Forest plot of overall cancer risk associated with rs873601 G>A in the XPG gene under an allele contrast model. For each study, estimated ORs and 95% CIs are plotted with a box and horizontal line, respectively. (◇, pooled ORs and associated 95% CIs).
Heterogeneity and sensitivity analysis
Study heterogeneity was observed for the association between rs1047768 T>C and overall cancer risk under homozygous, dominant, and allele contrast models (P = 0.010, P = 0.038, and P = 0.012, respectively); rs2094258 C>T under homozygous and allele contrast models (P = 0.025 and P = 0.015, respectively); rs751402 C>T under homozygous, recessive, dominant, and allele contrast models (P < 0.001, P = 0.006, P < 0.001, P < 0.001, respectively); and rs873601 G>A under a recessive model (P = 0.035). These data indicated that the removal of any individual study from the analysis did not qualitatively change the pooled ORs (data not shown).
Publication bias
The Begg’s funnel plots of the associations between the SNPs in the XPG gene and cancer risk were basically symmetrical (Figure 3). Egger’s tests indicated there was no publication bias for rs1047768 T>C under homozygous (P = 0.107), heterozygous (P = 0.190), recessive (P = 0.325), dominant (P = 0.137), and allele contrast (P = 0.301) models; rs2296147 T>C under homozygous (P = 0.789), heterozygous (P = 0.925), recessive (P = 0.577), dominant (P = 0.464), and allele contrast (P = 0.129) models; rs2227869 G>C under homozygous (P = 0.708), heterozygous (P = 0.289), recessive (P = 0.042), dominant (P = 0.297), and allele contrast (P = 0.197) models; rs2094258 C>T under homozygous (P = 0.387), heterozygous (P = 0.350), recessive (P = 0.844), dominant (P = 0.276), and allele contrast (P = 0.351) models; rs751402 C>T under homozygous (P = 0.107), heterozygous (P = 0.336), recessive (P = 0.137), dominant (P = 0.325), and allele contrast (P = 0.301) models; and rs873601 G>A under homozygous (P = 0.395), heterozygous (P = 0.656), recessive (P = 0.645), dominant (P = 0.811), and allele contrast (P = 0.346) models (Table 3).
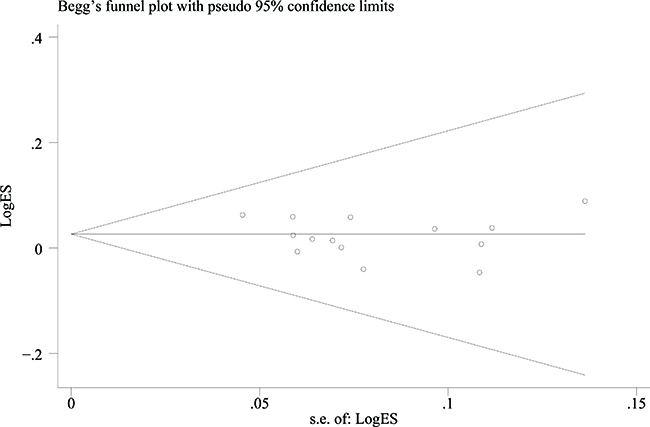
Figure 3: Funnel plot of the association between rs873601 G>A in the XPG gene and overall cancer risk under an allele contrast model. Each point represents an individual study that reported the indicated association.
Table 3: Publication bias among studies that evaluated the associations between the six SNPs in the XPG gene and cancer susceptibility
Polymorphism |
No. of studies |
Egger’s test P values |
||||
|---|---|---|---|---|---|---|
Homozygous |
Heterozygous |
Recessive |
Dominant |
Allele contrast |
||
rs1047768 |
22 |
0.107 |
0.190 |
0.325 |
0.137 |
0.301 |
rs2296147 |
15 |
0.789 |
0.925 |
0.577 |
0.464 |
0.129 |
rs2227869 |
11 |
0.708 |
0.289 |
0.042 |
0.297 |
0.197 |
rs2094258 |
17 |
0.387 |
0.350 |
0.844 |
0.276 |
0.351 |
rs751402 |
21 |
0.107 |
0.336 |
0.137 |
0.325 |
0.301 |
rs873601 |
14 |
0.395 |
0.656 |
0.645 |
0.811 |
0.346 |
False-positive report probability (FPRP) analysis and trial sequential analysis (TSA)
All significant findings remained significant at a prior probability of 0.1, with all the FPRP values less than 0.20 with the exception of the population-designed studies of rs2227869 G>C (Table 4). TSA indicated that the cumulative z-curve crossed the trial sequential monitoring boundary, suggesting that the sample size was sufficient and that no further analysis was required to confirm the results (Figure 4).
Table 4: False-positive report probability values for significant results
Genotype |
Crude OR (95% CI) |
P a |
Statistical power b |
Prior probability |
||||
|---|---|---|---|---|---|---|---|---|
0.25 |
0.1 |
0.01 |
0.001 |
0.0001 |
||||
rs1047768 T>C (lung cancer) |
||||||||
CC vs. TT |
1.32 (1.06–1.64) |
0.012 |
0.998 |
0.035 |
0.097 |
0.542 |
0.923 |
0.992 |
CT vs. TT |
1.35 (1.10–1.65) |
0.004 |
0.995 |
0.011 |
0.033 |
0.273 |
0.791 |
0.974 |
CC/CT vs. TT |
1.35 (1.12–1.63) |
0.002 |
0.859 |
0.006 |
0.019 |
0.177 |
0.685 |
0.956 |
C vs. T |
1.14 (1.02–1.27) |
0.017 |
1.000 |
0.048 |
0.130 |
0.622 |
0.943 |
0.994 |
rs2227869 G>C (population-based studies) |
||||||||
GC vs. GG |
0.80 (0.65–0.99) |
0.041 |
0.987 |
0.111 |
0.272 |
0.805 |
0.976 |
0.998 |
C vs. G |
0.84 (0.71–0.99) |
0.041 |
1.000 |
0.110 |
0.271 |
0.803 |
0.976 |
0.998 |
rs751402 C>T (gastric cancer) |
||||||||
TT vs. CC |
1.38 (1.12–1.70) |
0.002 |
1.000 |
0.007 |
0.019 |
0.179 |
0.687 |
0.956 |
CT vs. CC |
1.14 (1.05–1.24) |
0.003 |
1.000 |
0.008 |
0.024 |
0.213 |
0.732 |
0.965 |
TT vs. CT/CC |
1.27 (1.06–1.51) |
0.010 |
1.000 |
0.030 |
0.085 |
0.506 |
0.912 |
0.990 |
CT/TT vs. CC |
1.17 (1.08–1.26) |
<0.001 |
1.000 |
0.001 |
0.002 |
0.019 |
0.161 |
0.658 |
T vs. C |
1.17 (1.07–1.27) |
0.001 |
1.000 |
0.002 |
0.006 |
0.063 |
0.404 |
0.871 |
rs873601 G>A (overall) |
||||||||
AA vs. GG |
1.14 (1.06–1.24) |
0.001 |
1.000 |
0.002 |
0.006 |
0.061 |
0.394 |
0.867 |
GA/AA vs. GG |
1.08 (1.02–1.15) |
0.012 |
1.000 |
0.036 |
0.101 |
0.552 |
0.926 |
0.992 |
A vs. G |
1.06 (1.02–1.10) |
0.002 |
1.000 |
0.006 |
0.016 |
0.155 |
0.650 |
0.949 |
rs873601 G>A (gastric cancer) |
||||||||
AA vs. GG |
1.18 (1.04–1.34) |
0.009 |
1.000 |
0.027 |
0.078 |
0.482 |
0.904 |
0.989 |
AA vs. GA/GG |
1.16 (1.04–1.28) |
0.008 |
1.000 |
0.022 |
0.064 |
0.431 |
0.884 |
0.987 |
A vs. G |
1.09 (1.02–1.16) |
0.011 |
1.000 |
0.031 |
0.089 |
0.517 |
0.915 |
0.991 |
aChi-square tests were used to assess the genotype frequency distributions.
bStatistical power was calculated using the number of observations in the subgroup and the P values in this table.
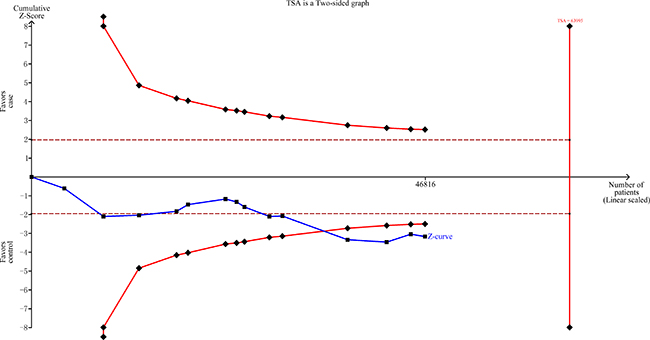
Figure 4: TSA of rs873601 G>A in the XPG gene and overall cancer risk under an allele contrast model.
DISCUSSION
The NER pathway is critical for the repair of bulky DNA lesions resulting from exposure to chemical carcinogens as well as ionizing radiation in order to maintain genomic integrity and prevent carcinogenesis [55]. Because the XPG gene is an indispensable component of the NER pathway, SNPs in XPG may alter the expression or function of XPG thereby modifying the risk of cancer. Most previous meta-analyses of the association between SNPs in XPG and cancer risk have focused on rs17655 G>C [56-59]. However, recent studies have shown that other SNPs in XPG may also be associated with cancer risk. For example, Chen et al. found that rs873601 G>A was associated with an increased risk of gastric cancer in a Chinese Han population [36]. Wang et al. found that rs751402 C>T was protective against breast cancer in Chinese Han women [47]. Additionally, the T allele of rs2296147 was associated with an increased risk of prostate cancer [35]. However, the results of previous studies have been inconsistent, possibly due to variations in the study populations and limited sample sizes. We therefore performed a meta-analysis of 47 studies to comprehensively evaluate the associations between six SNPs in XPG: rs1047768 T>C, rs2296147 T>C, rs2227869 G>C, rs2094258 C>T, rs751402 C>T, and rs873601 G>A and cancer risk.
The rs873601 G>A polymorphism is located in a miRNA binding site in the XPG gene. Thus, it may alter XPG expression by modulating the miRNA-mRNA interaction, which could play a role in carcinogenesis [10]. We demonstrated that rs873601 G>A was significantly associated with overall cancer risk. Individuals with the AA genotype of rs873601 had a 1.14-fold higher risk of cancer compared to individuals with the GG genotype. Similar results were obtained for gastric cancer. The A allele of rs873601 was previously shown to result in reduced mRNA expression of XPG in both adjacent normal gastric cancer tissue and normal cell lines in a recessive manner [10]. These findings provide insight into the molecular mechanisms by which the AA genotype of rs873601 may increase the risk of gastric cancer.
The rs751402 C>T polymorphism is located in the E2F1/YY1 binding and response site in the proximal promoter region of XPG [60]. This variant might reduce the DNA repair capacity of XPG by disrupting the DNA binding motifs and altering transcription factor affinities [47]. In our study, rs751402 C>T was significantly associated with overall cancer risk. The TT genotype of rs751402 was associated with an 18% increase in cancer risk compared to the CC genotype. Moreover, a significant association was observed between rs751402 C>T and gastric cancer risk under all genetic models. The rs751402 C>T polymorphism is likely to influence cancer risk by regulating XPG expression, but its effect on XPG function is not yet clear [47].
The rs2094258 C>T polymorphism is located in a transcription factor binding site in the 5’ region of the XPG gene. We found that the association between rs2094258 C>T and overall cancer risk was borderline significant. Individuals with the TT genotype of rs2094258 had a 9% higher risk of cancer compared to those with the CC genotype. However, the association was not significant in gastric cancer, indicating that it may not impact gastric cancer risk. Significant associations were observed among some subgroups for all other selected SNPs. We found that the C allele of rs1047768 may increase the risk of lung cancer. Moreover, the C allele of rs2227869 significantly reduced cancer risk in population-based studies. No statistically significant association was observed between rs2296147 T>C and overall cancer risk.
Although we found significant associations between SNPs in the XPG gene and cancer risk, our study had several limitations. First, although Egger’s tests showed no obvious publication bias, some bias was unavoidable since only studies published in English and Chinese were included in our meta-analysis. Second, we observed significant heterogeneity in some of our analyses, which is a common drawback of a meta-analysis. Third, due to a lack of sufficient individual data, we were unable to perform multivariate analysis with adjustment for potential confounding factors such as tobacco use, alcohol consumption, and other carcinogenic factors.
Our study is the first meta-analysis of the association between the six selected SNPs in XPG gene and cancer risk. The results indicate that the AA genotype of rs873601 increases overall cancer risk. Additionally, rs751402 C>T and rs873601 G>A were associated with gastric cancer risk. Finally, rs1047768 T>C was found to confer susceptibility to lung cancer. Further epidemiological investigations with larger sample sizes are warranted to validate our findings. Functional studies are also required to elucidate the mechanisms by which these SNPs modify cancer risk.
MATERIALS AND METHODS
Study identification
We searched multiple databases including PubMed, Scopus, Web of Science, CNKI, and the WanFang database using combinations of keywords such as “XPG”, “polymorphism”, and “cancer” as well as synonyms “Xeroderma pigmentosum group G, ERCC5 or Excision repair cross complementing group 5”, “variant or variation”, and “tumor, neoplasm, or carcinoma”. Human studies published before December 20, 2016 in either English or Chinese were included. The reference lists in eligible studies and review articles were examined in order to identify additional relevant studies. In cases of study population overlap, the study with the largest sample size was selected.
Inclusion and exclusion criteria
All studies included in this analysis were required to meet the following criteria: (1) study of the associations between any of the six potentially functional SNPs: rs1047768 T>C, rs2296147 T>C, rs2227869 G>C, rs2094258 C>T, rs751402 C>T, and rs873601 G>A in the XPG gene and cancer risk; (2) case-control study; and (3) sufficient genotype data available to calculate ORs and 95% CIs. The exclusion criteria were: (1) studies conducted in the same or overlapping population and (2) review article or conference report.
Data extraction
Key information was independently extracted from eligible studies by two investigators and included the following items: the first author, year of publication, type of cancer, country, ethnicity, control source, number of cases and controls, the quantity of each genotype in cases and controls, minor allele frequency (MAF), and the Hardy-Weinberg equilibrium (HWE) test P value for the control subjects. Disagreements regarding these items were resolved through discussion.
Statistical analysis
Chi-square tests were used to test deviation from HWE in the study control groups. Genetic associations between the six selected SNPs in the XPG gene and cancer risk were assessed using the crude ORs and corresponding 95% CIs under homozygous, heterozygous, recessive, dominant, and allele contrast models. Heterogeneity between studies was assessed using the Q and I2 values. A random effects model was adopted to calculate the pooled OR and 95% CI in the case of Phet < 0.1 or I2 > 50%. Otherwise, a fixed effects model was applied. Stratified analyses were conducted by ethnicity (Asians and Caucasians), source of control [population-based (PB) or hospital-based (HB)], and cancer type.
Sensitivity analyses were performed to assess the influence of the individual studies on the pooled OR by sequentially removing one study at a time and recalculating the pooled OR. Egger’s tests were used to evaluate publication bias. FPRP analysis [61, 62] and TSA were performed as described previously [63]. All statistical analyses were performed using the STATA 12.0 software (Stata Corporation, College Station, TX, USA). All statistics were two-sided. P values < 0.05 were considered statistically significant.
CONFLICTS OF INTEREST
The authors declare that there are no conflicts of interest.
FUNDING
This study was supported by a grant from the Natural Science Foundation of Guangdong Province (No. 2015A030310324).
REFERENCES
1. Ferlay J, Soerjomataram I, Dikshit R, Eser S, Mathers C, Rebelo M, Parkin DM, Forman D, Bray F. Cancer incidence and mortality worldwide: sources, methods and major patterns in GLOBOCAN 2012. Int J Cancer. 2015; 136:E359–86.
2. Torre LA, Bray F, Siegel RL, Ferlay J, Lortet-Tieulent J, Jemal A. Global cancer statistics, 2012. CA Cancer J Clin. 2015; 65:87–108.
3. Wood RD, Mitchell M, Sgouros J, Lindahl T. Human DNA repair genes. Science. 2001; 291:1284–89.
4. Emmert S, Schneider TD, Khan SG, Kraemer KH. The human XPG gene: gene architecture, alternative splicing and single nucleotide polymorphisms. Nucleic Acids Res. 2001; 29:1443–52.
5. O’Donovan A, Davies AA, Moggs JG, West SC, Wood RD. XPG endonuclease makes the 3’ incision in human DNA nucleotide excision repair. Nature. 1994; 371:432–35.
6. Cheng L, Sturgis EM, Eicher SA, Spitz MR, Wei Q. Expression of nucleotide excision repair genes and the risk for squamous cell carcinoma of the head and neck. Cancer. 2002; 94:393–97.
7. Moreno V, Gemignani F, Landi S, Gioia-Patricola L, Chabrier A, Blanco I, González S, Guino E, Capellà G, Canzian F. Polymorphisms in genes of nucleotide and base excision repair: risk and prognosis of colorectal cancer. Clin Cancer Res. 2006; 12:2101–08.
8. Shen M, Berndt SI, Rothman N, Demarini DM, Mumford JL, He X, Bonner MR, Tian L, Yeager M, Welch R, Chanock S, Zheng T, Caporaso N, Lan Q. Polymorphisms in the DNA nucleotide excision repair genes and lung cancer risk in Xuan Wei, China. Int J Cancer. 2005; 116:768–73.
9. Sakoda LC, Loomis MM, Doherty JA, Julianto L, Barnett MJ, Neuhouser ML, Thornquist MD, Weiss NS, Goodman GE, Chen C. Germ line variation in nucleotide excision repair genes and lung cancer risk in smokers. Int J Mol Epidemiol Genet. 2012; 3:1–17.
10. He J, Qiu LX, Wang MY, Hua RX, Zhang RX, Yu HP, Wang YN, Sun MH, Zhou XY, Yang YJ, Wang JC, Jin L, Wei QY, Li J. Polymorphisms in the XPG gene and risk of gastric cancer in Chinese populations. Hum Genet. 2012; 131:1235–44.
11. Yang WG, Zhang SF, Chen JW, Li L, Wang WP, Zhang XF. SNPs of excision repair cross complementing group 5 and gastric cancer risk in Chinese populations. Asian Pac J Cancer Prev. 2012; 13:6269–72.
12. Abbasi R, Ramroth H, Becher H, Dietz A, Schmezer P, Popanda O. Laryngeal cancer risk associated with smoking and alcohol consumption is modified by genetic polymorphisms in ERCC5, ERCC6 and RAD23B but not by polymorphisms in five other nucleotide excision repair genes. Int J Cancer. 2009; 125:1431–39.
13. Duan WX, Hua RX, Yi W, Shen LJ, Jin ZX, Zhao YH, Yi DH, Chen WS, Yu SQ. The association between OGG1 Ser326Cys polymorphism and lung cancer susceptibility: a meta-analysis of 27 studies. PLoS One. 2012; 7:e35970.
14. García-Closas M, Malats N, Real FX, Welch R, Kogevinas M, Chatterjee N, Pfeiffer R, Silverman D, Dosemeci M, Tardón A, Serra C, Carrato A, García-Closas R, et al. Genetic variation in the nucleotide excision repair pathway and bladder cancer risk. Cancer Epidemiol Biomarkers Prev. 2006; 15:536–42.
15. Zienolddiny S, Campa D, Lind H, Ryberg D, Skaug V, Stangeland L, Phillips DH, Canzian F, Haugen A. Polymorphisms of DNA repair genes and risk of non-small cell lung cancer. Carcinogenesis. 2006; 27:560–67.
16. Xie WM. Association between the nucleotide excision repair (NER) genes polymorphisms and genetic susceptibility and clinical phenotype of hepatocellular carcinoma. [Article in Chinese] Shanxi Medical University. 2007.
17. Hussain SK, Mu LN, Cai L, Chang SC, Park SL, Oh SS, Wang Y, Goldstein BY, Ding BG, Jiang Q, Rao J, You NC, Yu SZ, et al. Genetic variation in immune regulation and DNA repair pathways and stomach cancer in China. Cancer Epidemiol Biomarkers Prev. 2009; 18:2304–09.
18. Ma H, Yu H, Liu Z, Wang LE, Sturgis EM, Wei Q. Polymorphisms of XPG/ERCC5 and risk of squamous cell carcinoma of the head and neck. Pharmacogenet Genomics. 2012; 22:50–57.
19. He J. Polymorphisms in nucleotide excision repair genes and gastric cancer risk. Fudan University. 2013.
20. Paszkowska-Szczur K, Scott RJ, Serrano-Fernandez P, Mirecka A, Gapska P, Górski B, Cybulski C, Maleszka R, Sulikowski M, Nagay L, Lubinski J, Debniak T. Xeroderma pigmentosum genes and melanoma risk. Int J Cancer. 2013; 133:1094–100.
21. Camilleri M, Shin A, Busciglio I, Carlson P, Acosta A, Bharucha AE, Burton D, Lamsam J, Lueke A, Donato LJ, Zinsmeister AR. Genetic variation in GPBAR1 predisposes to quantitative changes in colonic transit and bile acid excretion. Am J Physiol Gastrointest Liver Physiol. 2014; 307:G508–16.
22. Mirecka A, Paszkowska-Szczur K, Scott RJ, Górski B, van de Wetering T, Wokolorczyk D, Gromowski T, Serrano-Fernandez P, Cybulski C, Kashyap A, Gupta S, Golab A, Slojewski M, et al. Common variants of xeroderma pigmentosum genes and prostate cancer risk. Gene. 2014; 546:156–61.
23. Li XC, Xiong JG, Cheng ZW, Wu J, Liu QS. Association between XPG polymorphisms and risk of gastric cancer. Chin J Gastroenterol Hepatol. 2014; 23:259–62.
24. Na N, Dun E, Ren L, Li G. Association between ERCC5 gene polymorphisms and breast cancer risk. Int J Clin Exp Pathol. 2015; 8:3192–97.
25. Paszkowska-Szczur K, Scott RJ, Górski B, Cybulski C, Kurzawski G, Dymerska D, Gupta S, van de Wetering T, Masojc B, Kashyap A, Gapska P, Gromowski T, Kladny J, et al. Polymorphisms in nucleotide excision repair genes and susceptibility to colorectal cancer in the Polish population. Mol Biol Rep. 2015; 42:755–64.
26. He J, Wang F, Zhu J, Zhang R, Yang T, Zou Y, Xia H. Association of potentially functional variants in the XPG gene with neuroblastoma risk in a Chinese population. J Cell Mol Med. 2016; 20:1481–90.
27. Hua RX, Zhuo ZJ, Zhu J, Zhang SD, Xue WQ, Zhang JB, Xu HM, Li XZ, Zhang PF, He J, Jia WH. XPG Gene Polymorphisms Contribute to Colorectal Cancer Susceptibility: A Two-Stage Case-Control Study. J Cancer. 2016; 7:1731–39.
28. Hua RX, Zhuo ZJ, Zhu J, Jiang DH, Xue WQ, Zhang SD, Zhang JB, Li XZ, Zhang PF, Jia WH, Shen GP, He J. Association between genetic variants in the XPG gene and gastric cancer risk in a Southern Chinese population. Aging (Albany NY). 2016; 8:3311–20. doi: 10.18632/aging.101119.
29. Li RJ, Li M, Liu GJ, Guo YW, Bai H, Xiao P, Mei JZ. Association between ERCC5 gene polymorphisms and gastric cancer risk in a Chinese population. Genet Mol Res. 2016; 15.
30. Bai Y, Li H, Li Y, Wang L, Fang XJ. Role of ERCC5 His1104Asp and His46His gene polymorphisms in the development of gastric cancer risk in a Chinese Han population. Int J Clin Exp Pathol. 2016; 9:3925–30.
31. Wang M, Li Q, Gu C, Zhu Y, Yang Y, Wang J, Jin L, He J, Ye D, Wei Q. Polymorphisms in nucleotide excision repair genes and risk of primary prostate cancer in Chinese Han populations. Oncotarget. 2017;8:24362-24371. doi: 10.18632/oncotarget.13848.
32. Xie W. Association between the nucleotide excision repair (NER) genes polymorphisms and genetic susceptibility and clinical phenotype of hepatocellular carcinoma. 2007.
33. Doherty JA, Weiss NS, Fish S, Fan W, Loomis MM, Sakoda LC, Rossing MA, Zhao LP, Chen C. Polymorphisms in nucleotide excision repair genes and endometrial cancer risk. Cancer Epidemiol Biomarkers Prev. 2011; 20:1873–82.
34. Zhu ML, Shi TY, Hu HC, He J, Wang M, Jin L, Yang YJ, Wang JC, Sun MH, Chen H, Zhao KL, Zhang Z, Chen HQ, et al. Polymorphisms in the ERCC5 gene and risk of esophageal squamous cell carcinoma (ESCC) in Eastern Chinese populations. PLoS One. 2012; 7:e41500.
35. Yang B, Chen WH, Wen XF, Liu H, Liu F. Role of DNA repair-related gene polymorphisms in susceptibility to risk of prostate cancer. Asian Pac J Cancer Prev. 2013; 14:5839–42.
36. Chen YZ, Guo F, Sun HW, Kong HR, Dai SJ, Huang SH, Zhu WW, Yang WJ, Zhou MT. Association between XPG polymorphisms and stomach cancer susceptibility in a Chinese population. J Cell Mol Med. 2016; 20:903–08.
37. Sun Z. The study of the rationship between XPG gene polymorphism and sensitivity of chemotherapy for nasopharyngeal carcinoma. [Article in Chinese] Nanchang University. 2015
38. Huang WY, Berndt SI, Kang D, Chatterjee N, Chanock SJ, Yeager M, Welch R, Bresalier RS, Weissfeld JL, Hayes RB. Nucleotide excision repair gene polymorphisms and risk of advanced colorectal adenoma: XPC polymorphisms modify smoking-related risk. Cancer Epidemiol Biomarkers Prev. 2006; 15:306–11.
39. Hooker S, Bonilla C, Akereyeni F, Ahaghotu C, Kittles RA. NAT2 and NER genetic variants and sporadic prostate cancer susceptibility in African Americans. Prostate Cancer Prostatic Dis. 2008; 11:349–56.
40. Santos LS, Gomes BC, Gouveia R, Silva SN, Azevedo AP, Camacho V, Manita I, Gil OM, Ferreira TC, Limbert E, Rueff J, Gaspar JF. The role of CCNH Val270Ala (rs2230641) and other nucleotide excision repair polymorphisms in individual susceptibility to well-differentiated thyroid cancer. Oncol Rep. 2013; 30:2458–66.
41. Sun Y, Tan L, Li H, Qin X, Liu J. Association of NER pathway gene polymorphisms with susceptibility to laryngeal cancer in a Chinese population. Int J Clin Exp Pathol. 2015; 8:11615–21.
42. Feng YB, Fan DQ, Yu J, Bie YK. Association between XPG gene polymorphisms and development of gastric cancer risk in a Chinese population. Genet Mol Res. 2016; 15.
43. Lu JJ, Zhang HQ, Mai P, Ma X, Chen X, Yang YX, Zhang LP. Lack of association between ERCC5 gene polymorphisms and gastric cancer risk in a Chinese population. Genet Mol Res. 2016; 15.
44. Ma SH, Ling FH, Sun YX, Chen SF, Li Z. Investigation on the role of XPG gene polymorphisms in breast cancer risk in a Chinese population. Genet Mol Res. 2016; 15.
45. Yang LQ, Zhang Y, Sun HF. Investigation on ERCC5 genetic polymorphisms and the development of gastric cancer in a Chinese population. Genet Mol Res. 2016; 15.
46. Ying MF, Zhao R. Role of single nucleotide polymorphisms of DNA repair genes in susceptibility to pancreatic cancer in Chinese population. Genet Mol Res. 2016; 15.
47. Wang H, Wang T, Guo H, Zhu G, Yang S, Hu Q, Du Y, Bai X, Chen X, Su H. Association analysis of ERCC5 gene polymorphisms with risk of breast cancer in Han women of northwest China. Breast Cancer. 2016; 23:479–85.
48. Meng X, Wang QX, Chen MY, Qin G, Wang YP, Liu WX. DNA repair gene polymorphisms in ERCC4 rs6498486 and ERCC5 rs751402 and risk of salivary gland tumors. [Article in Chinese] Shanghai Kou Qiang Yi Xue. 2013; 22:438–42.
49. Zavras AI, Yoon AJ, Chen MK, Lin CW, Yang SF. Association between polymorphisms of DNA repair gene ERCC5 and oral squamous cell carcinoma. Oral Surg Oral Med Oral Pathol Oral Radiol. 2012; 114:624–29.
50. Yoon AJ, Kuo WH, Lin CW, Yang SF. Role of ERCC5 polymorphism in risk of hepatocellular carcinoma. Oncol Lett. 2011; 2:911–14.
51. Guo BW, Yang L, Zhao R, Hao SZ. Association between ERCC5 gene polymorphisms and gastric cancer risk. Genet Mol Res. 2016; 15.
52. Zhou RM, Niu CX, Wang N, Liu L, Huang X, Chen ZF, Huo XR, Hao YL, Li Y. XPG Gene Polymorphisms and the Risk of Gastric Cardia Adenocarcinoma. Genet Test Mol Biomarkers. 2016; 20:432–37.
53. Zhao F, Shang Y, Zeng C, Gao D, Li K. Association of single nucleotide polymorphisms of DNA repair genes in NER pathway and susceptibility to pancreatic cancer. Int J Clin Exp Pathol. 2015; 8:11579–86.
54. Wang B, Xu Q, Yang HW, Sun LP, Yuan Y. The association of six polymorphisms of five genes involved in three steps of nucleotide excision repair pathways with hepatocellular cancer risk. Oncotarget. 2016; 7:20357–67. doi: 10.18632/oncotarget.7952.
55. Friedberg EC. How nucleotide excision repair protects against cancer. Nat Rev Cancer. 2001; 1:22–33.
56. Zhu ML, Wang M, Cao ZG, He J, Shi TY, Xia KQ, Qiu LX, Wei QY. Association between the ERCC5 Asp1104His polymorphism and cancer risk: a meta-analysis. PLoS One. 2012; 7:e36293.
57. Hung RJ, Christiani DC, Risch A, Popanda O, Haugen A, Zienolddiny S, Benhamou S, Bouchardy C, Lan Q, Spitz MR, Wichmann HE, LeMarchand L, Vineis P, et al. International Lung Cancer Consortium: pooled analysis of sequence variants in DNA repair and cell cycle pathways. Cancer Epidemiol Biomarkers Prev. 2008; 17:3081–89.
58. Ding DP, He XF, Zhang Y. Lack of association between XPG Asp1104His and XPF Arg415Gln polymorphism and breast cancer risk: a meta-analysis of case-control studies. Breast Cancer Res Treat. 2011; 129:203–09.
59. Geng P, Ou J, Li J, Liao Y, Wang N, Xie G, Sa R, Liu C, Xiang L, Liang H. A Comprehensive Analysis of Influence ERCC Polymorphisms Confer on the Development of Brain Tumors. Mol Neurobiol. 2016; 53:2705–14.
60. Blomquist TM, Crawford EL, Willey JC. Cis-acting genetic variation at an E2F1/YY1 response site and putative p53 site is associated with altered allele-specific expression of ERCC5 (XPG) transcript in normal human bronchial epithelium. Carcinogenesis. 2010; 31:1242–50.
61. He J, Wang MY, Qiu LX, Zhu ML, Shi TY, Zhou XY, Sun MH, Yang YJ, Wang JC, Jin L, Wang YN, Li J, Yu HP, Wei QY. Genetic variations of mTORC1 genes and risk of gastric cancer in an Eastern Chinese population. Mol Carcinog. 2013; 52:E70–79.
62. Fu W, Zhuo ZJ, Chen YC, Zhu J, Zhao Z, Jia W, Hu JH, Fu K, Zhu SB, He J, Liu GC. NFKB1 -94insertion/deletion ATTG polymorphism and cancer risk: evidence from 50 case-control studies. Oncotarget. 2017; 8:9806–22. doi: 10.18632/oncotarget.14190.
63. Xie S, Shan XF, Shang K, Xu H, He J, Cai ZG. Relevance of LIG4 gene polymorphisms with cancer susceptibility: evidence from a meta-analysis. Sci Rep. 2014; 4:6630.