
INTRODUCTION
Gastric cancer (GC) is the second common cancer of gastrointestinal tumor worldwide with high mortality rate due to poor prognoses and inadequate therapy [1, 2], especially in China [3]. As it is well known, unhealthy lifestyles and unsafe surroundings are the main etiology of for the GC [4], furthermore, genetic factors are believed the predominant cause for the occurrence of GC, and some studies have verified that the variant of telomere length have an association with the risk of GC [5].
Telomere, a special structure, is composed of shorter repeated non-transcribed sequences (TTAGGG) and binding proteins. Telomere can not only protect the ends of chromosome against fusion and degradation but also plays an important role in cell apoptosis, cell transformation and immortalization. Some evidence indicated that variation of telomere length was related to increased several kinds of human cancer risk, including melanoma [6], breast cancer [7] and bladder cancer [8]. At the same time, study has reported that ZNF308, TERC, TERT, OBFC1, NAF1, RTEL1, ACYP2 genes had a relationship with telomere length [9]. Furthermore, the variant of ACYP2 gene was confirmed the association with coronary heart disease in Chinese Han population [10]. However, the association between ACYP2 polymorphism and the GC risk has not been researched previously.
ACPY2 , which is located in chromosome 2p16.2, encodes a small cytosolic enzyme acylphosphatase that can hydrolyze the synthetic of carboxyl phosophate bond [11]. Much of the information has displayed that acylphosphatase has an effect on the transport of Calcium ion across biological membranes and may be associated with cellular apoptosis [12, 13]. Previously ACYP2 genetic polymorphism study was researched on single nucleotide polymorphisms ( SNPs ) associated with colorectal cancer risk in genome-wide association study [14]. However, if ACYP2 gene is also the shared risk gene for GC is unknown, and this need to be researched. It is curious to hypothesize that the polymorphisms of ACYP2 may lead to different susceptibilities to GC. The purpose of the present case-control study was to identify the association between 13 high frequency SNPs of ACYP2 and GC risk in the Northwest Chinese Han population.
RESULTS
Characteristic of the study participants GC
A number of 300 healthy controls and 302 GC patients were enrolled in our study. Baseline characteristics of the control and GC patients groups were evaluated, and we found that both gender and age have a significant difference between control group and case group (P < 0.001, P < 0.001 respectively) (Table 1). Therefore, the ACYP2 polymorphisms analysis, along with age and gender, were adjusted further for unconditional multivariate regression analysis in this case control study.
Table 1: Characteristic of the control individuals and patients with gastric cancer
Characteristic |
control (N = 300) |
Case (N = 302) |
p-value |
|---|---|---|---|
Sex (%) |
< 0.001a |
||
female |
120 (40%) |
69 (22.8%) |
|
male |
180 (60%) |
233 (77.2%) |
|
Mean age ± SD |
58.01 ± 5.14 |
60.42 ± 11.27 |
< 0.001b |
aP value is calculated by Pearson’s Chi-square test. bP value is calculated by Welch’s t test.
SNPs associated with the GC risk under allelic model
The characteristic of candidate SNPs were exhibited in Table 2, containing position, role, risk allele and allele frequencies. Allele frequencies in cases and controls were tested for departure from Hardy-Weinberg equilibrium using a Fisher’s exact test (Table 2). None was excluded because of having not a significant deviation from HWE (P > 0.05). Chi-square test was used to describe the association between the minor allele and the risk of GC. The odds ratio (OR), confidence interval (CI) and p value showed that the variants of seven SNPs had an association with the risk of GC in the allelic model analysis. From Table 2, the minor allele “G” of rs6713088 increased the risk of GC by 1.302-fold (95% CI = 1.034–1.64, P = 0.024) and the minor allele “G” of rs11896604 also associated with GC risk by 1.406-fold (95% CI = 1.06–1.865, P = 0.018). Similarly, rs11125529 minor allele “A”, rs12615793 minor allele “A” and rs843706 minor allele “A” elevated the GC susceptibility by 1.419-fold (95% CI = 1.066–1.889, P = 0.016), 1.392-fold (95% CI = 1.054–1.838, P = 0.02) and 1.347-fold (95% CI = 1.071–1.694, P = 0.011) respectively. Rs843711 risk allele “T’ frequency in case and control had a significant difference and the variant increased the GC risk (OR = 1.4, 95% CI = 1.115–1.758, P = 0.004). For rs17045754 risk allele “C”, it had the same effect on the risk of GC (OR = 1.376, 95% CI = 1.071–1.694, P = 0.011). The remaining sites were detached from the further model analysis. However, After Bonferroni’s multiple adjustment, no variants of SNPs was significant associated with GC risk.
Table 2: Allele frequencies of candidate SNPs examined in the ACYP2 gene among the cases and controls and odds ratio estimates for gastric cancer
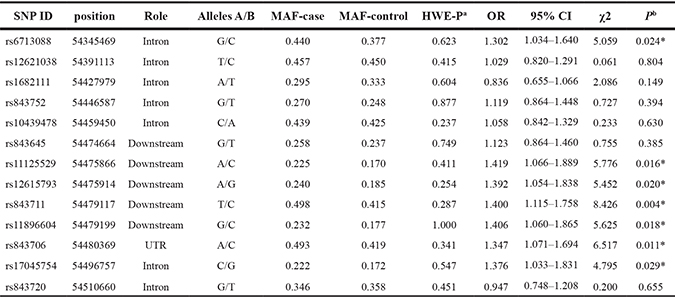
Abbreviations: SNPs: Single nucleotide polymorphisms; A: Miner alleles, B: Major alleles; MAF: Minor allele frequency;
HWE: Hardy-Weinberg equilibrium; OR: Odds ratio. CI: Confidence interval;
aP values were calculated using exact test; bP values were calculated using Chi-square test; *P < 0.05 indicates statistical significance;
Bonferroni’s multiple adjustment was applied to the level of significance, which was set at P < 0.00078 (0.05/65).
Genotypes and the risk of GC
The genotype frequencies of SNPs in the GC patients and controls showed that, rs11125529, rs12615793, rs843711, rs11896604, rs843706 and rs17045754 were significantly correlated with GC risk by unconditional logistic regression adjusted by gender and age (P < 0.05) (Table 3). The rs11125529 mutant genotype “AA” compared to wild genotype “CC” and the rs12615793 mutant genotype “AA” compared to wild genotype “GG” were associated with a significant increased the risk of GC (rs11125529 OR = 4.008, 95% CI = 1.538–10.45, P = 0.005; rs12615793 OR = 3.68, 95% CI = 1.501–9.02, P = 0.004). The significantly risk effects were also found in the rs843711 variant genotypes “TT” and rs11896604 variant genotypes “GG” (rs843711 TT vs CC OR = 1.909, 95% CI = 1.17–3.115, P = 0.009, rs11896604 GG vs CC OR = 2.739, 95% CI = 1.197–6.265, P = 0.017). In addition, the rs843706 mutant genotype “AA” and rs17045754 mutant genotype “GG” were associated with a statistically significantly increased risk of GC compared with the “CC” genotype and “GG” genotypes respectively (rs843706 OR = 1.75, 95% CI = 1.067–2.872, P = 0.027; rs17045754 OR = 3.147, 95% CI = 1.252–7.906, P = 0.015). However, our data showed none of the SNPs had the association with GC susceptibility under the genotypes of heterozygous minor alleles (P > 0.05) (Table 3) and no difference of genotype distribution of rs6713088 was found between the cases and controls. Unfortunately, these SNPs neither in recessive model nor in addictive model were significantly associated with GC risk after Bonferroni’s multiple adjusted.
Table 3: Distribution of genotypes of prominent SNPS and their associations with the risk of developing gastric cancer
SNP ID |
Alleles A/B |
genetype |
No. (frequency) |
Logistic regression |
||
|---|---|---|---|---|---|---|
Case (%) |
Control (%) |
OR (95% CI) |
Pa |
|||
rs6713088 |
G/C |
CC |
97 (32.12) |
114 (38) |
1 |
|
GG |
61 (20.20) |
40 (13.33) |
1.529(0.93–2.512) |
0.094 |
||
GC |
144 (47.68) |
146 (48.46) |
1.144(0.793–1.65) |
0.472 |
||
rs11125529 |
A/C |
CC |
186 (61.59) |
204 (68) |
1 |
|
AA |
20 (6.62) |
6 (2) |
4.008(1.538–10.45) |
0.005* |
||
AC |
96 (31.79) |
90 (30) |
1.174(0.819–1.684) |
0.382 |
||
rs12615793 |
A/G |
GG |
179 (59.27) |
196 (65.33) |
1 |
|
AA |
22 (7.28) |
7 (2.33) |
3.68(1.501–9.02) |
0.004* |
||
AG |
101 (33.44) |
97 (32.33) |
1.183(0.829–1.688) |
0.355 |
||
rs843711 |
T/C |
CC |
74 (24.5) |
98 (32.67) |
1 |
|
TT |
73 (24.17) |
47 (15.67) |
1.909(1.17–3.115) |
0.009* |
||
TC |
155 (52.36) |
155 (51.67) |
1.281(0.87–1.887) |
0.209 |
||
rs11896604 |
G/C |
CC |
183 (60.6) |
203 (67.67) |
1 |
|
GG |
21 (6.95) |
9 (3) |
2.739(1.197–6.265) |
0.017* |
||
GC |
98 (32.45) |
88 (29.33) |
1.226(0.854–1.759) |
0.269 |
||
rs843706 |
A/C |
CC |
72 (24.32) |
96 (32.21) |
1 |
|
AA |
68 (22.97) |
48 (16.11) |
1.75(1.067–2.872) |
0.027* |
||
AC |
156 (52.7) |
154 (51.68) |
1.294(0.876–1.914) |
0.196 |
||
rs17045754 |
C/G |
GG |
186 (61.59) |
204 (68) |
1 |
|
CC |
18 (5.96) |
7 (2.33) |
3.147(1.252–7.906) |
0.015* |
||
CG |
98 (32.45) |
89 (29.67) |
1.224(0.854–1.754) |
0.272 |
||
Abbreviations: A: Miner alleles, B: Major alleles; OR: Odds ratio, CI: Confidence interval;
aP values were calculated by Wald test adjusted by gender and age; *P < 0.05 indicates statistical significance.
Bonferroni’s multiple adjustment was applied to the level of significance, which was set at P < 0.00078 (0.05/65).
We further analyzed the association between prominent SNPs and GC risk by Wald test using three models, containing dominant model, additive model and recessive model adjusted for gender and age (Table 4). We found that rs11125529, rs12615793, rs843711, rs11896604, and rs17045754 were related to an increased risk with GC under both additive model and recessive model (P < 0.05). For the rs843706, under additive model, the association with GC risk was obvious (OR = 1.32, 95% CI = 1.033–1.687, P = 0.027), while, the association was not exist under recessive model. None of SNPs have a connection with the risk of GC under dominant model.
Table 4: Association of prominent SNPs with the gastric cancer based on logistic tests adjusted by gender and age
SNP ID |
Minor allele |
Dominant model |
Additive model |
Recessive model |
|||
|---|---|---|---|---|---|---|---|
OR (95% CI) |
pa |
OR (95% CI) |
pa |
OR (95% CI) |
pa |
||
rs6713088 |
G |
1.231 (0.87–1.74) |
0.241 |
1.218 (0.959–1.547) |
0.106 |
1.413 (0.902–2.213) |
0.131 |
rs11125529 |
A |
1.344 (0.951–1.899) |
0.094 |
1.438 (1.073–1.928) |
0.015* |
3.804 (1.47–9.845) |
0.006* |
rs12615793 |
A |
1.348 (0.9586–1.897) |
0.086 |
1.436 (1.078–1.913) |
0.013* |
3.47 (1.428–8.429) |
0.006* |
rs843711 |
T |
1.429 (0.989–2.064) |
0.058 |
1.372 (1.076–1.748) |
0.011* |
1.625 (1.068–2.472) |
0.023* |
rs11896604 |
G |
1.363 (0.9656–1.923) |
0.078 |
1.398 (1.051–1.86) |
0.021* |
2.564 (1.13–5.815) |
0.024* |
rs843706 |
A |
1.404 (0.9669–2.037) |
0.075 |
1.32 (1.033–1.687) |
0.027* |
1.478 (0.9678–2.256) |
0.071 |
rs17045754 |
C |
1.357 (0.96–1.918) |
0.084 |
1.411 (1.051–1.894) |
0.022* |
2.946 (1.182–7.343) |
0.02* |
Abbreviation: SNP: Single nucleotide polymorphisms;
aP values were calculated by Wald test adjusted by gender and age; *P < 0.05 indicates statistical significance;
Bonferroni’s multiple adjustment was applied to the level of significance, which was set at P < 0.00078 (0.05/65).
Haplotypes and the risk of GC
Using SHEsis software, two blocks were detected in studied ACYP2 SNPs by haplotype analyses (Figure 1), In block 1, a pair of eight SNPs had an linkage disequilibrium: rs1682111, rs843752, rs10439478, rs843645, rs11125529, rs12615793, rs843711, and rs11896604 and block 2 was containing two SNPs: rs843706 and rs17045754. Haplotypes with frequency more than 1% in the present study were listed in Table 5. The analysis result showed that haplotype “TTCTAATG” had a significant connection with the risk of GC after the adjustment by age and gender (OR = 1.453, 95% CI = 1.083–1.951, P < 0.013). At same time, the rs843706 minor allele “A” and rs17045754 minor allele “C” constituted the haplotype “AC” also increased the risk of GC (OR = 1.444, 95% CI = 1.072–1.944, P = 0.016). On the contrary, the haplotype “CG” was associated with a 0.773-fold reduced risk of GC (95% CI = 0.605–0.989, P = 0.041) (Table 5). The other haplotypes were exhibited to be irrelevant to GC risk.
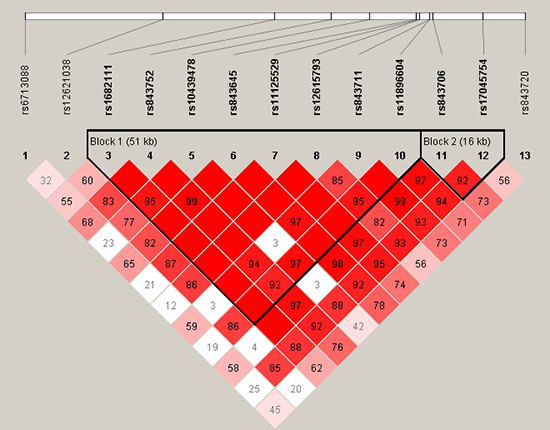
Figure 1: Haplotype block map for part of the SNPs in ACYP2 gene. Linkage disequilibrium plots containing thirteen SNPs from 2p16.2. Standard color frame is used to show LD pattern. Two blocks in the figure showed higher LD. Red squares display statistically significant associations between a pair of SNPs, as measured by D’; darker shades of red indicate higher D’.
Table 5: ACYP2 haplotype frequencies and the association with gastric cancer among the cases and controls
SNPs |
Haplotype |
Freq (case) |
Freq (control) |
Pa |
OR (95% CI) |
Pb |
|---|---|---|---|---|---|---|
rs1682111|rs843752| |
ATATCGCC |
0.293 |
0.328 |
0.192 |
0.8139 (0.6316–1.049) |
0.111 |
TTCTAATG |
0.227 |
0.170 |
0.014* |
1.453 (1.083–1.951) |
0.013* |
|
TGAGCGTC |
0.248 |
0.231 |
0.474 |
1.042 (0.791–1.373) |
0.771 |
|
TTCTCACC |
0.013 |
0.015 |
0.791 |
1.03 (0.379–2.801) |
0.954 |
|
TTCTCGCC |
0.182 |
0.227 |
0.051 |
0.8224 (0.607–1.115) |
0.208 |
|
rs843706|rs17045754 |
AC |
0.220 |
0.166 |
0.019* |
1.444 (1.072–1.944) |
0.016* |
AG |
0.274 |
0.253 |
0.427 |
1.031 (0.788–1.35) |
0.822 |
|
CG |
0.507 |
0.576 |
0.017* |
0.7734 (0.605–0.989) |
0.041* |
aP values were calculated by two side Chi-square test; bP values were calculated by Wald test adjusted by gender and age; *P < 0.05 indicates statistical significance.
DISCUSSION
In our study, we reported the association of tag 13 SNPs in ACYP2 gene with the risk of developing GC in a Northwest Chinese population. Our results reflected that ACYP2 rs6713088, rs11125529, rs12615793, rs843711, rs11896604, rs843706 and rs17045754 were associated with an increased GC risk in the study population; and the associations were disappeared after Bonferroni’s multiple adjusted. Furthermore, Haplotype analysis results showed that haplotypes “TTCTAATG” and “AC” were associated with increased GC risk by unconditional logistic regression analysis adjusted by gender and age. Because of Bonferroni correction is a more rigorous correction method, and truly significant differences may be considered non-significant as a result of type II errors in some cases. Furthermore, we found some SNPs have an association with the risk of GC at the extremely significant difference level P < 0.01, such as minor allele “A” of rs11125529, minor allele of “A” of rs12615793 and minor allele “T” of rs843711. Then ACYP2 gene may have a close connection with the risk of GC. Despite the mechanism of the association between ACYP2 gene and the GC is unclear.
We found a possible association between ACYP2 gene and the risk of gastric cancer by reviewing the literatures. Many researches indicated that ACYP2 gene had a connection with the telomere length, and rs11125529 was published associate with shorter telomere length [15]. Telomeres, the protein-bound DNA repeat structures, are the extreme ends of chromosomes that play a vital role in maintaining genomic stability [16, 17]. It is believed that those individuals who have the shorter telomeres might be more sensitive to some certain diseases compared to the controls. [18]. For example, rs7675998 was found to be related to the onset age of coronary heart disease in a case-control study [10]. Study had reported that gastric patients had remarkably shorter average telomere length than matched controls and the shorter average telomere length had a significantly increased GC risk in the Chinese Han population [5]; in addition, this result also found in the high-risk Polish population [19]. Our result showed that rs11125529 A < C had the association with the increased risk of GC. Thus, ACYP2 genetic variants determining telomere length may have an effect on the GC risk.
Presently, some articles also found that polymorphism of ACYP2 gene have related to cancers. For example, rs1682111 and rs17045754 were associated with the recurrence of breast cancer [20], and three SNP rs1682111, rs11896604 and rs843720 associated with lung cancer [21]. Additional, the rs11896604 significantly decreased the risk of high altitude pulmonary edema after Bonferroni correction [22], and rs843706 and rs17045754 were found increase the risk of ischemic stroke [23]. In this study, our result indicated variants of ACYP2 may be associated with activate the risk of GC. These studies indicate that variants of ACYP2 may influence the risk of many kinds of diseases, and these studies containing this case control study only found the association with diseases in Chinese Han population. Subsequent studies need to be conducted on our findings.
In our study, there were still some deficiencies, for example the relatively small sample size which could decrease the statistical power to detect the function of SNPs on risk of GC. Furthermore, the population of our study is limited in Chinese Han population, and the associations we reported have not been researched in other populations. Lastly, some indicators associated with GC were not compared such as drinking and Helicobacter pylori infection and so on, because of lack of the detailed clinical information which was very difficult to collect. Then, in future study, we need to collect enough information on the characteristic of study subjects in the sample recruiting process.
In summary, our case-control study explored the correlation between 13 SNPs of telomere length related gene ACYP2 with the risk of GC, and the results indicated ACYP2 gene may associated with GC in the Chinese Han population from northwest. This research provided a theoretical evidence and selection for the early diagnosis of GC, and ACYP2 may serve as a potentially precursory biomarker among Chinese population. Whether the results of the study are applicable to other races is still required confirmation by a further research in a larger cohort of GC patients of other nations. Moreover, the details need to be researched to explain the mechanism of the ACYP2 gene associated with GC risk.
MATERIALS AND METHODS
Subject recruitment
The cases were recruited between May 2013 and May 2016 from Shaanxi Provincial People’s Hospital. Eligible cases were 302 patients who were diagnosed by two experienced pathologists, and confirmed gastric cancer according to the World Health Organization criteria [24]. Patients with the following situations were excluded, containing inflammation autoimmune disorders, family history of cancer, and accepted radiotherapy and chemotherapy. The healthy controls were 300 individuals who were cancer-free randomly selected from the hospital in the same study period. All of the information of healthy controls interviewed by the professional interviewers, containing age, gender, family history of cancer and occupational exposure to carcinogens, and the person who possessed these unhealthy factors were removed from this study.
Ethics committee statement
The use of human tissue and the protocol in this study were strictly conformed to the principles expressed in the Declaration of Helsinki and were approved by the Ethical Committee of Shaanxi Provincial People’s Hospital, Xi’an Jiaotong University and Northwest University for approval of research involving human subjects. The individual in this manuscript has given written informed consent to publish these case details.
SNP selection and genotyping
Peripheral blood samples were collected in an anticoagulation tube and stored at –80°C until detection before subjects had received other therapies. Depend on manufacturer′s instructions of the GoldMag-Mini Purification Kit (GoldMag Co.Ltd. Xi′an city, China), genomic DNA was isolated from blood leukocytes samples. At the same time, the concentrations and purity of the DNA were measured by using the NanoDrop 2000 (Thermo Fisher Scientific, Waltham, Massachusetts, USA) at a wavelength of A260 and A280 nm.
A total fourteen SNPs were selected at a minor allele frequency > 5% in the HapMap Chinese Han Beijing (CHB) population. Sequenom Mass-ARRAY RS1000 (Sequenom, San Diego, CA) was used to genotype the SNPs rs6713088, rs12621038, rs1682111, rs843752, rs10439478, rs843645, rs11125529, rs12615793, rs843711, rs11896604, rs843706, rs17045754, and rs843720. Data management and analysis were managed by using Sequenom Typer 4.0 Software (Sequenom Co. Ltd) [25, 26]. The PCR primers for the fourteen selected tSNPs were shown in Table 6.
Table 6: Primers used for this study
SNP-ID |
1st-PCRP |
2nd-PCRP |
UEP_SEQ |
|---|---|---|---|
rs6713088 |
ACGTTGGATGACACA |
ACGTTGGATGGTCA |
gaggcCAGAATGGTCCACTAGAGA |
rs12621038 |
ACGTTGGATGATTGTG |
ACGTTGGATGGGCA |
ccATTGCCTCAGCTAGACT |
rs1682111 |
ACGTTGGATGGAATTG |
ACGTTGGATGGCCA |
tgtcATGCAAAATGAAACAGACACTT |
rs843752 |
ACGTTGGATGTCCTCT |
ACGTTGGATGGAGA |
cGAGTTTGGGTTTGAGGT |
rs10439478 |
ACGTTGGATGTAGCAC |
ACGTTGGATGCTAC |
TTGCTGTTTTCCCAGAA |
rs843645 |
ACGTTGGATGGAAATC |
ACGTTGGATGACAG |
TCATAGGCACTACTGTATC |
rs11125529 |
ACGTTGGATGGAGCTT |
ACGTTGGATGCCGA |
AGAAAAGAAGATGACTAAAACAT |
rs12615793 |
ACGTTGGATGTTTGAG |
ACGTTGGATGATCTT |
AAATTGAGTGACAAATATAAACTAC |
rs843711 |
ACGTTGGATGGACAAA |
ACGTTGGATGTGCCT |
gggaTCAGGGAACCAGTGCAAA |
rs11896604 |
ACGTTGGATGAAGTCA |
ACGTTGGATGTGTCT |
GTTAAGCTTGCAAGGAG |
rs843706 |
ACGTTGGATGTGAAAG |
ACGTTGGATGTGAAT |
cACTTGGTCTTATCTGATGC |
rs17045754 |
ACGTTGGATGCTGTAA |
ACGTTGGATGGAAAT |
caggTATTCAGCTTCCTAGAGTTA |
rs843720 |
ACGTTGGATGCTTCAC |
ACGTTGGATGAGTCA |
ccccAATCTGTCTCAGGGTCTT |
Statistical analysis
Microsoft Excel and SPSS 16.0 (SPSS, Chicago, IL, USA) were used to perform statistical analyses. Throughout the document, P values were two-sided, furthermore, P < 0.05 was thought to have a statistical significant. The differences in the characteristics of the case and control study populations were compared using the chi-squared test (for gender variables) and Welch’s t tests (for age variables). The exact test was used to determine whether the tSNPs departure from Hardy–Weinberg equilibrium (HWE), and Chi-squared test/Fisher’s exact test was used to calculate the differences in frequency distributions of alleles between cases and controls [27]. In order to assess the association between each genotype and the risk of GC, three models were used, including dominant model, recessive model, and additive model. Bonferroni correction was using in our date to eliminate the probability of false-positive finding, and the level of significance was set at P < 0.00078 (0.05/65).
Finally, in the LD analysis, the patterns of linkage disequilibrium (LD) and haplotypes construction were evaluated by the the SHEsis software platform (http://analysis.bio-x.cn/myAnalysis.php) and Haploview software package (version 4.2) [28]. Control samples were used to the haplotype construction. The linkage disequilibrium degree of the two SNPs is measured by D’ value and D’ confidence interval is used to divide haplotype block. The D’ value is between 0 and 1. The closer the |D’| value is to 1, the higher the level of linkage disequilibrium was between the loci. Unconditional logistic regression model adjusted for age and gender was used to calculate odds ratios (ORs) and 95 % confidence intervals (95 % CI) for each polymorphism [29].
Abbreviations
Gastric Cancer: GC; Single nucleotide polymorphism: SNP; Odds ratio: OR; Confidence interval: CI; Linkage disequilibrium: LD.
Authors’ contributions
Jianhui Li and Tianbo Jin not only conceived and designed the experiments, but also contributed reagents/materials/analysis tools. Gang Ma and Jianhui Li wrote the manuscript. Xulong Zhu, Jiangxiong Wang and Cheng Li performed the experiments.
ACKNOWLEDGMENTS AND FUNDING
This work is supported by Shaanxi Province Key Scientific and Technological Innovation Team Project (2014KCF24) and Shaanxi Province Science and Technology Research and Development Project (2013K12-03-27).
CONFLICTS OF INTEREST
The authors have declared that they have no conflict of interest.
REFERENCES
1. Thun MJ, DeLancey JO, Center MM, Jemal A, Ward EM. The global burden of cancer: priorities for prevention. Carcinogenesis. 2010; 31:100–110. doi: 10.1093/carcin/bgp263.
2. Torre LA, Bray F, Siegel RL, Ferlay J, Lortet-Tieulent J, Jemal A. Global cancer statistics, 2012. CA Cancer J Clin. 2015; 65:87–108. doi: 10.3322/caac.21262.
3. Guggenheim DE, Shah MA. Gastric cancer epidemiology and risk factors. J Surg Oncol. 2013; 107:230–236. doi: 10.1002/jso.23262.
4. Saxena A, Nath Prasad K, Chand Ghoshal U, Krishnani N, Roshan Bhagat M, Husain N. Association of Helicobacter pylori and Epstein-Barr virus with gastric cancer and peptic ulcer disease. Scand J Gastroentero. 2008; 43:669–674. doi: 10.1080/00365520801909660.
5. Liu X, Bao G, Huo T, Wang Z, He X, Dong G. Constitutive telomere length and gastric cancer risk: Case-control analysis in Chinese Han population. Cancer Sci. 2009; 100:1300–1305. doi: 10.1111/j.1349-7006.2009.01169.x.
6. Iles MM, Bishop DT, Taylor JC, Hayward NK, Brossard M, Cust AE, Dunning AM, Lee JE, Moses EK, Akslen LA; AMFS Investigators, Andresen PA, Avril MF, et al. The Effect on Melanoma Risk of Genes Previously Associated With Telomere Length. J Natl Cancer I. 2014; 106. doi: 10.1093/jnci/dju267.
7. Shen J, Gammon MD, Terry MB, Wang Q, Bradshaw P, Teitelbaum SL, Neugut AI, Santella RM. Telomere length, oxidative damage, antioxidants and breast cancer risk. Int J Cancer. 2009; 124:1637–1643. doi: 10.1002/ijc.24105.
8. Lin J, Blalock JA, Chen M, Ye Y, Gu J, Cohen L, Cinciripini PM, Wu X. Depressive Symptoms and Short Telomere Length Are Associated with Increased Mortality in Bladder Cancer Patients. Cancer Epidem Biomar. 2014; 24:336–343. doi: 10.1158/1055-9965.EPI-14-0992.
9. Codd V, Nelson CP, Albrecht E, Mangino M, Deelen J, Buxton JL, Hottenga JJ, Fischer K, Esko T, Surakka I, Broer L, Nyholt DR, Mateo Leach I, et al. Identification of seven loci affecting mean telomere length and their association with disease. Nat Genet. 2013; 45:422–427. doi: 10.1038/ng.2528.
10. Ding H, Yan F, Zhou LL, Ji XH, Gu XN, Tang ZW, Chen RH. Association between previously identified loci affecting telomere length and coronary heart disease (CHD) in Han Chinese population. Clin Interv Aging. 2014; 9:857–861. doi: 10.2147/CIA.S60760.
11. Degl’Innocenti D, Marzocchini R, Rosati F, Cellini E, Raugei G, Ramponi G. Acylphosphatase expression during macrophage differentiation and activation of U-937 cell line. Biochimie. 1999; 81:1031–1035. doi: org/10.1016/S0300-908400333-8.
12. Degl’Innocenti D, Ramazzotti M, Marzocchini R, Chiti F, Raugei G, Ramponi G. Characterization of a novel Drosophila melanogaster acylphosphatase. FEBS Lett. 2003; 535:171–174. doi: 10.1016/S0014-579303901-7.
13. Giannoni E, Cirri P, Paoli P, Fiaschi T, Camici G, Manao G, Raugei G, Ramponi G. Acylphosphatase is a strong apoptosis inducer in HeLa cell line. Mol Cell Biol Res Commun. 2000; 3:264–270. doi: 10.1006/mcbr.2000.0228.
14. Oguri T, Mitsuma A, Inada-Inoue M, Morita S, Shibata T, Shimokata T, Sugishita M, Nakayama G, Uehara K, Hasegawa Y. Genetic polymophisms associated with oxaliplatin-induced peripheral neurotoxicity in Japanese patients with colorectal cancer. Int J Clin Pharm Th. 2013; 51:475–481. doi: 10.5414/CP201851.
15. Pooley KA, Bojesen SE, Weischer M, Nielsen SF, Thompson D, Amin Al Olama A, Michailidou K, Tyrer JP, Benlloch S, Brown J, Audley T, Luben R, Khaw KT, et al. A genome-wide association scan (GWAS) for mean telomere length within the COGS project: identified loci show little association with hormone-related cancer risk. Hum Mol Genet. 2013; 22:5056–5064. doi: 10.1093/hmg/ddt355.
16. Blackburn EH. Telomere states and cell fates. Nature. 2000; 408:53–56. doi: 10.1038/35040500.
17. Wong JM, Collins K. Telomere maintenance and disease. Lancet. 2003; 362:983–988. doi: 10.1016/j.neurobiolaging.2010.11.013.
18. Harris SE, Martin-Ruiz C, von Zglinicki T, Starr JM, Deary IJ. Telomere length and aging biomarkers in 70-year-olds: the Lothian Birth Cohort 1936. Neurobiol Aging. 2012; 33:1486. e3–e8. doi: 10.1016/j.neurobiolaging.2010.11.013.
19. Hou L, Savage SA, Blaser MJ, Perez-Perez G, Hoxha M, Dioni L, Pegoraro V, Dong LM, Zatonski W, Lissowska J, Chow WH, Baccarelli A. Telomere length in peripheral leukocyte DNA and gastric cancer risk. Cancer Epidem Biomar. 2009; 18:3103–3109. doi: 10.1158/1055-9965.EPI-09-0347.
20. Zhang F, Zhang Y, Deng Z, Xu P, Zhang X, Jin T, Liu Q. Genetic variants in the acylphosphatase 2 gene and the risk of breast cancer in a Han Chinese population. Oncotarget. 2016; 7:86704–86712. doi: 10.18632/oncotarget.13495.
21. Chen N, Yang X, Guo W, You J, Wu Q, Zhang G, Li H, Geng D, Jin T, Fu J, Zhang Y. Association of polymorphisms in the telomere-related gene ACYP2 with lung cancer risk in the Chinese Han population. Oncotarget. 2016; 7:87473–87478. doi: 10.18632/oncotarget.13870.
22. He Y, Chen J, Zhang X, Li X, Du J, He X, Zhang Z, Zhang Y, Kang L, Jin T, Yuan DY. Telomere length related gene ACYP2 polymorphism is associated with the risk of HAPE in Chinese Han population. J Gene Med. 2016; 18: 244–249. doi: 10.1002/jgm.2896.
23. Liang Y, Zhang R, Zhang S, Ji G, Shi PY, Tian Y, Feng L, Jing F, Li C, Guo DS, Chen MW. Association of ACYP2 and TSPYL6 Genetic Polymorphisms with Risk of Ischemic Stroke in Han Chinese Population. Mol Neurobiol. 2016:1–8. doi: 10.1007/s12035-016-0086-x.
24. Hamilton SD, Vogelstein B, Kudo S, Riboli E, Nakamura SH, Hainaut P, Rubio CA, Sobin LH, Fogt F, Winawer SJ, Goldgar DE, Jass JR. Tumours of the colon and rectum: Carcinoma of the colon and rectum. Pathology and Genetics of Tumours of the Digestive System Lyon, France: IARC Press. 2000:105–119.
25. Gabriel S, Ziaugra L, Tabbaa D. SNP genotyping using the Sequenom MassARRAY iPLEX platform. Curr Protoc Hum Genet. 2009; 2:12. doi: 10.1002/0471142905.hg0212s60.
26. Thomas RK, Baker AC, DeBiasi RM, Winckler W, LaFramboise T, Lin WM, Wang M, Feng W, Zander T, MacConaill LE, Lee JC, Nicoletti R, Hatton C, et al. High-throughput oncogene mutation profiling in human cancer. Nat Genet. 2007; 39:347–351. doi: 10.1038/ng1975.
27. Adamec C. Example of the use of the nonparametric test. test X2 for comparison of 2 independent example. Cesk Zdrav. 1964; 12:613–619.
28. Shi YY, He L. SHEsis, a powerful software platform for analyses of linkage disequilibrium, haplotype construction, and genetic association at polymorphism loci. Cell Res. 2005; 15:97–98. doi: 10.1038/sj.cr.7290272.
29. Solé X, Guinó E, Valls J, Iniesta R, Moreno V. SNPStats: a web tool for the analysis of association studies. Bioinformatics. 2006; 22:1928–1929. doi: 10.1093/bioinformatics/btl268.