
INTRODUCTION
Esophageal carcinoma (ESCA) is one of the most common malignancies worldwide. ESCA is the seventh leading cause of cancer-correlated mortality in men in the United States in 2016 [1]. It accounts for 4% of all cancer deaths in men [1]. The five-year survival rate of patients with ESCA is currently 20%, but 38% of cases are diagnosed at a late stage, for which the five-year relative survival rate is 4% [1]. The high mortality rate was associated with the late diagnosis and poor treatment response [2, 3]. Early diagnosis and treatment can decrease the mortality and increase the five-year relative survival. Therefore, it is important to identify novel biomarkers for the early diagnosis of ESCA and develop new targeted therapies.
Large quantities of miRNAs have been observed expressing differentially in cancer tissues, which indicate prospective diagnostic values. Some studies showed a number of miRNAs (miR-21, miR-143, miR-145 [4] and miR-92b [5, 6]) as potential biomarkers for the diagnosis of ESCA. However, the clinical value of miRNAs in ESCA remains largely unraveled.
The Cancer Genome Atlas (TCGA) provides a new source of information to identify novel biomarkers. TCGA is a community resource project, and its data have been widely used in cancer research. The TCGA dataset contains 2.5 petabytes of data describing tumor and matched normal tissues from 33 types of cancer with more than 11000 patients. The TCGA ESCA data were updated on May 16, 2016. The number of miRNA and mRNA expression values increased from 1064 to 1881 and 20531 to 60483, respectively. There have been only two studies thus far that used TCGA data regarding ESCA to investigate the expression profiles of miRNAs and genes. Zhan et al. [7] found that 45 miRNAs and 2962 genes were differentially expressed in ESCA compared with normal esophageal tissues, which was based on the TCGA data from July 2014. Additionally, Zhao et al. [8] only focused on the differentially expressed miRNAs (DEMs) in ESCA and investigated their prognostic value, based on the TCGA data from June 2015. No study has explored the diagnostic value of DEMs in ESCA based upon the TCGA data. Therefore, it is possible and urgent to identify sensitive and specific biomarkers to identify potential pathogenic mechanisms and improve the accuracy of early diagnosis of ESCA based on TCGA data.
This study screened for the presence of DEMs and differentially expressed genes (DEGs) in ESCA. We also performed a receiver operating characteristic (ROC) analysis to investigate the diagnostic value of DEMs in ESCA and validated the top five DEMs based on data from Gene Expression Omnibus (GEO). The overlapping genes, which were largely representative of the potential target genes of the DEMs, were assessed using protein-protein interaction (PPI) analysis, Gene Ontology (GO) and Kyoto Encyclopedia of Genes and Genomes (KEGG) pathway analysis. The regulatory networks of miRNA-transcription factor (TF) and miRNA-gene were successfully established. Our study could provide a meaningful contribution to exploring the mechanisms of esophageal carcinoma pathogenesis and defining new biomarkers for early diagnosis and treatment.
RESULTS
DEMs and DEGs in ESCA based on TCGA data
Altogether, 136 miRNAs were considered as DEMs in ESCA based upon a p-value < 0.05, FDR < 0.05 and |log2FoldChange| > 1 using the edgeR package in Bioconductor, including 79 up-regulated and 57 down-regulated miRNAs (Supplementary Table 1, Figures 1 and 2). In total, 3541 genes were identified as DEGs in ESCA according to similar criteria except for |log2FoldChange| > 1.5, including 1688 up-regulated and 1853 down-regulated genes (Figures 1 and 3).
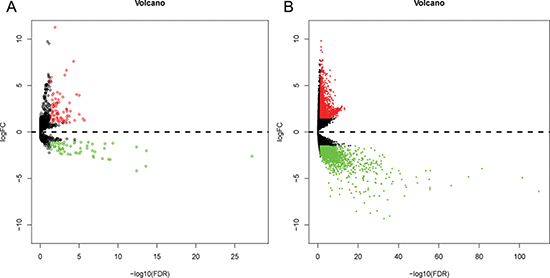
Figure 1: Volcano plot of differentially expressed miRNAs (DEMs) and differentially expressed genes (DEGs) in esophageal carcinoma (ESCA) and normal esophageal samples. (A) Volcano plot of differentially expressed miRNAs (DEMs). Volcano plot was generated using the gplots package in Bioconductor. DEMs with log2FoldChange (log2FC) > 1 were labeled in red; DEMs with log2FoldChange (log2FC) < -1 were in green (P < 0.05). (B) Volcano plot of differentially expressed genes (DEGs). DEGs with log2FoldChange (log2FC) > 1.5 were shown in red; DEGs with log2FoldChange (log2FC) < -1.5 were in green (P < 0.05).
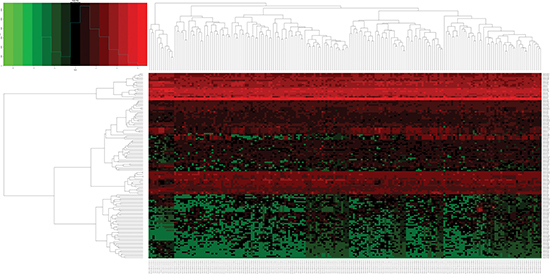
Figure 2: Heatmap of differentially expressed miRNAs (DEMs) in esophageal carcinoma (ESCA) and normal esophageal samples. Heatmap was generated using the gplots package in Bioconductor. DEMs with log2FoldChange (log2FC) > 1 were labeled in red; DEMs with log2FoldChange (log2FC) < -1 were in green (P < 0.05).
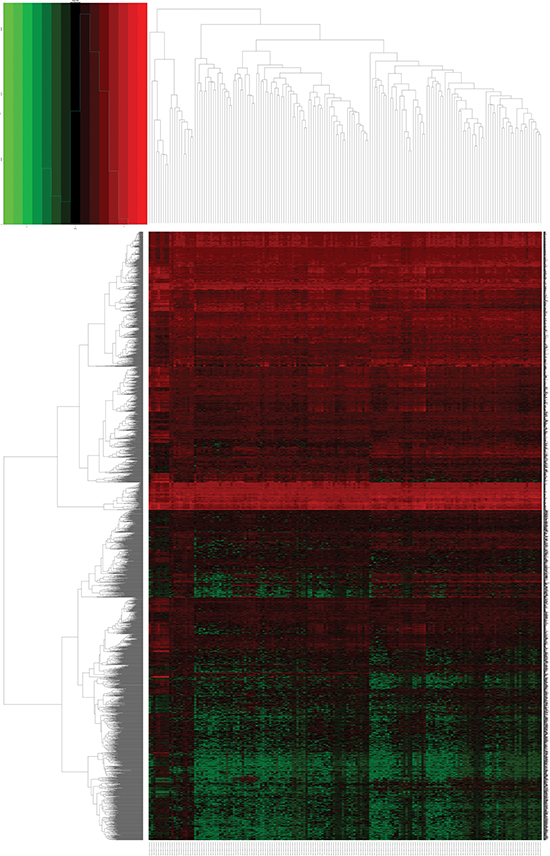
Figure 3: Heatmap of differentially expressed genes (DEGs) in esophageal carcinoma (ESCA) and normal esophageal samples. Heatmap was drawn using the gplots package in Bioconductor. DEGs with log2FoldChange (log2FC) > 1.5 were shown in red; DEMs with log2FoldChange (log2FC) < -1.5 were in green (P < 0.05).
The diagnostic value of DEMs
The ROC analysis of the DEMs was performed (Supplementary Table 1). The top five areas under the ROC curves (AUCs) for DEMs were 0.953 (miR-93), 0.928 (miR-21), 0.915 (miR-4746), 0.906 (miR-196a-1) and 0.906 (miR-196a-2) (Table 1, Figure 4). We also combined these five DEMs to evaluate the potential diagnostic value for ESCA, and the pooled AUC reached 0.985, which provided a higher diagnostic efficiency compared to individual DEMs. We next examined the expression level of the five DEMs in non-cancerous esophageal and ESCA tissues using GraphPad Prism (version 6.01, Figure 5). The top five DEMs, including five up-regulated miRNAs (miR-93, miR-21, miR-4746, miR-196a-1 and miR-196a-2), were selected for further analysis.
Table 1: The top five differentially expressed miRNAs (DEMs) in esophageal carcinoma (ESCA)
miRNA ID |
LogFC* |
p-value |
FDR** |
AUC*** |
|---|---|---|---|---|
miR-93 |
1.394654953 |
4.44E-08 |
3.18E-06 |
0.953 |
miR-21 |
1.246193842 |
2.81E-08 |
2.12E-06 |
0.928 |
miR-4746 |
1.896011225 |
1.72E-07 |
9.94E-06 |
0.915 |
miR-196a-1 |
1.993005619 |
0.000557766 |
0.007777738 |
0.906 |
miR-196a-2 |
1.943227278 |
0.000604741 |
0.008131613 |
0.906 |
*FC: fold change **FDR: fault detection rate ***AUC: area under the ROC curve
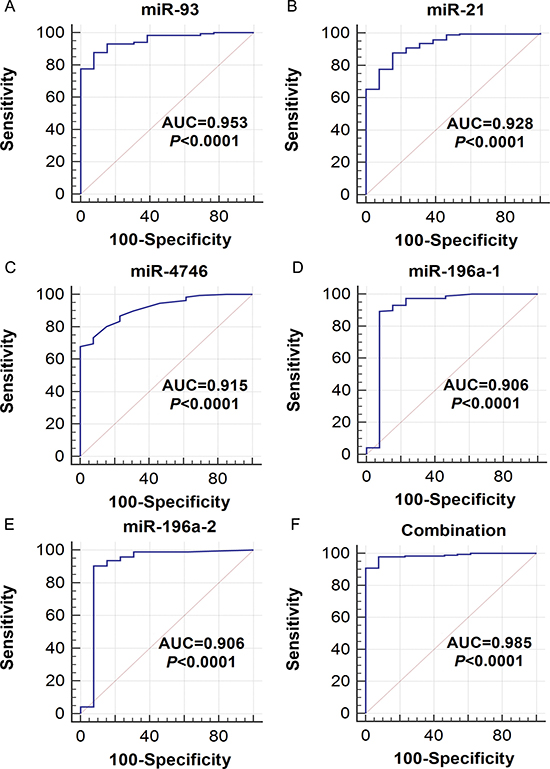
Figure 4: The receiver operating characteristic (ROC) curves of the top five differentially expressed miRNAs (DEMs) in esophageal carcinoma (ESCA). ROC curves were drawn using MedCalc software. AUC: area under the ROC curve. (A) miR-93, (B) miR-21, (C) miR-4746, (D) miR-196a-1, (E) miR-196a-2, (F) Combination of the five DEMs.
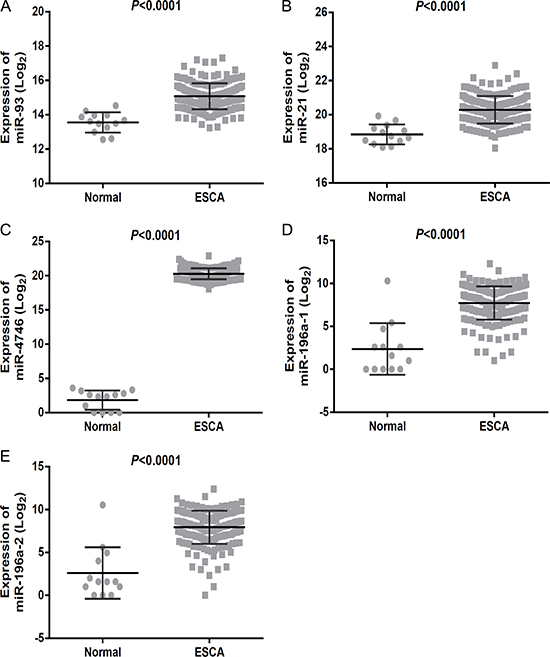
Figure 5: Expression of the top five differentially expressed miRNAs (DEMs) in esophageal carcinoma (ESCA). The scatter diagrams showed the expression level of DEMs in the 187 cases of ESCA and 13 normal esophageal samples. The scatter diagrams were drawn using the GraphPad Prism software. (A) miR-93, (B) miR-21, (C) miR-4746, (D) miR-196a-1, (E) miR-196a-2.
Validation of the top five DEMs
A total of 11 miRNA microarray datasets were included in the present study. The areas under summary receiver operating characteristic (sROC) curves were 0.868 (miR-21), 0.891 (miR-93) and 0.884 (miR-196a). Since data from only two microarrays were available for miR-4746, we could perform the meta-analysis. The original AUCs of miR-4746 were 0.849 (GSE43732) and 0.687 (GSE61047), respectively (Figure 6). Our results suggested that the expression levels of miR-21, miR-93, miR-196a and miR-4746 were remarkably higher in ESCA specimens than those in normal controls (miR-21: standardized mean difference (SMD) = 1.51, 95% CI: 0.6~2.4; P = 0.001; miR-93: SMD = 0.83, 95% CI: 0.1~1.56; P = 0.025; miR-196a: SMD = 1.53, 95% CI:1.27~1.79; P < 0.0001; miR-4746: SMD = 1.35, 95% CI: 1.07~1.63; P < 0.0001), which were consistent with our previous results on the basis of TCGA (Table 3, Figure 7).
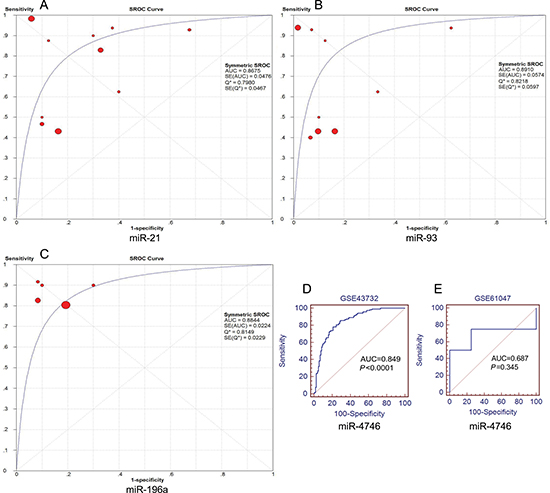
Figure 6: Summary receiver operating characteristic (SROC) plots of miR-21, miR-93 and miR-196a and the receiver operating characteristic (ROC) curves of miR-4746. SROC curves were drawn using Meta-DISc software. ROC curves were drawn using MedCalc software. (A) miR-21, (B) miR-93, (C) miR-196a, (D) miR-4746 (GSE43732), (E) miR-4746 (GSE61047).
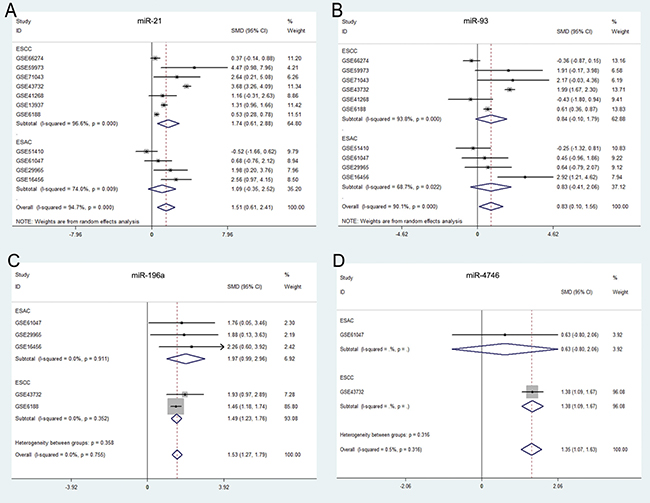
Figure 7: Forest plots of the top five differentially expressed miRNAs (DEMs ) in esophageal carcinoma (ESCA). Forest plots were drawn using STATA software (version 12.0). (A) miR-21, (B) miR-93, (C) miR-196a, (D) miR-4746.
Overlapping genes from DEGs and predicted targets
Different numbers of predicted target genes were obtained for each DEM (Figure 8), and the total number of the target genes was 6115. The intersections between the target genes of the four up-regulated miRNAs (miR-93, miR-21, miR-4746 and miR-196a) and 1853 down-regulated DEGs are shown in Figure 8A–8D and Supplementary Table 2. We also examined the combination of all overlapping genes and 349 genes were identified.
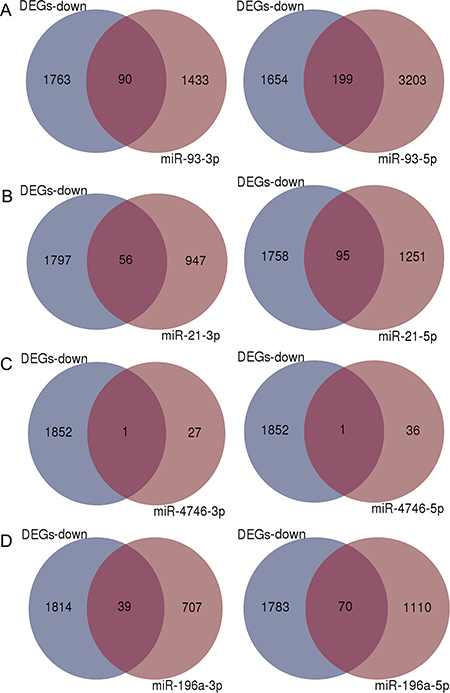
Figure 8: Venn diagrams of overlapping genes from differentially expressed genes (DEGs) and predicted target genes. Blue: Down-regulated DEGs, Light purple: predicted target genes of each miRNA, Dark purple: overlapping genes. (A) miR-93, (B) miR-21, (C) miR-4746, (D) miR-196a.
PPI network construction
PPI network was constructed with nodes representing the proteins and edges depicting associated interactions. PPI network was established with 349 overlapping genes containing 349 nodes and 213 edges (Figure 9).
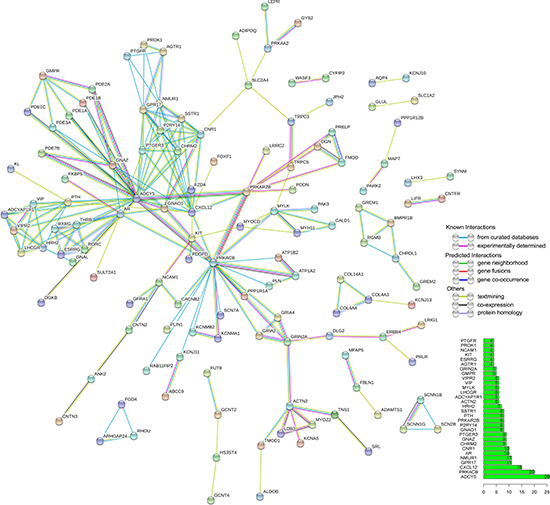
Figure 9: Protein-protein interaction (PPI) network of overlapping genes. PPI network was drawn using STRING online tool. The minimum required interaction score was 0.7 (high confidence). Disconnected nodes were hidden in the network. The bar graph showed the number of connected nodes for the top 30 genes.
Validation of the top five DEMs target genes
PPI network was performed to the overlapping genes of each DEM (miR-93, miR-21, miR-196a-1 and miR-196a-2). The correlation between the top five hub genes and each DEM was negative and the top three were shown in Figure 10. The negative correlations between protein kinase cAMP-activated catalytic subunit beta (PRKACB), protein phosphatase 1 regulatory subunit 12B (PPP1R12B) and miR4746 were evidently presented in Figure 10 too.
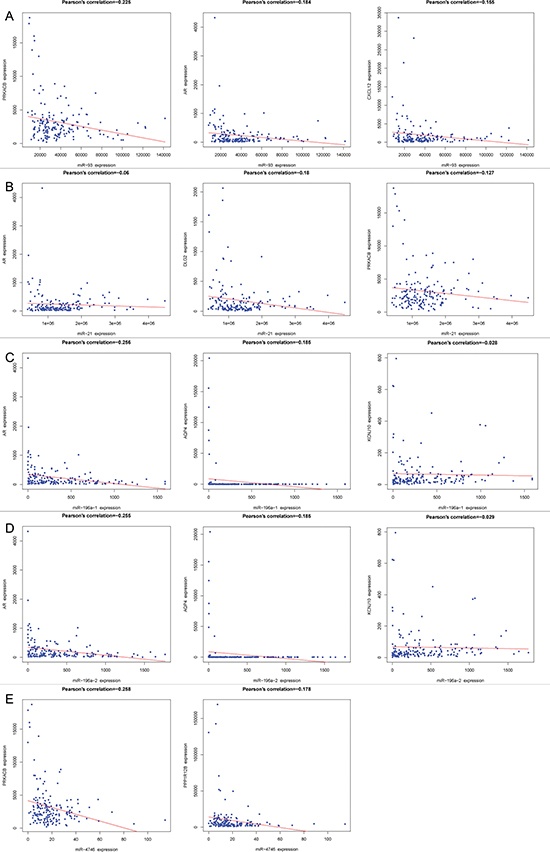
Figure 10: The correlation between the top three hub genes and each differentially expressed miRNA (DEM). Pearson’s correlation plots were drawn using R language. (A) miR-93 (PRKACB, AR and CXCL12), (B) miR-21(AR, DLG2 and PRKACB), (C) miR-196a-1 (AR, AQP4 and KCNJ10), (D) miR-196a-2 (AR, AQP4 and KCNJ10), (E) miR-4746 (PRKACB and PPP1R12B).
GO and KEGG pathways of overlapping genes
To gain insight into the biological roles of the 349 overlapping genes encoding the four DEMs in ESCA, we performed GO annotation and KEGG pathway analyses. The results of GO annotation suggested that the main functions of these overlapping genes were related to the plasma membrane, while the results of KEGG analysis indicated that the overlapping genes were mainly correlated with the calcium signaling pathway and the neuroactive ligand-receptor interaction (Figure 11).
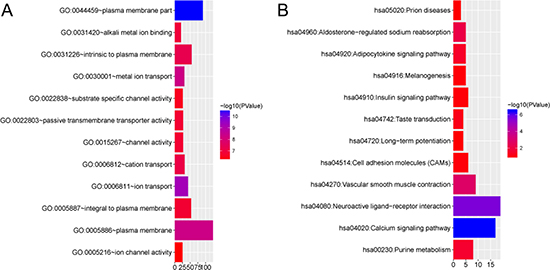
Figure 11: Gene Ontology (GO) annotation and Kyoto Encyclopedia of Genes and Genomes (KEGG) pathways of overlapping genes. GO Annotation and KEGG Pathways were generated using the ggplot2 package in R language. The horizontal axis represented the number of genes. Column color represented the -log10(P-Value). Blue: high degree of enrichment, red: low degree of enrichment. (A) GO annotation of overlapping genes, (B) KEGG pathways of overlapping genes.
The regulatory networks of miRNA-transcription factor (TF) and miRNA-gene
We predicted the target TFs of the four DEMs using CircuitsDB and TransmiR. The 38 pairs of the miRNA-TF network were constructed with the DEMs and 37 TFs (Table 2). The miRNA-TF and miRNA-gene regulatory networks were established with the 38 miRNA-TF pairs (Figure 12) and 560 miRNA-gene pairs (Figure 13) using Cytoscape software.
Table 2: Relevant transcription factors (TFs) regulated by eight differentially expressed miRNAs (DEMs)
miRNA ID |
TransmiR |
CircuitsDB |
|---|---|---|
miR-93 |
E2F1,MYC |
NF-Y, TEF-1, EGR, SRF |
miR-21 |
SMAD3, IL1B, TGFB1, AP-1,BMP6, ERS1, Gfi1, NFIB, PTEN, REST, STAT3, |
TEF-1 |
miR-4746 |
/ |
/ |
miR-196a-1 |
/ |
MYB, HSF2, GATA, STAT5A, ER, T3R,RORALPHA2 |
miR-196a-2 |
HMGA1 |
/ |
Table 3: The standard mean deviation (SMD) of the top five differentially expressed miRNAs (DEMs) in ESCA
Group |
Cancer type |
Number of patients |
SMD* |
SMD (95%CI) |
P value |
Heterogeneity |
||
|---|---|---|---|---|---|---|---|---|
Lower |
Upper |
I²(%) |
P value |
|||||
miR-21 |
Overall |
11 |
1.51 |
0.61 |
2.40 |
0.001 |
94.7 |
< 0.0001 |
ESCC** |
7 |
1.74 |
0.61 |
2.88 |
0.003 |
96.6 |
< 0.0001 |
|
ESCA*** |
4 |
1.09 |
−0.35 |
2.52 |
0.138 |
74 |
0.009 |
|
miR-93 |
Overall |
10 |
0.83 |
0.10 |
1.56 |
0.025 |
90.1 |
< 0.0001 |
ESCC |
6 |
0.84 |
−0.10 |
1.79 |
0.08 |
93.8 |
< 0.0001 |
|
ESCA |
4 |
0.83 |
−0.41 |
2.06 |
0.189 |
68.7 |
0.022 |
|
miR-196a |
Overall |
5 |
1.53 |
1.27 |
1.79 |
< 0.0001 |
0 |
0.755 |
ESCC |
2 |
1.49 |
1.23 |
1.76 |
< 0.0001 |
0 |
0.352 |
|
ESCA |
3 |
1.97 |
0.99 |
2.96 |
< 0.0001 |
0 |
0.911 |
|
miR-4746 |
Overall |
2 |
1.35 |
1.07 |
1.63 |
< 0.0001 |
0.5 |
0.316 |
ESCC |
1 |
1.49 |
1.23 |
1.76 |
< 0.0001 |
/ |
/ |
|
ESCA |
1 |
0.63 |
−0.80 |
2.06 |
0.389 |
/ |
/ |
|
*SMD: standard mean deviation **ESCC: esophageal squamous cell carcinoma ***ESCA: esophageal carcinoma
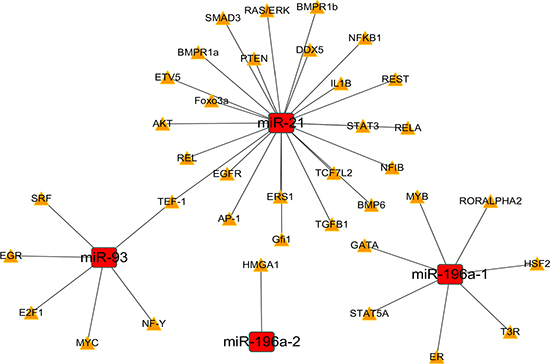
Figure 12: The regulatory network of miRNA-(transcription factor) TF. The regulatory network of miRNA-TF in esophageal carcinoma (ESCA) was drawn with Cytoscape software. The red rectangles and yellow triangles represented the miRNAs and TFs, respectively. The solid lines denoted the regulatory links among these factors.
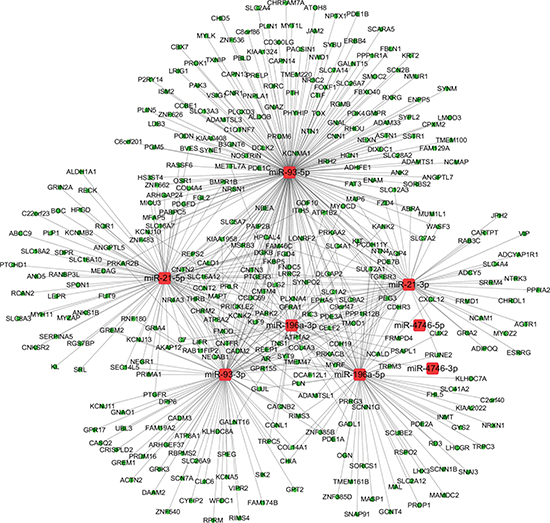
Figure 13: The regulatory network of miRNA-gene in esophageal carcinoma (ESCA). The regulatory network of miRNA-gene was analyzed using Cytoscape software. The round rectangles and ellipses represented the miRNAs and genes, respectively. The red and green colors represented the relatively high and low expression, respectively.
DISCUSSION
It is well-known that TCGA, which has profiled a large number of malignancies at the DNA, RNA and protein levels, provides an excellent tool for cancer research. Considering the miRNA profile in ESCA, Zhan et al. [7] utilized the TCGA data from July 2014. The cohort only consisted of 70 cases of ESCA with mRNA data and 72 cases with miRNA data. They identified 2962 DEGs and 45 DEMs in ESCA. Subsequently, they performed gene function and signaling pathway analyses using GO and KEGG methods. They also established the TF-miRNA-gene network and observed that core promoter-binding protein (CPBP), nuclear factor of activated T-cells (NFAT-1), and miR-30c-5p, were located in the central hub of the network. However, Zhan et al. [7] did not explore the clinical significance of the DEMs, their prognostic value or their diagnostic values. Additionally, Zhao et al. [8]also screened for the presence of DEMs in ESCA based on the TCGA data from June 2015, consisting of 187 ESCA and 13 normal esophageal samples, which included 1046 miRNA expression values. They investigated the prognostic value of DEMs but not their diagnostic value. Thus, no study has explored the diagnostic value of DEMs in ESCA from TCGA data. Compared with previous studies by Zhan et al. [7] and Zhao et al. [8], the latest update of TCGA data with high throughput analysis of miRNAs was retrieved and assessed in the current study. Herein, 187 cases of ESCA and 13 cases of normal esophageal tissues with 1881 miRNAs detected with miRNA-seq were analyzed in the current study, which increased the reliability of our results. More importantly, we highlighted the diagnostic values of several core DEMs for ESCA, including miR-93, miR-21, miR-4746, miR-196a-1 and miR-196a-2.
Early diagnosis plays a critical role in the prevention and treatment of cancer, including ESCA. Using an ROC analysis, we found that the aforementioned five DEMs could be considered biomarkers for the diagnosis of ESCA. Importantly, the diagnostic values of these DEMs could be validated based on independent microarray data from GEO, as shown by rROC and SMD. More interestingly, combining these five miRNAs resulted in an extremely high diagnostic value with the AUC of 0.985. This miRNA-pool offers a great potential for the clinical detection and early screening of ESCA. In addition, we also attempted to assess the prognostic value of the top five DEMs in ESCA. Kaplan-Meier survival analysis was performed to estimate the prognostic values of the top five DEMs. Unfortunately, the top five DEMs did not gain any significant prognostic significance (Supplementary Figure 1).
Among these five DEMs, the one with the highest AUC was miR-93, which has been reported to be frequently dysregulated in various cancers, including gastric [9], liver [10], colorectal [11], breast [12], ovarian [13], cervical [14], prostate [15], bladder cancer [16] and bone sarcoma [17]. MiR-93 acts as a tumor promoter and may also be used as a potential biomarker for esophageal squamous cell carcinoma (ESCC) [18, 19], which was in complete agreement with the current finding based on TCGA data.
In addition, miR-21 has also been well studied in cancers, and several meta-analyses have reported its clinical value [20–29]. The up-regulation of miR-21 can predict an unfavorable prognosis in ESCA, as confirmed by three independent meta-analyses [30–32]. Several studies also found that the up-regulation of miRNA-21 could serve as a potential diagnostic biomarker [33–36], which is consistent with our result using TCGA data.
MiR-4746 was discovered by Persson et al. [37] using the first extensive next-generation sequencing analysis of miRNA expression in breast cancer. However, the clinical role of miR-4746 in cancers remains largely unknown. Hence, as a new member of the miRNA family, miR-4746 needs to be further studied, especially in terms of its clinical value in cancers, including ESCA. In our study, we identified two prospective target genes of PRKACB and PPP1R12B for miR-4746. PRKACB has been found to be a critical effector of the cAMP/PKA-related signal pathway and thus participate in several cell processes such as cell proliferation, differentiation, apoptosis, metabolism and gene transcription. Chen et al. [38] detected the expression of PRKACB in non-small lung cancer and adjacent non-cancer tissues using qRT-PCR, and found that PRKACB was down-regulated in cancerous tissues. The authors also demonstrated that PRKACB was a tumor suppressor gene through promoting tumor cells apoptosis and inhibiting tumor cells proliferation and invasion. Sigloch et al. [39] discovered that PRKACB was a direct target of miR-200c, and the down-regulated PRKACB could suppress the breast cancer cell migration. Zhou et al. [40] proposed that PPP1R12B was down-expressed in colorectal cancer tissues and might be a tumor suppressive gene. However, the molecular mechanisms of PRKACB and PPP1R12B in ESCA were still unknown, and the correlation between miR-4746 and PRKACB as well as PPP1R12B has either not been validated so far. In our investigation, miR-4746 was up-regulated, while PRKACB and PPP1R12B were down-regulated in ESCA and clear inverse correlations between miR-4746 and PRKACB, PPP1R12B could be noted (Figure 10E). We hypothesized that the overexpression of miR-4746 could repress the expression of PRKACB and PPP1R12B and further promote the occurrence and development of ESCA. Further and stricter experiments are warranted to confirm our speculation.
MiR-196 as a cell death-related microRNA was involved in the processes of apoptosis and autophagy [41]. MiR-196a binding-site SNP was reported to regulate RAP1A expression, which contributed to ESCA risk and metastasis [42]. A functional variation in pre-microRNA-196a has been correlated with the susceptibility of Chinese Han to ESCA risk [43]. MiR-196a has also been related to the development of Barrett’s esophagus to esophageal adenocarcinoma [44, 45]. However, its expression level and clinical significance have not been reported in ESCA, which remains to be further investigated.
The circulating level of miRNAs has great clinical significance as non-invasive biomarkers for the early detection of ESCA. Some studies showed plasma/serum miR-21 was upregulated in ESCA patients than controls by using RT-PCR, and the area under the curve (AUC) were 0.812 [36], 0.690 [46] and 0.618 [47]. Moreover, upregulated miR-21 was detected in saliva supernatants with the AUC of 0.698 [48] and exosomes [49]. Not only miR-21, but also miR-23a [50], miR-506 [51], miR-718 [52] and miR-216a/b [53] were found as circulating biomarkers for diagnosis of ESCC. A meta-analysis [54] including 27 studies reported that circulating miRNAs with a combined AUC of 0.87 could be used as a biomarkers for early diagnosis of ESCC. MiRNAs presented in blood or other tissue fluid in a stable form [55]. Therefore, circulating miRNAs can be candidates for noninvasive diagnosis of ESCA. However, the circulating level of miR-93, miR-4746, miR-196a-1 and miR-196a-2 remains un-reported and needs to be detected in the future.
To further explore the possible molecular mechanisms of the five DEMs in the progression of ESCA, we performed PPI analysis, GO and KEGG pathway analysis of the overlapping genes. The top 10 hub genes (ADCY5, PRKACB, CXCL12, GPR17, NMUR1, AR, CNR1, CHRM2, GNAZ and PTGER3) were identified from the PPI network. Among these hub genes, CXCL12 expression has been shown to stimulate ESCC proliferation and associated with poor prognosis [56]. CXCL12 was also highly associated with ESCC development based upon graph-clustering and GO-term analysis [57]. Sato et al. reported that DNA methylation of ADCY5 was correlated with recurrence of lung adenocarcinoma [58]. Harten et al. found that Neuromedin U (NMU) combined with NMUR1 to stimulate migration of renal cancer cells [59]. Furthermore, we discovered that these overlapping genes were mainly involved in the plasma membrane, calcium signaling pathway and neuroactive ligand-receptor interaction, which gave us a direction to explore the molecular mechanisms of these DEMs in the tumorigenesis and deterioration of ESCA. To preliminarily validate the potential targets of the DEMs, we observed inverse relationships between DEMs and some of the hub genes, however, the exact validation needs to be performed with experiments in vitro in the future.
The development of ESCA is a complex biological process. We summarized the target TFs and constructed the regulatory network of miRNA-TF. TGF-β1 and EGFR, known TFs, may play significant roles in the progression of ESCA. TGF-β1 promotes the invasion and migration of sphere-forming stem-like cells in esophageal cancer [60]. TGF-β1 also induced the epithelial to mesenchymal transition (EMT) via the regulation of PTEN/PI3K signaling pathway in ESCC [61]. EGFR/AKT signaling pathway may play a crucial part in promoting ESCC development [62]. In addition, the expression of EGFR has been related to the prognosis of esophageal cancer [63–65]. Thus, DEMs may influence the TFs and then regulate the tumor development in ESCA. However, the function of miRNA-TF also requires further verification with in vitro and in vivo experiments.
MATERIALS AND METHODS
DEMs and DEGs of ESCA from TCGA data
The ESCA miRNA-Seq and RNA-Seq data were downloaded from the TCGA database using The GDC Data Portal (https://gdc-portal.nci.nih.gov/). The number of miRNA and mRNA expression values were 1881 and 60483. The miRNA expression data included a total of 200 samples consisting of 187 ESCA (90 esophageal adenocarcinoma (EAC) and 97 ESCC) and 13 normal esophageal samples. The mRNA expression data included a total of 173 samples consisting of 162 ESCA (80 EAC and 82 ESCC) and 11 normal esophageal samples. The sequencing data were all publicly available; therefore, no ethical issues were involved. The edgeR package in Bioconductor was used to screen the DEMs and DEGs in ESCA and normal esophageal tissue samples. The edgeR package is based on the negative binomial (NB) distribution, which can correct the overdispersion problem in RNA-seq data by using a Poisson model and a Bayes procedure [66, 67]. The data with expression values of zero were removed. The miRNAs and genes were deemed to be DEMs and DEGs if |log2FoldChange| > 1 [68] and |log2FoldChange| >1.5 [69], respectively, both with p-value < 0.05 and false discovery rate (FDR) < 0.05. Analysis of the diagnostic role of DEMs
We evaluated the differential expression level of DEMs using the scatter diagram software by GraphPad Prism (version 6.01) and employed t-test for statistical comparison. The ROC analysis of the DEMs was performed using MedCalc software [70]. The top five DEMs with the highest diagnostic performances were selected for further analysis. The sROC curves for the top five DEMs were generated using Meta-DISc software [71]. The AUC was calculated for the individual DEMs and their combination.
Validation of the top five DEMs based on GEO miRNA microarray datasets
The ESCA miRNA microarray datasets were collected from GEO (http://www.ncbi.nlm.nih.gov/geo/) on the basis of the search terms: (esophageal OR esophagus OR esophag* OR ESCC OR ESCA OR EC OR EA) AND (cancer OR carcinoma OR tumo* OR neoplas* OR malignan* OR adenocarcinoma) AND (miR OR miRNA OR microRNA OR “non coding RNA” OR “non-coding RNA”). The search date was up to February 15, 2017.
We selected available datasets in accordance with the following inclusion criteria: (1) the samples in each datasets must be from human beings; (2) the patients must be diagnosed as esophageal carcinoma pathologically; (3) the records must provide miRNA expression data for both cancerous and non-cancerous specimens; (4) both the cancer and non-cancer groups must include at least three samples, respectively [72].
Two reviewers (Jiang-hui Zeng and Dan-dan Xiong) independently extracted detailed information from included datasets, with any divergence was confirmed by conversation with a third and fourth researchers (Gang Chen and Dian-zhong Luo). The following characteristics were collected: data source, platform, first author, publication years, region, cancer type, sample source, number of patients for both cancer and normal groups and expression values of the top five DEMs.
The mean and standard deviation of the top five DEMs expression values in cancer and non-cancer groups were calculated using SPSS 20.0 (IBM, New York, USA). The pooled standard mean deviation (SMD) and its corresponding 95% confidence interval (95% CI) were further evaluated using STATA, version 12.0 (StataCorp, College Station, TX, USA). The SMD > 0 demonstrated that the DEMs were highly expressed in cancer samples. The P < 0.05 (two-sided) was considered statistically significant.
Collection of potential target genes for DEMs
We predicted the potential target genes of the top five DEMs using miRWalk 2.0 [73], which included 12 databases (miRWalk [74], Microt4 [75], miRanda [76], mirbridge [77], miRDB [78], miRMap [79], miRNAMap [80], Pictar2 [81], PITA [82], RNA22 [83], RNAhybrid [84] and TargetScan [85]). The genes predicted by six or more databases were regarded as potential target genes for each DEM. We also combined all predicted genes together as a group, which could reflect the known potential targets in ESCA in general. Then, the intersection between the above predicted genes and the DEGs of TCGA was determined using Venn diagram online tool. For those four up-regulated DEMs (miR-93, miR-21, miR-4746, miR-196a), we selected the down-regulated DEGs for the intersection due to the negative relationship between the miRNA and its target gene based upon sequence complementation.
PPI network construction
PPI network of the overlapping DEGs was established using the Search Tool for the Retrieval of Interacting Genes (STRING) database (http://www.string-db.org/). The interactions procured included known interactions and predicted interactions.
Validation of the top five DEMs target genes based on TCGA datasets
PPI network was performed to the overlapping genes of each DEM (miR-93, miR-21, miR-196a-1 and miR-196a-2). Pearson’s correlation between the top five hub genes and each DEM was performed by R language.
Functional annotation
The Database for Annotation Visualization and Integrated Discovery (DAVID) online tool (https://david.ncifcrf.gov/) was used to conduct the functional and pathway enrichment analyses in our study. We performed GO and KEGG pathway enrichment analyses to detect the potential biological functions and pathways of the overlapping genes of the four DEMs in ESCA.
Identification of miRNA-transcription factors (TFs)
CircuitsDB is a web-server established to search human and mouse mixed miRNA/TF Feed-Forward regulatory circuits [86]. The transcription factor-miRNA regulation database (TransmiR) provides a valuable resource for the study of TF-miRNA regulation [87]. We thus obtained miRNA-TF regulatory relations using CircuitsDB and TransmiR.
Networks of miRNA-TF and miRNA-gene
Based on the miRNA-TF pairs and miRNA-gene pairs, we constructed the regulatory networks of miRNA-TF and miRNA-gene in ESCA, which we visualized using Cytoscape (v3.4.0) software.
CONCLUSIONS
In the current study, we screened for the presence of DEMs and DEGs in normal esophageal and ESCA samples in the genome-wide miRNA expression profiles from TCGA and GEO. We selected the top five miRNAs with the highest AUC value to construct the networks of miRNA-TF and miRNA-Gene. Our study may provide a meaningful contribution to exploring the role of novel DEMs in ESCA pathogenesis and improving the early diagnosis of ESCA.
CONFLICTS OF INTEREST
None.
REFERENCES
1. Siegel RL, Miller KD, Jemal A. Cancer statistics, 2016. CA Cancer J Clin. 2016; 66:7–30.
2. Ferlay J, Soerjomataram I, Dikshit R, Eser S, Mathers C, Rebelo M, Parkin DM, Forman D, Bray F. Cancer incidence and mortality worldwide: sources, methods and major patterns in GLOBOCAN 2012. Int J Cancer. 2015; 136:E359–386.
3. Jemal A, Bray F, Center MM, Ferlay J, Ward E, Forman D. Global cancer statistics. CA Cancer J Clin. 2011; 61:69–90.
4. Sakai NS, Samia-Aly E, Barbera M, Fitzgerald RC. A review of the current understanding and clinical utility of miRNAs in esophageal cancer. Semin Cancer Biol. 2013; 23:512–521.
5. Ma G, Jing C, Huang F, Li X, Cao X, Liu Z. Integrin alpha6 promotes esophageal cancer metastasis and is targeted by miR-92b. Oncotarget. 2017; 8:6681–6690. doi: 10.18632/oncotarget.14259.
6. Ma G, Jing C, Li L, Huang F, Ding F, Wang B, Lin D, Luo A, Liu Z. MicroRNA-92b represses invasion-metastasis cascade of esophageal squamous cell carcinoma. Oncotarget. 2016; 7:20209–20222. doi: 10.18632/oncotarget.7747.
7. Zhan C, Yan L, Wang L, Jiang W, Zhang Y, Xi J, Jin Y, Chen L, Shi Y, Lin Z, Wang Q. Landscape of expression profiles in esophageal carcinoma by The Cancer Genome Atlas data. Dis Esophagus. 2016; 29:920–928.
8. Zhao JY, Wang F, Li Y, Zhang XB, Yang L, Wang W, Xu H, Liu DZ, Zhang LY. Five miRNAs Considered as Molecular Targets for Predicting Esophageal Cancer. Med Sci Monit. 2015; 21:3222–3230.
9. Arabpour M, Mohammadparast S, Maftouh M, ShahidSales S, Moieni S, Akbarzade H, Mirhafez SR, Parizadeh SM, Hassanian SM, Avan A. Circulating microRNAs as potential diagnostic biomarkers and therapeutic targets in gastric cancer: current status and future perspectives. Curr Med Chem. 2016; 23:4135–4150.
10. Yang J, Han S, Huang W, Chen T, Liu Y, Pan S, Li S. A meta-analysis of microRNA expression in liver cancer. PLoS One. 2014; 9:e114533.
11. Yang IP, Tsai HL, Miao ZF, Huang CW, Kuo CH, Wu JY, Wang WM, Juo SH, Wang JY. Development of a deregulating microRNA panel for the detection of early relapse in postoperative colorectal cancer patients. J Transl Med. 2016; 14:108.
12. Jayavelu ND, Bar N. Reconstruction of temporal activity of microRNAs from gene expression data in breast cancer cell line. BMC Genomics. 2015; 16:1077.
13. Srivastava AK, Wang QE. Targeting translesion synthesis to facilitate the eradication of ovarian cancer stem cells by platinum-based therapy. Mol Cell Oncol. 2016; 3:e1043482.
14. Zhang J, Wang F, Xu J, Wang X, Ye F, Xie X. Micro ribonucleic acid-93 promotes oncogenesis of cervical cancer by targeting RAB11 family interacting protein 1. J Obstet Gynaecol Res. 2016; 42:1168–1179.
15. Sun Y, Jia X, Hou L, Liu X. Screening of Differently Expressed miRNA and mRNA in Prostate Cancer by Integrated Analysis of Transcription Data. Urology. 2016; 94:313 e311–316.
16. Liu J, Wang H, Wang Y, Li Z, Pan Y, Liu Q, Yang M, Wang J. Repression of the miR-93-enhanced sensitivity of bladder carcinoma to chemotherapy involves the regulation of LASS2. Onco Targets Ther. 2016; 9:1813–1822.
17. Xiao WF, Li YS, Lou W, Cai T, Zhang S, Hu XY, Zhang XW, Luo W. MicroRNA-93-5p may participate in the formation of morphine tolerance in bone cancer pain mouse model by targeting Smad5. Oncotarget. 2016; 7:52104–52114. doi: 10.18632/oncotarget.10524.
18. Ansari MH, Irani S, Edalat H, Amin R, Mohammadi Roushandeh A. Deregulation of miR-93 and miR-143 in human esophageal cancer. Tumour Biol. 2016; 37:3097–3103.
19. Li C, Ding C, Chen T, Chen J, Xu Z, Lei Z, Xu C, Zhao J. Micro ribonucleic acid-93 promotes proliferation and migration of esophageal squamous cell carcinoma by targeting disabled 2. Thorac Cancer. 2015; 6:524–533.
20. Gao Y, Dai M, Liu H, He W, Lin S, Yuan T, Chen H, Dai S. Diagnostic value of circulating miR-21: An update meta-analysis in various cancers and validation in endometrial cancer. Oncotarget. 2016; 7:68894–68908. doi: 10.18632/oncotarget.12028.
21. Chen Z, Liu H, Jin W, Ding Z, Zheng S, Yu Y. Tissue microRNA-21 expression predicted recurrence and poor survival in patients with colorectal cancer - a meta-analysis. Onco Targets Ther. 2016; 9:2615–2624.
22. Qu K, Lin T, Pang Q, Liu T, Wang Z, Tai M, Meng F, Zhang J, Wan Y, Mao P, Dong X, Liu C, Niu W, et al. Extracellular miRNA-21 as a novel biomarker in glioma: Evidence from meta-analysis, clinical validation and experimental investigations. Oncotarget. 2016; 7:33994–34010. doi: 10.18632/oncotarget.9188.
23. Yin C, Zhou X, Dang Y, Yan J, Zhang G. Potential Role of Circulating MiR-21 in the Diagnosis and Prognosis of Digestive System Cancer: A Systematic Review and Meta-Analysis. Medicine (Baltimore) 2015; 94: e2123.
24. Liao Q, Han P, Huang Y, Wu Z, Chen Q, Li S, Ye J, Wu X. Potential Role of Circulating microRNA-21 for Hepatocellular Carcinoma Diagnosis: A Meta-Analysis. PLoS One 2015; 10: e0130677.
25. Wang Y, Zhang Y, Pan C, Ma F, Zhang S. Prediction of poor prognosis in breast cancer patients based on microRNA-21 expression: a meta-analysis. PLoS One. 2015; 10:e0118647.
26. Wu K, Li L, Li S. Circulating microRNA-21 as a biomarker for the detection of various carcinomas: an updated meta-analysis based on 36 studies. Tumour Biol. 2015; 36:1973–1981.
27. Shen L, Wan Z, Ma Y, Wu L, Liu F, Zang H, Xin S. The clinical utility of microRNA-21 as novel biomarker for diagnosing human cancers. Tumour Biol. 2015; 36:1993–2005.
28. Wang W, Li J, Zhu W, Gao C, Jiang R, Li W, Hu Q, Zhang B. MicroRNA-21 and the clinical outcomes of various carcinomas: a systematic review and meta-analysis. BMC Cancer 2014; 14:819.
29. Pan F, Mao H, Deng L, Li G, Geng P. Prognostic and clinicopathological significance of microRNA-21 overexpression in breast cancer: a meta-analysis. Int J Clin Exp Pathol. 2014; 7:5622–5633.
30. Fu C, Dong W, Wang Z, Li H, Qin Q, Li B. The expression of miR-21 and miR-375 predict prognosis of esophageal cancer. Biochem Biophys Res Commun. 2014; 446:1197–1203.
31. Fu W, Pang L, Chen Y, Yang L, Zhu J, Wei Y. The microRNAs as prognostic biomarkers for survival in esophageal cancer: a meta-analysis. ScientificWorldJournal 2014; 2014: 523979.
32. Wen SW, Zhang YF, Li Y, Liu ZX, Lv HL, Li ZH, Xu YZ, Zhu YG, Tian ZQ. Association of miR-21 with esophageal cancer prognosis: a meta-analysis. Genet Mol Res. 2015; 14:6578–6582.
33. Wen SW, Zhang YF, Li Y, Liu ZX, Lv HL, Li ZH, Xu YZ, Zhu YG, Tian ZQ. Characterization and effects of miR-21 expression in esophageal cancer. Genet Mol Res. 2015; 14:8810–8818.
34. Hezova R, Kovarikova A, Srovnal J, Zemanova M, Harustiak T, Ehrmann J, Hajduch M, Svoboda M, Sachlova M, Slaby O. Diagnostic and prognostic potential of miR-21, miR-29c, miR-148 and miR-203 in adenocarcinoma and squamous cell carcinoma of esophagus. Diagn Pathol 2015; 10: 42.
35. Gu J, Wang Y, Wu X. MicroRNA in the pathogenesis and prognosis of esophageal cancer. Curr Pharm Des. 2013; 19:1292–1300.
36. Lv H, He Z, Wang H, Du T, Pang Z. Differential expression of miR-21 and miR-75 in esophageal carcinoma patients and its clinical implication. Am J Transl Res. 2016; 8:3288–3298.
37. Persson H, Kvist A, Rego N, Staaf J, Vallon-Christersson J, Luts L, Loman N, Jonsson G, Naya H, Hoglund M, Borg A, Rovira C. Identification of new microRNAs in paired normal and tumor breast tissue suggests a dual role for the ERBB2/Her2 gene. Cancer Res. 2011; 71:78–86.
38. Chen Y, Gao Y, Tian Y, Tian DL. PRKACB is downregulated in non-small cell lung cancer and exogenous PRKACB inhibits proliferation and invasion of LTEP-A2 cells. Oncol Lett. 2013; 5:1803–1808.
39. Sigloch FC, Burk UC, Biniossek ML, Brabletz T, Schilling O. miR-200c dampens cancer cell migration via regulation of protein kinase A subunits. Oncotarget. 2015; 6:23874–23889. doi: 10.18632/oncotarget.4381.
40. Zhou CZ, Qiu GQ, Wang XL, Fan JW, Tang HM, Sun YH, Wang Q, Huang F, Yan DW, Li DW, Peng ZH. Screening of tumor suppressor genes on 1q31.1-32.1 in Chinese patients with sporadic colorectal cancer. Chin Med J (Engl). 2008; 121:2479–2486.
41. Wu BL, Wang D, Bai WJ, Zhang F, Zhao X, Yi Y, Zhang T, Shen WJ, Li EM, Xu LY, Xu JZ. An integrative framework to identify cell death-related microRNAs in esophageal squamous cell carcinoma. Oncotarget. 2016; 7:56758–56766. doi: 10.18632/oncotarget.10779.
42. Wang K, Li J, Guo H, Xu X, Xiong G, Guan X, Liu B, Li J, Chen X, Yang K, Bai Y. MiR-196a binding-site SNP regulates RAP1A expression contributing to esophageal squamous cell carcinoma risk and metastasis. Carcinogenesis. 2012; 33:2147–2154.
43. Wang K, Guo H, Hu H, Xiong G, Guan X, Li J, Xu X, Yang K, Bai Y. A functional variation in pre-microRNA-196a is associated with susceptibility of esophageal squamous cell carcinoma risk in Chinese Han. Biomarkers. 2010; 15:614–618.
44. Slaby O, Srovnal J, Radova L, Gregar J, Juracek J, Luzna P, Svoboda M, Hajduch M, Ehrmann J. Dynamic changes in microRNA expression profiles reflect progression of Barrett’s esophagus to esophageal adenocarcinoma. Carcinogenesis. 2015; 36:521–527.
45. Luzna P, Gregar J, Uberall I, Radova L, Prochazka V, Ehrmann J, Jr. Changes of microRNAs-192, 196a and 203 correlate with Barrett’s esophagus diagnosis and its progression compared to normal healthy individuals. Diagn Pathol 2011; 6: 114.
46. Li BX, Yu Q, Shi ZL, Li P, Fu S. Circulating microRNAs in esophageal squamous cell carcinoma: association with locoregional staging and survival. Int J Clin Exp Med. 2015; 8:7241–7250.
47. Komatsu S, Ichikawa D, Takeshita H, Tsujiura M, Morimura R, Nagata H, Kosuga T, Iitaka D, Konishi H, Shiozaki A, Fujiwara H, Okamoto K, Otsuji E. Circulating microRNAs in plasma of patients with oesophageal squamous cell carcinoma. Br J Cancer. 2011; 105:104–111.
48. Xie Z, Chen G, Zhang X, Li D, Huang J, Yang C, Zhang P, Qin Y, Duan Y, Gong B, Li Z. Salivary microRNAs as promising biomarkers for detection of esophageal cancer. PLoS One. 2013; 8:e57502.
49. Brucher BL, Li Y, Schnabel P, Daumer M, Wallace TJ, Kube R, Zilberstein B, Steele S, Voskuil JL, Jamall IS. Genomics, microRNA, epigenetics, and proteomics for future diagnosis, treatment and monitoring response in upper GI cancers. Clin Transl Med. 2016; 5:13.
50. Komatsu S, Ichikawa D, Kawaguchi T, Takeshita H, Miyamae M, Ohashi T, Okajima W, Imamura T, Kiuchi J, Arita T, Konishi H, Shiozaki A, Fujiwara H, et al. Plasma microRNA profiles: identification of miR-23a as a novel biomarker for chemoresistance in esophageal squamous cell carcinoma. Oncotarget. 2016; 7:62034–62048. doi: 10.18632/oncotarget.11500.
51. Li SP, Su HX, Zhao D, Guan QL. Plasma miRNA-506 as a Prognostic Biomarker for Esophageal Squamous Cell Carcinoma. Med Sci Monit. 2016; 22:2195–2201.
52. Sun L, Dong S, Dong C, Sun K, Meng W, Lv P, Yin H, Ming L, He F. Predictive value of plasma miRNA-718 for esophageal squamous cell carcinoma. Cancer Biomark. 2016; 16:265–273.
53. Dong S, Yin H, Dong C, Sun K, Lv P, Meng W, Ming L, He F. Predictive Value of Plasma MicroRNA-216a/b in the Diagnosis of Esophageal Squamous Cell Carcinoma. Dis Markers 2016; 2016: 1857067.
54. Liu F, Tian T, Xia LL, Ding Y, Cormier RT, He Y. Circulating miRNAs as novel potential biomarkers for esophageal squamous cell carcinoma diagnosis: a meta-analysis update. Dis Esophagus. 2016. [Epub ahead of print].
55. Wan J, Wu W, Che Y, Kang N, Zhang R. Insights into the potential use of microRNAs as a novel class of biomarkers in esophageal cancer. Dis Esophagus. 2016; 29:412–420.
56. Uchi Y, Takeuchi H, Matsuda S, Saikawa Y, Kawakubo H, Wada N, Takahashi T, Nakamura R, Fukuda K, Omori T, Kitagawa Y. CXCL12 expression promotes esophageal squamous cell carcinoma proliferation and worsens the prognosis. BMC Cancer. 2016; 16:514.
57. Gao H, Wang L, Cui S, Wang M. Combination of meta-analysis and graph clustering to identify prognostic markers of ESCC. Genet Mol Biol. 2012; 35:530–537.
58. Sato T, Arai E, Kohno T, Tsuta K, Watanabe S, Soejima K, Betsuyaku T, Kanai Y. DNA methylation profiles at precancerous stages associated with recurrence of lung adenocarcinoma. PLoS One 2013; 8: e59444.
59. Harten SK, Esteban MA, Shukla D, Ashcroft M, Maxwell PH. Inactivation of the von Hippel-Lindau tumour suppressor gene induces Neuromedin U expression in renal cancer cells. Mol Cancer 2011; 10: 89.
60. Yue D, Zhang Z, Li J, Chen X, Ping Y, Liu S, Shi X, Li L, Wang L, Huang L, Zhang B, Sun Y, Zhang Y. Transforming growth factor-beta1 promotes the migration and invasion of sphere-forming stem-like cell subpopulations in esophageal cancer. Exp Cell Res. 2015; 336:141–149.
61. Zhang HY, Wang ZQ, Li YY, Wang F, Zeng QR, Gao Y, Xuan XY, Li SS. Transforming growth factor-beta1-induced epithelial-mesenchymal transition in human esophageal squamous cell carcinoma via the PTEN/PI3K signaling pathway. Oncol Rep. 2014; 32:2134–2142.
62. Ng HY, Ko JM, Yu VZ, Ip JC, Dai W, Cal S, Lung ML. DESC1, a novel tumor suppressor, sensitizes cells to apoptosis by downregulating the EGFR/AKT pathway in esophageal squamous cell carcinoma. Int J Cancer. 2016; 138:2940–2951.
63. Jia W, Wang W, Ji CS, Niu JY, Lv YJ, Zhou HC, Hu B. Coexpression of periostin and EGFR in patients with esophageal squamous cell carcinoma and their prognostic significance. Onco Targets Ther. 2016; 9:5133–5142.
64. Zhao C, Lin L, Liu J, Liu R, Chen Y, Ge F, Jia R, Jin Y, Wang Y, Xu J. A phase II study of concurrent chemoradiotherapy and erlotinib for inoperable esophageal squamous cell carcinoma. Oncotarget. 2016; 7:57310–57316. doi: 10.18632/oncotarget.9809.
65. Hedner C, Borg D, Nodin B, Karnevi E, Jirstrom K, Eberhard J. Expression and Prognostic Significance of Human Epidermal Growth Factor Receptors 1 and 3 in Gastric and Esophageal Adenocarcinoma. PLoS One. 2016; 11:e0148101.
66. Robinson MD, McCarthy DJ, Smyth GK. edgeR: a Bioconductor package for differential expression analysis of digital gene expression data. Bioinformatics. 2010; 26:139–140.
67. Tang W, Liao Z, Zou Q. Which statistical significance test best detects oncomiRNAs in cancer tissues? An exploratory analysis. Oncotarget. 2016; 7:85613–85623. doi: 10.18632/oncotarget.12828.
68. Shi H, Chen J, Li Y, Li G, Zhong R, Du D, Meng R, Kong W, Lu M. Identification of a six microRNA signature as a novel potential prognostic biomarker in patients with head and neck squamous cell carcinoma. Oncotarget. 2016; 7:21579–21590. doi: 10.18632/oncotarget.7781.
69. Chen Z, Wu H, Wang G, Feng Y. Identification of potential candidate genes for hypertensive nephropathy based on gene expression profile. BMC Nephrol 2016; 17: 149.
70. Bland JM, Altman DG. Statistical methods for assessing agreement between two methods of clinical measurement. Lancet. 1986; 1:307–310.
71. Zamora J, Abraira V, Muriel A, Khan K, Coomarasamy A. Meta-DiSc: a software for meta-analysis of test accuracy data. BMC Med Res Methodol 2006; 6: 31.
72. Meng X, Xiao C, Zhao Y, Jia L, Tang Y, Li D. Meta-analysis of microarrays: diagnostic value of microRNA-21 as a biomarker for lung cancer. Int J Biol Markers. 2015; 30:e282–285.
73. Dweep H, Gretz N. miRWalk2.0: a comprehensive atlas of microRNA-target interactions. Nat Methods. 2015; 12:697.
74. Dweep H, Sticht C, Pandey P, Gretz N. miRWalk--database: prediction of possible miRNA binding sites by “walking” the genes of three genomes. J Biomed Inform. 2011; 44:839–847.
75. Maragkakis M, Vergoulis T, Alexiou P, Reczko M, Plomaritou K, Gousis M, Kourtis K, Koziris N, Dalamagas T, Hatzigeorgiou AG. DIANA-microT Web server upgrade supports Fly and Worm miRNA target prediction and bibliographic miRNA to disease association. Nucleic Acids Res. 2011; 39:W145–148.
76. Betel D, Koppal A, Agius P, Sander C, Leslie C. Comprehensive modeling of microRNA targets predicts functional non-conserved and non-canonical sites. Genome Biol 2010; 11: R90.
77. Tsang JS, Ebert MS, van Oudenaarden A. Genome-wide dissection of microRNA functions and cotargeting networks using gene set signatures. Mol Cell. 2010; 38:140–153.
78. Wang X, El Naqa IM. Prediction of both conserved and nonconserved microRNA targets in animals. Bioinformatics. 2008; 24:325–332.
79. Vejnar CE, Blum M, Zdobnov EM. miRmap web: Comprehensive microRNA target prediction online. Nucleic Acids Res. 2013; 41:W165–168.
80. Hsu SD, Chu CH, Tsou AP, Chen SJ, Chen HC, Hsu PW, Wong YH, Chen YH, Chen GH, Huang HD. miRNAMap 2.0: genomic maps of microRNAs in metazoan genomes. Nucleic Acids Res. 2008; 36:D165–169.
81. Blin K, Dieterich C, Wurmus R, Rajewsky N, Landthaler M, Akalin A. DoRiNA 2.0--upgrading the doRiNA database of RNA interactions in post-transcriptional regulation. Nucleic Acids Res. 2015; 43:D160–167.
82. Kertesz M, Iovino N, Unnerstall U, Gaul U, Segal E. The role of site accessibility in microRNA target recognition. Nat Genet. 2007; 39:1278–1284.
83. Loher P, Rigoutsos I. Interactive exploration of RNA22 microRNA target predictions. Bioinformatics. 2012; 28:3322–3323.
84. Rehmsmeier M, Steffen P, Hochsmann M, Giegerich R. Fast and effective prediction of microRNA/target duplexes. RNA. 2004; 10:1507–1517.
85. Garcia DM, Baek D, Shin C, Bell GW, Grimson A, Bartel DP. Weak seed-pairing stability and high target-site abundance decrease the proficiency of lsy-6 and other microRNAs. Nat Struct Mol Biol. 2011; 18:1139–1146.
86. Friard O, Re A, Taverna D, De Bortoli M, Cora D. CircuitsDB: a database of mixed microRNA/transcription factor feed-forward regulatory circuits in human and mouse. BMC Bioinformatics 2010; 11: 435.
87. Wang J, Lu M, Qiu C, Cui Q. TransmiR: a transcription factor-microRNA regulation database. Nucleic Acids Res 2010; 38:D119–122.