
INTRODUCTION
Breast cancer is the principal leading cause of cancer-related death among women worldwide [1]. In recent years, breast cancer has become the most frequently diagnosed cancer in Chinese women, accounted for 12.2% of global cases and 9.6% of related deaths from breast cancer worldwide [2]. Breast cancer is often diagnosed at the advanced stages due to nonspecific symptoms or lack of symptoms, leading to a poor prognosis [3]. The early diagnosis of breast cancer would improve the prospects of survival. Consequently, increasing studies have focused on the biomarkers for early diagnosis and new therapeutic targets for breast cancer.
Telomeres are caps of linear chromosomes at the chromosomal ends, which are protected by a number of molecules that constitute the capping shelterin complex [4, 5]. Cancer cells, characteristically acquire infinite capability to divide through maintenance of telomeres by sustained expression of telomerase, or by an alternative lengthening of telomeres (ALT) mechanism [6]. Telomere length maintenance is a complex process controlled by a large number of proteins including shelterin complexes, telomerase complexes and many DNA repair proteins [7]. The shelterin complex is consisted of six proteins including TRF1, TRF2, POT1, TIN2, TPP1 and RAP1, which packages telomeric DNA and protects the integrity and stability of chromosome during DNA replication [8]. Shelterin proteins interact with a number of other factors known as shelterin associated proteins that can influence integrity and dynamics of chromosome ends. These shelterin-associated proteins include TNKS1, TNKS2, and TEP [9, 10]. They are essential for the overall maintenance of genome integrity and prevent DNA degradation and chromosome end-to-end fusions [11]. Telomere dysfunction through telomere shortening and dysregulation of telomeric DNA-binding proteins has been reported in many kinds of cancers, including breast cancer [12]. It has been revealed that the telomere length was significantly associated with the risk and prognosis of breast cancer [13]. Telomerase is responsible for elongation of telomeric repeats at chromosomal ends and is important for controlling cell survival by maintaining telomere length [14]. Telomerase is a ribonucleoprotein enzyme composed of two essential components, a telomerase RNA template subunit and a catalytic protein subunit, telomerase reverse transcriptase (TERT) [15, 16]. These two subunits bind to H/ACA ribonucleoprotein complex containing dyskerin, NOP10, NHP2, and GAR1 which is necessary for synthesis and elongation of telomeric DNA [15]. It has been shown that the telomerase activity is silenced in almost all adult somatic cells but activated in more than 90% of cancers. Activation of telomerase is a fundamental step in tumorgenesis [9]. Genetic variation in TERT, TRF1, TRF2, POT1, TEP, TNKS1, TNKS2, TP53, ATRX and DAXX [17–24] and aberrant promoter methylation of TERT, WRN, POT1, RAD50 and TP53 [25–28] have been reported to contribute to the dysregulation of telomere length and telomerase activity in breast cancer.
Methylation within promoter regions serves as crucial regulator in tumorgenesis and has been suggested as a hallmark of cancers for its role in silencing gene expression [29–31]. Given their important functions in cancer initiation and progression, methylation changes have been considered as potential biomarkers for the early detection of cancers, including cervical, breast, bladder, gastrointestinal, and lung cancer [32–35]. However, the methylation patterns of most of the telomere related genes and their correlation with breast cancer are still unknown.
The purpose of the present study was to investigate the methylation of telomere related genes in breast cancer and identify new molecular biomarkers for breast cancer diagnosis and treatment. We analyzed 29 candidate genes in 184 breast cancer patients with high-throughput microfluidic PCR based target enrichment and next generation bisulfite sequencing method. The significantly differentially methylated genes were selected to analyze the correlation between promoter methylation and their expression. For the selected gene panel, further evaluation of its performance in breast cancer classification was implemented.
RESULTS
Methylation analysis of breast tumor and matched normal tissues
In the present study, methylation analysis of 29 telomere related genes was performed on 184 breast cancer patients with paired tumor and normal tissues using next generation bisulfite sequencing method. The MiSeq sequencing results showed that microfluidic PCR-generated libraries had highly sample and gene uniformity. About 90% of sequencing reads were mapped to the targeted promoter regions, and 97% of samples achieved coverage within 2-folds of the average reads.
The average promoter methylation level of all candidate genes was summarized in Table 1. In general, the average methylation level of the 29 genes was 8.20% in tumor and 7.13% in normal tissue (P = 4.30E-21), and the average methylation level in 7 genes (ATRX, DKC1, NBS1, RAD50, RAD51D, RTEL and TRF1) was larger than 10%. It was obviously that the promoter methylation in most of the candidate genes was at a low level (< 1%). Paired t test revealed that 9 genes (ATRX, NHP2, RAD50, RAD51D, RAP1, RTEL, TERC, TP53 and TRF1) showed significant methylation difference between tumor and matched normal tissues. Except for ATRX, all of them showed hyper-methylation in breast cancer. The methylation difference of RAD50, RTEL, TERC and TRF1 remained significant after Holm’s correction (Table 1). The average methylation level of the 4 hyper-methylated genes showed highly significant difference between breast tumor and matched normal tissues (P = 3.54E-35) (Figure 1). Among them, RTEL showed the highest methylation level and the smallest P value for difference in methylation between breast tumor and normal tissues (corrected P = 9.05E-36) with close to 20% of methylation level change.
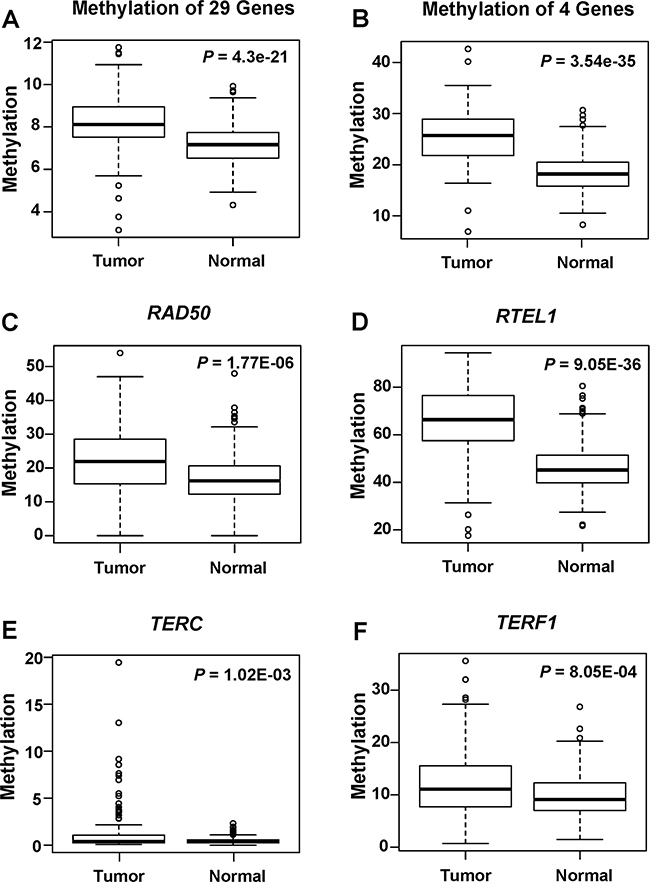
Figure 1: Boxplots for average methylation levels of candidate genes in 184 tumor and matched normal tissues. The average methylation levels were shown for (A) 29 candidate genes, and (B) 4 hyper-methylated genes, respectively. P values were calculated using paired t-test. The average methylation levels were shown for (C) RAD50, (D) RTEL, (E) TERC, and (F) TRF1 genes, respectively. P values were calculated using paired t-test and adjusted with Holm’s correction procedure.
Table 1: The methylation level of 29 genes in tumor and normal tissues from 184 breast cancer patients
GeneName |
Methylation level (mean±SD) |
Differencea |
P valueb |
Corrected P valuec |
|
|---|---|---|---|---|---|
Tumor |
Normal |
||||
ATM |
0.53±0.42 |
0.55±0.47 |
-0.02 |
0.844 |
1 |
ATRX |
28.84±9.49 |
30.55±6.24 |
-1.71 |
0.036 |
0.792 |
BLM |
0.63±0.73 |
0.58±0.38 |
0.05 |
0.396 |
1 |
CBX3 |
0.52±0.40 |
0.53±0.84 |
-0.01 |
0.906 |
1 |
CMYC |
0.60±0.85 |
0.57±0.58 |
0.03 |
0.787 |
1 |
DAXX |
0.47±0.45 |
0.45±0.40 |
0.02 |
0.521 |
1 |
DKC1 |
34.81±21.68 |
34.18±16.23 |
0.63 |
0.726 |
1 |
GAR1 |
1.73±1.39 |
1.77±1.20 |
-0.04 |
0.761 |
1 |
HMBOX |
0.60±0.84 |
0.48±0.60 |
0.12 |
0.115 |
1 |
MEN1 |
0.55±0.67 |
0.67±0.78 |
-0.12 |
0.133 |
1 |
NBS1 |
11.74±5.27 |
11.53±3.84 |
0.21 |
0.672 |
1 |
NHP2 |
0.87±0.87 |
0.68±0.58 |
0.19 |
0.009 |
0.216 |
NME1 |
0.53±0.40 |
0.47±0.28 |
0.06 |
0.129 |
1 |
NOP10 |
0.41±0.42 |
0.45±0.45 |
-0.04 |
0.421 |
1 |
OBFC |
0.45±0.60 |
0.42±0.48 |
0.03 |
0.619 |
1 |
PARP1 |
0.68±0.66 |
0.68±0.35 |
0 |
0.936 |
1 |
POT1 |
0.49±0.52 |
0.57±0.57 |
-0.08 |
0.120 |
1 |
RAD50 |
22.52±10.02 |
16.95±7.02 |
5.57 |
6.33E-08 |
1.77E-06 |
RAD51D |
45.36±9.79 |
42.81±7.90 |
2.55 |
0.007 |
0.175 |
RAP1 |
0.54±0.37 |
0.47±0.33 |
0.07 |
0.048 |
1 |
RECQL5 |
0.71±1.12 |
0.57±0.58 |
0.14 |
0.147 |
1 |
RTEL |
66.16±13.66 |
46.29±10.33 |
19.87 |
3.12E-37 |
9.05E-36 |
TCAB1 |
0.45±0.33 |
0.46±0.28 |
-0.01 |
0.883 |
1 |
TEP |
0.91±1.05 |
0.86±0.77 |
0.05 |
0.574 |
1 |
TERC |
1.22±2.33 |
0.48±0.39 |
0.74 |
3.91E-05 |
1.02E-03 |
TNKS1 |
0.52±0.75 |
0.48±0.66 |
0.04 |
0.555 |
1 |
TP53 |
0.67±0.66 |
0.53±0.38 |
0.14 |
0.009 |
0.216 |
TPP1 |
0.63±0.73 |
0.57±0.39 |
0.06 |
0.292 |
1 |
TRF1 |
12.03±6.24 |
9.65±4.37 |
2.38 |
2.98E-05 |
8.05E-04 |
29 Genes |
8.20±1.28 |
7.13±0.96 |
1.07 |
4.30E-21 |
|
SD: Standard deviation; P value < 0.05 in bold.
a Difference: the mean of methylation difference between paired tumor and normal tissues
b P value calculated by paired t test
c Corrected P value using Holm’s correction procedure
Identification of subtype-specific methylation change and its association with clinical characteristics
In four breast cancer subtypes, basal-like patients showed the lowest average methylation level, while HER2-enriched patients showed the highest average methylation level of the 29 genes (Figure 2). Neither the average methylation level of the 29 genes (P = 0.205) nor that of the 4 hyper-methylated genes (P = 0.310) was significantly different among the 4 breast cancer subtypes. In further analysis of the individual 29 genes methylation in subtypes using the Kruskal–Wallis Rank Sum test, only RAD51D gene showed significant methylation difference (P = 0.026) among the four subtypes in breast cancer (Figure 2) with the lowest methylation level in basal-like tumor.
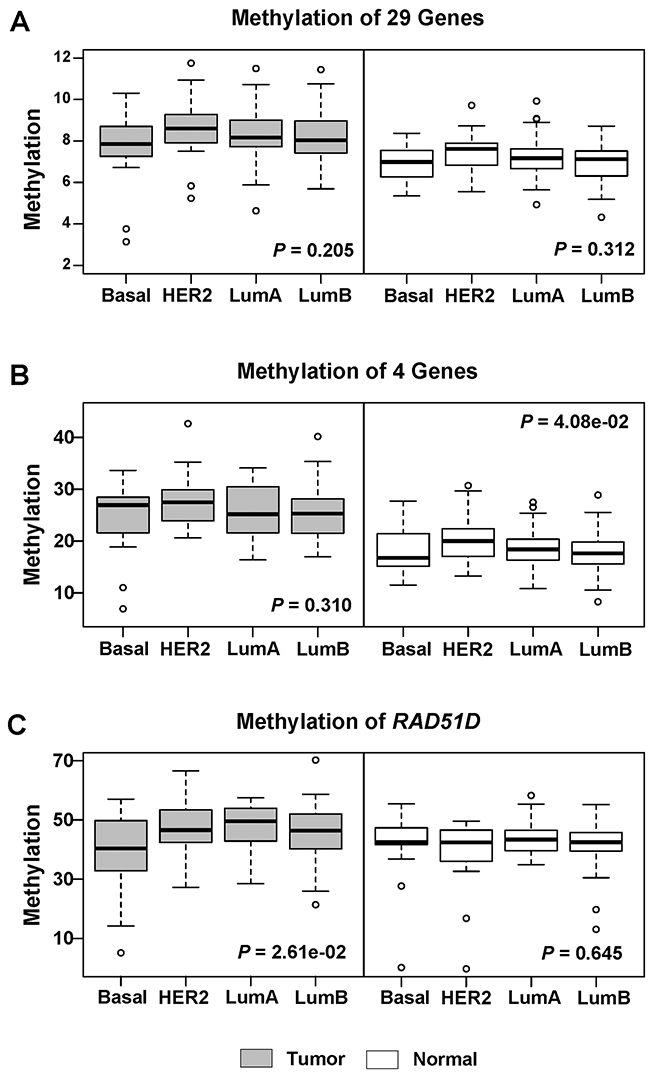
Figure 2: Boxplots stratified by subtypes for methylation levels of candidate genes in 184 tumor and matched normal tissues. (A) The methylation level was shown for all 29 genes in tumor and normal tissues. (B) The methylation level was shown for 4 hyper-methylated genes in tumor and normal tissues. (C) The methylation level was shown for RAD51D in tumor and normal tissues. P value was calculated using Kruskal-Wallis rank sum test. Here, tumor (dark color) and normal (light color) were displayed in different colors.
Besides, we analyzed the average methylation level of the 29 genes and the 4 hyper-methylated genes in patients with different clinical characteristics. No significant association was found between the average methylation of the 29 genes/4 hyper-methylated genes and clinical characteristics. Then the individual methylation level of the 29 genes was analyzed for the association with patient clinical characteristics. There were several genes showing association of methylation with some clinical characteristics (P < 0.05) (Supplementary Table 3-5). However, only the methylation of TERC associated with ER status remained significant after Holm’s correction (P = 0.0203) (Supplementary Table 3).
Gene expression and their correlation with methylation
In the 29 candidate genes, 4 of them showed significant difference of methylation between the tumor and normal tissues after Holm’s correction. To further analyze the potential regulation mechanism, we explored the expression of the 4 hyper-methylated genes in 113 breast cancer patients with enough paired tumor and normal tissues available (Table 2 and Supplementary Figure 1). In paired t test analysis, all of the 4 genes (RAD50, RTEL, TERC and TRF1) showed significant expression (dCt) difference between tumor and normal tissues (with corrected P values of 1.22E-16, 7.78E-05, 1.08E-11 and 5.05E-13 respectively). The 4 genes showed significant hyper-methylation in tumor tissues of the 113 breast cancer patients (Table 2) same as in the 184 samples. It was obvious that all of the 4 genes showed lower expression in tumor compared with that in normal tissues.
Table 2: The expression and methylation level of 4 genes in 113 patients and the TCGA database
Gene |
Methylation (Mean±SD) |
Expression (dCt: Mean±SD)a |
Methylation (mean) from |
Expression (mean RPKM) from MethHC database |
||||||||
|---|---|---|---|---|---|---|---|---|---|---|---|---|
Tumor |
Normal |
Corrected |
Tumor |
Normal |
Corrected |
Tumor |
Normal |
P valuec |
Tumor |
Normal |
P valuec |
|
RAD50 |
23.73±9.57 |
16.23±6.04 |
9.03E-09 |
5.23±1.05 |
4.15±0.79 |
1.22E-16 |
7.10 |
7.21 |
0.705 |
1851.4 |
1678.5 |
2.01E-02 |
RTEL |
66.20±14.00 |
46.08±10.57 |
1.06E-21 |
5.93±1.29 |
5.31±1.07 |
7.78E-05 |
28.77 |
24.20 |
9.53E-12 |
343.8 |
297.0 |
8.28E-03 |
TERC |
1.26±2.11 |
0.48±0.40 |
5.65E-04 |
6.60±1.62 |
5.35±1.30 |
1.08E-11 |
21.27 |
16.22 |
2.42E-06 |
0.5 |
0.3 |
0.201 |
TRF1 |
11.97±6.19 |
9.95±4.46 |
5.49E-03 |
6.36±1.05 |
5.37±1.01 |
5.05E-13 |
4.02 |
4.34 |
2.55E-02 |
715.5 |
597.4 |
1.40E-05 |
SD: standard deviation; P value < 0.05 in bold.
a Higher dCt means lower expression
b Corrected P value calculated by paired t test and Holm’s correction procedure
c P value extracted from MethHC database (uncorrected)
We validated the results with the TCGA data from the MethHC database. RTEL, TERC and TRF1 showed significantly different methylation between tumor and normal tissues with hyper-methylation of RTEL, TERC in tumor in TCGA data set (Table 2). RAD50, RTEL, and TRF1 also showed significant difference of expression between tumor and normal tissues in TCGA data but with higher expression in tissues.
We evaluated the methylation level of each gene against their expression level using Spearman’s rank correlation test. RAD50 (P = 6.87E-03, R = -0.184), RTEL (P = 3.40E-03, R = -0.199) and TRF1 (P = 0.012, R = -0.171) showed significant and negative cis correlation between promoter methylation and gene expression. While no significant cis correlation between the promoter methylation and expression was found for TERC.
There is evidence that RTEL gene interacts with TRF1 in protecting telomere ends during replication [36]. Spearman’s rank correlation test was used to analyze the correlation of methylation and expression status between these two genes in the 113 patients. Our results indicated that these two genes showed strongly significant correlation of expression status (P = 5.42E-17, R = 0.523) and significant correlation of methylation status (P = 0.011, R = 0.171) in breast cancer, both of which were hyper-methylated and down-regulated in expression.
Evaluation of 4-gene panel as potential diagnostic biomarker for breast cancer prediction
The multivariate logistics regression analysis was applied to evaluate the performance of the panel of 4 genes (RAD50, RTEL, TERC and TRF1) as biomarkers for breast cancer prediction (Table 3). The results showed a good performance with a high level of efficiency for breast cancer prediction using different models of these 4 genes. The ROC analysis (Figure 3) showed that methylation (AUC = 0.897) and expression level (AUC = 0.846) of the 4-gene panel had excellent predictive performance and were able to discriminate tumor from normal tissues. And the integration analysis of methylation and expression using the 4-gene panel showed even better performance in breast cancer detection (Sensitivity = 0.832, Specificity = 0.890, Accuracy = 0.861 and AUC = 0.947). The adjusted estimate of LOOCV prediction error was 0.11 for the integration model (Table 3).
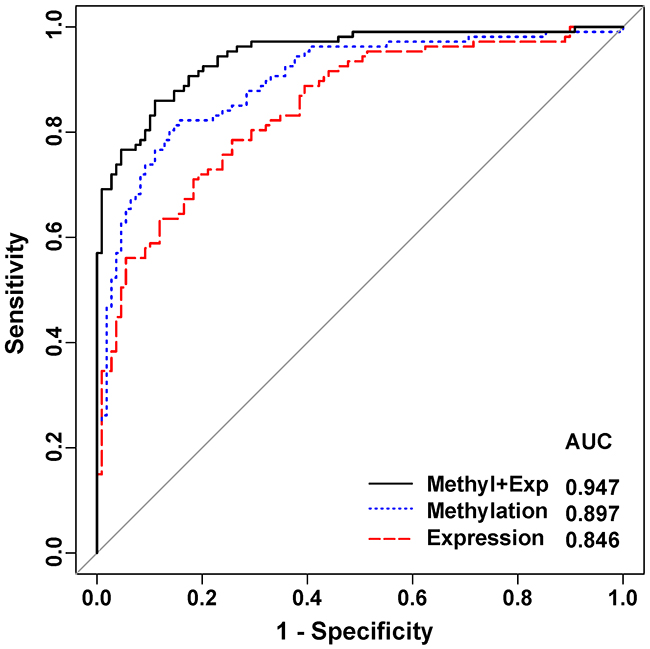
Figure 3: Receiver operating characteristic (ROC) curve analysis in breast cancer detection. The curve was obtained by calculating the sensitivity and specificity of the test at every possible cutoff point, and plotting the sensitivity against 1-specificity. The curves were marked for methylation in blue, expression in red, and integrated methylation/expression in black.
Table 3: The predictive performance of logistics regression models using the 4-gene panel in breast tumor classification
Model |
CV error a |
Sensitivity |
Specificity |
Accuracy |
AUC |
|---|---|---|---|---|---|
Methylation + Expression |
0.110 |
0.832 |
0.890 |
0.861 |
0.947 |
Methylation |
0.137 |
0.794 |
0.862 |
0.829 |
0.897 |
Expression |
0.170 |
0.738 |
0.761 |
0.750 |
0.846 |
a The adjusted estimate of LOOCV prediction error
DISCUSSION
Dysregulation of telomere and telomerase was a fundamental step in tumorgenesis of almost all kinds of cancers [9]. Promoter methylation is an early event in tumorgenesis and has been considered as a promising biomarker for early detection of cancer [37, 38]. The aberrant promoter methylation of telomere related gene would be a crucial event in tumorgenesis. So far, the promoter methylation of most of telomere related genes has not been studied in breast cancer. DNA repair and telomere maintenance are two crucial processes that protect the genome against instability. The fact that many DNA repair proteins interact with telomeres indicates an important interplay between telomere maintenance and DNA repair [39]. Our study has included some DNA repair genes (Supplementary Table 1). In addition to the 29 genes we studied here, 6 more telomere related genes (CTC1, MRE11, TRF2, UPF, TIN2, and TNKS2) were beyond the online software’s parameters for promoter methylation primer design and were excluded from the study. The other two crucial genes TERT and WRN have been studied in our previous methylation and expression analysis [40, 41]. To our knowledge, this is the first comprehensive study of methylation on a large number (29) of telomere related genes in a relative large number of samples (184 breast cancer patients).
In the present study, the average methylation level of the 29 telomere related genes was higher in breast tumor than in normal tissue. The 4 genes (RAD50, RTEL, TERC and TRF1) showed significant hyper-methylation and lower expression in breast cancer. They have different functions in telomere length maintenance, telomerase activity and DNA repair. RAD50 is a crucial protein enrolled in DNA repair [42]. RTEL is a DNA helicase which functions in the stability, protection and elongation of telomeres [43]. TERC is a critical component of telomerase complex, which provides RNA template for the telomere elongation [44]. TRF1 is a component of shelterin complex and functions as an inhibitor of telomerase [45]. Hyper-methylation of these 4 genes may affect their regular functions and results in tumorgenesis.
Aberrant promoter methylation has been indicated to regulate downstream gene expression [46–50]. However lately, a more complex pattern has been reported that gene expression and methylation may be both positively and negatively correlated [41, 51]. Clinically relevant aberrant methylation may serve as a potential biomarker which is not always linked with changes in gene expression [52]. In the analysis of the 4 significantly hyper-methylated genes (RAD50, RTEL, TERC and TRF1), all of their expression levels were lower in tumor than the matched normal tissues, which suggested a negative correlation trend between methylation and expression. However, in cis correlation analysis, only RAD50, RTEL and TRF1 showed significant negative correlation (P < 0.05) between methylation and gene expression in our cohort. Although not all of the 4 hyper-methylated genes showed negative cis correlation, with the integration of methylation and expression coefficient, the 4-gene panel showed better prediction performance of tumor/normal status than using only methylation or gene expression as parameters. It implied that both methylation and gene expression are crucial in breast cancer tumorgenesis beyond the regulation of methylation on expression.
In the methylation analysis against subtype and clinical characteristics, RAD51D showed breast cancer subtype specific methylation pattern and associated with Ki67 expression level. Besides, three genes (NME1, TERC and POT1) associated with ER status, NME1 and RTEL associated with HER2 status, ATRX and NBS1 associated with the lymph node metastasis, ATRX associated with TP53 mutation status, TNKS1 associated with the PR status were found in our cohort. It indicated that different methylation patterns of telomere related genes may contribute to the heterogeneity of breast cancer [53].
Our findings validated some of the previously reported biomarkers and provided novel biomarkers for breast cancer detection. In our candidate genes, RAD50 has been reported to be hyper-methylated in breast cancer patients [28]. Although previous studies indicated some hyper-methylation of TP53 promoter, the hyper-methylation level was not significant in breast cancer tissues in comparison with adjacent normal tissues [27]. POT1 was hyper-methylated and can be reactived by 5-aza-2′-deoxycytidine in breast cancer cell line [25]. In our study, POT1 showed low level of methylation in breast cancer tissues. Hyper-methylation of RAD50 and TP53 (P = 6.33E-08 and P = 0.009 before correction, respectively) in breast cancer was validated in our cohort. However, only RAD50 remained significant after Holm’s correction. We also validated our results with the TCGA data from MethHC database. Three of the 4 hyper-methylated genes (RTEL, TERC and TRF1) showed significant methylation change in TCGA set (Table 2) except RAD50. RTEL and TERC were also hyper-methylated in tumor in the TCGA data set. These 4 genes showed significant reduced expression in tumor in our cohort. In TCGA data set, RAD50, RTEL, and TRF1 also showed significant gene expression change. However, the direction of up or down regulation of the gene expression is not consistent between these 2 datasets. We noticed that DNA methylation was obtained from Illumina Infinium Human Methylation450 Beadchip and gene expression was obtained from RNASeq in TCGA Data Portal for breast cancer. The discrepancy observed here is most likely related to the differences in detection methods, stage or type of breast tumor, and even the differences in race or ethnicity [41].
The further purpose of our study was to find new biomarkers for breast cancer detection in the telomere related genes. The new biomarker of the 4-gene panel showed good performance in cancer prediction with high sensitivity, specificity accuracy. The model of integrating methylation and expression showed a better performance in breast cancer classification than that using methylation or expression as single parameter. The breast cancer specific methylation and expression pattern, AUC value and their critical role in telomere related functions support these 4 genes as potential biomarkers for breast cancer detection. Since this study is the first comprehensive research on methylation of telomere related genes in breast cancer, cross-validation studies remain to be done for confirmation and further clinical applications of these genes as biomarkers.
It has been reported that RTEL interacts with TRF1 in protecting telomere ends during replication [36]. Our results also showed strongly significant co-expression (P = 5.42E-17, R = 0.523) and significant co-methylation (P = 0.011, R = 0.171) of these two genes using Spearman’s rank correlation coefficient test. RTEL also functions in maintenance of general genome integrity [54]. It may be through some of the non telomere related mechanisms that it exerts an influence on tumorgenesis. The interaction of these two genes in breast cancer is worth further investigation.
In summary, the present study provided a comprehensive evaluation of methylation pattern of 29 telomere related genes in breast cancer. Consequent confirmation of our results could lead to a better understanding of epigenetic characteristic of the telomere related genes and promoting the clinical application of these methylation biomarkers for early detection and treatment monitoring of breast cancer.
MATERIALS AND METHODS
Patients and tumor specimens
Fresh frozen primary breast tumor and matched adjacent normal tissues (located at least 2 cm away from the site of tumor tissue) were obtained from 184 patients with no prior chemotherapy or radiotherapy who underwent surgical resection of the breast tumors at Xiangya Hospital, Central South University from 2013 to 2015. All breast specimens were reviewed by experienced pathologists. The clinicopathological characteristics of 184 patients were summarized in Table 4. The tumors were classified based on the guideline of St Gallen International Expert Consensus [55]. The study was approved by the Ethics Committee of Central South University, Changsha, China. All participants provided written informed consent for participation in the study.
Table 4: Clinicopathological characteristics of 184 breast cancer patients
Characteristics |
Subtypes |
Number of Patients, n (%) |
|---|---|---|
Molecular subtype |
Basal-like |
22 (12.0) |
HER2-enriched |
21 (11.4) |
|
Luminal A |
46 (25.0) |
|
Luminal B |
83 (45.1) |
|
Unknown |
12 (6.5) |
|
ER status |
Positive (+) |
134 (72.8) |
Negative (-) |
50 (27.2) |
|
PR status |
Positive (+) |
111 (60.3) |
Negative (-) |
73 (39.7) |
|
HER2 status |
Positive (+) |
98 (53.3) |
Negative (-) |
58 (31.5) |
|
Unknown |
28 (15.2) |
|
Lymph node metastasis |
Yes |
69 (37.5) |
No |
115 (62.5) |
|
Age |
≥50 |
99 (53.8) |
[35-50) |
80 (43.4) |
|
<35 |
5 (2.7) |
|
Ki67 level |
<10% |
46 (25.0) |
10%-25% |
71 (38.6) |
|
>25% |
67 (36.4) |
|
TP53 mutation |
Positive (+) |
138 (75.0) |
Negative (-) |
46 (25.0) |
DNA bisulfite conversion and RNA reverse transcription
DNA and total RNA was extracted from fresh frozen tissue samples as previously described [40, 41]. Sodium bisulfite conversion of 500 ng genomic DNA was carried out using the EZ DNA Methylation-LightningTM Kit (Zymo Research, Irvine, CA, USA) according to the manufacturer’s instruction. For cDNA synthesis, 500 ng total RNA was reverse transcribed using a RevertAid 1st Strand cDNA synthesis kit (Thermo Scientific, CA, USA) according to the manufacturer’s instruction.
Candidate gene selection and primer design
Firstly we selected the genes (DKC1, POT1, RAP1, TERC, TERT, TIN2, TPP1, TRF1, TRF2) encoding telomerase and core shelterin complex from the telomerase database (http://telomerase.asu.edu/reviews.html) and recently published papers [8, 56]. Then we selected the genes encoding core factors, which interact with the telomerase and shelterin complex composition (ATM, ATRX, ATRX, BLM, CBX3, CMYC, CTC1, DAXX, GAR1, HMBOX1, MEN1, MRE11, NBS1, NHP2, NME1, OBFC, PARP1, RAD50, RAD51D, RECQL5, RTEL, TCAB1, TEP, TNKS1, TNKS2, TP53, UPF, WRN) based on published papers [56–60]. These genes involved in telomere maintenance, as well as genes that are transiently associated with the telomere, and genes involved in DNA repair and helicase genes [56–60]. TERT and WRN have been studied in our previous methylation/expression studies [40, 41] and excluded from analysis here. The 5’ promoter sequence of candidate genes was obtained from UCSC genome browser (http://genome.ucsc.edu/cgi-bin/hgGateway). Target-specific bisulfite sequencing PCR primers (BSP) were designed using the online software, Methprimer (http://www.urogene.org/methprimer/). However, the promoter sequences of CTC1, MRE11, TIN2, TNKS2, TRF2, and UPF were beyond the online software’s parameters for methylation primer design and were excluded from the study. Finally, 29 telomere related genes were selected for further investigation in the present study. Functional categories of the 29 candidate genes were analyzed using the DAVID functional annotation tool (http://david.abcc.ncifcrf.gov) and summarized in Supplementary Table 1. After methylation primer design, universal sequencing tags were added to the 5’-end of the forward and reverse primer sequences by following the User Guide of Access ArrayTM System for Illumina Sequencing Systems (Fluidigm, South San Franciso, CA, USA). For expression analysis, cDNA sequence was obtained from the Consensus CDS (CCDS) (https://www.ncbi.nlm.nih.gov/CCDS/CcdsBrowse.cgi). Gene expression primers of candidate genes and reference gene GAPDH were designed using Primer 3. All primers were validated by PCR and products were confirmed on agarose gels. The amplification efficiency of the gene expression primers were between 90% and 110%. The primer sequences were displayed in Supplementary Table 2.
High-throughput microfluidic PCR for target sequence amplification and next generation sequencing
As our previous studies, the 48.48 Access ArrayTM system (Fluidigm, South San Franciso, CA, USA) and Access Array Barcode Library was used for target enrichment and sequencing libraries construction [40, 41]. The product size distribution was examined by Agilent Bioanalyzer 2100. The purified libraries were quantified with Qubit® dsDNA HS Assay Kit (Life Technologies, CA, USA) and sequenced on a MiSeq sequencer using MiSeq Reagent Kit v2 (500 cycles). The methylation status and methylation level of each analyzed CpG-site were returned from trimmed read data. The methylation level for each gene was assigned by averaging the methylation level of all CpG sites in the promoter amplicon for each sample as previously reported [40].
Expression analysis
To explore the expression variation of the hyper-methylated genes, real-time fluorescence quantitative polymerase chain reaction (qPCR) was performed on a CFX96™ Real-Time PCR Detection System (Bio-Rad, CA, USA). In the 184 patient specimens, total 113 patients were available for expression analysis due to the limitation of tissue block. All the qPCR experiments were performed in triplicates. The qPCR mixture consisted of 2 μL of cDNA sample, 2 μL nuclease-free water, 5 μL 2 × SYBR Green PCR master mix (Roche, IN, USA), and 1 μL of each gene specific primer (2 μm). The PCR cycling conditions were: 1 cycle of 95 °C per 10 min, 40 cycles of 95 °C per 5 s, 60°C per 30 s, 72 °C per 30 s, followed by dissociation curve analysis (65–95 °C: increment 0.5 °C for 5 s) to verify the amplification of a single product. The threshold cycle (Ct) value was determined using the auto setting on the CFX Sequence Detection System. The gene expression difference between tumor and normal tissues was determined using delta Ct (dCt) as: Ct (Target gene) - Ct (GAPDH), where a larger dCt value means lower expression level.
Statistical analysis
The paired t test was used to determine the difference in methylation and expression level between tumor and normal tissues. Spearman’s rank correlation coefficient test was applied to analyze association between methylation and expression in tumor and normal tissues. The Kruskal–Wallis rank sum test was performed to examine the correlations between gene methylation and expression levels against clinicopathological characteristics and subtypes. It was considered statistically significant if the P value was less than 0.05 and adjusted using the Holm’s correction procedure [23]. A multivariate logistics regression analysis was applied to classify tumor/normal status. The predictive performance using the logistics regression models for the selected panel was evaluated based upon sensitivity, specificity, and accuracy measurements. And the prediction error using leave one out cross validation (LOOCV) method was also estimated as a performance measurement for these models. AUCs and receiver operating characteristic (ROC) analysis were also performed. All statistical analysis was done in R environment (version 3.1.0).
Validation in the cancer genome atlas (TCGA) dataset
To verify if the methylation and expression patterns of the 4 hyper-methylated telomere related genes were characteristics of breast cancer, we downloaded the methylation and gene expression data of breast cancer for the 4 genes from MethHC website (http://MethHC.mbc.nctu.edu.tw/). MethHC is a newly developed database comprising a systematic integration of a large collection of gene methylation and expression data of human cancers from The Cancer Genome Atlas (TCGA) [56]. We compared our results with the corresponding TCGA data of breast cancer to validate our findings.
Abbreviations
Alternative lengthening of telomeres (ALT), Area Under the ROC Curve (AUC), Consensus coding sequence (CCDS), Estrogen receptor (ER), Human epidermal growth factor receptor 2 (HER2), Leave one out cross validation (LOOCV), Progesterone receptor (PR), Quantitative polymerase chain reaction (qPCR), Receiver operating characteristic (ROC), The Cancer Genome Atlas (TCGA), Telomerase reverse transcriptase (TERT).
Author contributions
JFH and FZ performed experiments, analyzed data, wrote and revised the manuscript. XWG analyzed and interpreted the data, wrote and revised the manuscript. LLT collected specimens, followed up with the patients, and analyzed data. LMP analyzed data, and prepared figures and tables. XPL and XXX performed experiments. SMW collected specimens and analyzed data. LZD designed the study and wrote the manuscript. JW designed the study, analyzed data, wrote and revised the manuscript.
CONFLICTS OF INTEREST
Xinwu Guo, Limin Peng, Xipeng Luo, Xunxun Xu and Lizhong Dai are employees of Sanway Gene Technology Inc.
FUNDING
This work was supported in part by grants from the Natural Science Foundation of China (No. 81272296 and 81372228), and grants from China Hunan Provincial Science and Technology Department (No. 2016GK3022, 2016XK2033 and 2016JC2068).
REFERENCES
1. Ferlay J, Soerjomataram I, Dikshit R, Eser S, Mathers C, Rebelo M, Parkin DM, Forman D and Bray F. Cancer incidence and mortality worldwide: sources, methods and major patterns in GLOBOCAN 2012. International journal of cancer. 2015; 136:E359-386.
2. Fan L, Strasser-Weippl K, Li JJ, St Louis J, Finkelstein DM, Yu KD, Chen WQ, Shao ZM and Goss PE. Breast cancer in China. The Lancet Oncology. 2014; 15:e279-289.
3. Coughlin SS and Ekwueme DU. Breast cancer as a global health concern. Cancer Epidemiol. 2009; 33:315-318.
4. Lu Y, Wei B, Zhang T, Chen Z and Ye J. How will telomeric complex be further contributed to our longevity? - the potential novel biomarkers of telomere complex counteracting both aging and cancer. Protein & cell. 2013; 4:573-581.
5. de Lange T. How telomeres solve the end-protection problem. Science. 2009; 326:948-952.
6. Heaphy CM, de Wilde RF, Jiao Y, Klein AP, Edil BH, Shi C, Bettegowda C, Rodriguez FJ, Eberhart CG, Hebbar S, Offerhaus GJ, McLendon R, Rasheed BA, et al. Altered telomeres in tumors with ATRX and DAXX mutations. Science. 2011; 333:425.
7. Pinto AR, Li H, Nicholls C and Liu JP. Telomere protein complexes and interactions with telomerase in telomere maintenance. Frontiers in bioscience. 2011; 16:187-207.
8. Martinez P and Blasco MA. Role of shelterin in cancer and aging. Aging cell. 2010; 9:653-666.
9. Salhab M, Jiang WG, Newbold RF and Mokbel K. The expression of gene transcripts of telomere-associated genes in human breast cancer: correlation with clinico-pathological parameters and clinical outcome. Breast cancer research and treatment. 2008; 109:35-46.
10. Liu Y, Snow BE, Hande MP, Baerlocher G, Kickhoefer VA, Yeung D, Wakeham A, Itie A, Siderovski DP, Lansdorp PM, Robinson MO and Harrington L. Telomerase-associated protein TEP1 is not essential for telomerase activity or telomere length maintenance in vivo. Molecular and cellular biology. 2000; 20:8178-8184.
11. Palm W and de Lange T. How shelterin protects mammalian telomeres. Annual review of genetics. 2008; 42:301-334.
12. Stephens PJ, Tarpey PS, Davies H, Van Loo P, Greenman C, Wedge DC, Nik-Zainal S, Martin S, Varela I, Bignell GR, Yates LR, Papaemmanuil E, Beare D, et al. The landscape of cancer genes and mutational processes in breast cancer. Nature. 2012; 486:400-404.
13. Svenson U, Nordfjall K, Stegmayr B, Manjer J, Nilsson P, Tavelin B, Henriksson R, Lenner P and Roos G. Breast cancer survival is associated with telomere length in peripheral blood cells. Cancer research. 2008; 68:3618-3623.
14. Shay JW and Wright WE. Senescence and immortalization: role of telomeres and telomerase. Carcinogenesis. 2005; 26:867-874.
15. Wyatt HD, West SC and Beattie TL. InTERTpreting telomerase structure and function. Nucleic acids research. 2010; 38:5609-5622.
16. Meyerson M, Counter CM, Eaton EN, Ellisen LW, Steiner P, Caddle SD, Ziaugra L, Beijersbergen RL, Davidoff MJ, Liu Q, Bacchetti S, Haber DA and Weinberg RA. hEST2, the putative human telomerase catalytic subunit gene, is up-regulated in tumor cells and during immortalization. Cell. 1997; 90:785-795.
17. Pellatt AJ, Wolff RK, Torres-Mejia G, John EM, Herrick JS, Lundgreen A, Baumgartner KB, Giuliano AR, Hines LM, Fejerman L, Cawthon R and Slattery ML. Telomere length, telomere-related genes, and breast cancer risk: the breast cancer health disparities study. Genes, chromosomes & cancer. 2013; 52:595-609.
18. Shen J, Gammon MD, Terry MB, Bradshaw PT, Wang Q, Teitelbaum SL, Neugut AI and Santella RM. Genetic polymorphisms in telomere pathway genes, telomere length, and breast cancer survival. Breast cancer research and treatment. 2012; 134:393-400.
19. Shen J, Gammon MD, Wu HC, Terry MB, Wang Q, Bradshaw PT, Teitelbaum SL, Neugut AI and Santella RM. Multiple genetic variants in telomere pathway genes and breast cancer risk. Cancer epidemiology, biomarkers & prevention. 2010; 19:219-228.
20. Varadi V, Brendle A, Brandt A, Johansson R, Enquist K, Henriksson R, Svenson U, Tavelin B, Roos G, Hemminki K, Lenner P and Forsti A. Polymorphisms in telomere-associated genes, breast cancer susceptibility and prognosis. European journal of cancer. 2009; 45:3008-3016.
21. Shen J, Terry MB, Liao Y, Gurvich I, Wang Q, Senie RT and Santella RM. Genetic variation in telomere maintenance genes, telomere length and breast cancer risk. PloS one. 2012; 7:e44308.
22. Savage SA, Chanock SJ, Lissowska J, Brinton LA, Richesson D, Peplonska B, Bardin-Mikolajczak A, Zatonski W, Szeszenia-Dabrowska N and Garcia-Closas M. Genetic variation in five genes important in telomere biology and risk for breast cancer. British journal of cancer. 2007; 97:832-836.
23. Bojesen SE, Pooley KA, Johnatty SE, Beesley J, Michailidou K, Tyrer JP, Edwards SL, Pickett HA, Shen HC, Smart CE, Hillman KM, Mai PL, Lawrenson K, et al. Multiple independent variants at the TERT locus are associated with telomere length and risks of breast and ovarian cancer. Nature genetics. 2013; 45:371-384, 384e371-372.
24. Haiman CA, Chen GK, Vachon CM, Canzian F, Dunning A, Millikan RC, Wang X, Ademuyiwa F, Ahmed S, Ambrosone CB, Baglietto L, Balleine R, Bandera EV, et al. A common variant at the TERT-CLPTM1L locus is associated with estrogen receptor-negative breast cancer. Nature genetics. 2011; 43:1210-1214.
25. Motevalli A, Yasaei H, Virmouni SA, Slijepcevic P and Roberts T. The effect of chemotherapeutic agents on telomere length maintenance in breast cancer cell lines. Breast cancer research and treatment. 2014; 145:581-591.
26. Bardowell SA, Parker J, Fan C, Crandell J, Perou CM and Swift-Scanlan T. Differential methylation relative to breast cancer subtype and matched normal tissue reveals distinct patterns. Breast cancer research and treatment. 2013; 142:365-380.
27. Radpour R, Barekati Z, Haghighi MM, Kohler C, Asadollahi R, Torbati PM, Holzgreve W and Zhong XY. Correlation of telomere length shortening with promoter methylation profile of p16/Rb and p53/p21 pathways in breast cancer. Modern Pathol. 2010; 23:763-772.
28. Watanabe Y, Maeda I, Oikawa R, Wu W, Tsuchiya K, Miyoshi Y, Itoh F, Tsugawa K and Ohta T. Aberrant DNA methylation status of DNA repair genes in breast cancer treated with neoadjuvant chemotherapy. Genes to cells. 2013; 18:1120-1130.
29. Dong Y, Zhao H, Li H, Li X and Yang S. DNA methylation as an early diagnostic marker of cancer (Review). Biomedical reports. 2014; 2:326-330.
30. Cheung HH, Lee TL, Rennert OM and Chan WY. DNA methylation of cancer genome. Birth defects research Part C, Embryo today : reviews. 2009; 87:335-350.
31. Taberlay PC and Jones PA. DNA methylation and cancer. Progress in drug research. 2011; 67:1-23.
32. Meng W, Huebner A, Shabsigh A, Chakravarti A and Lautenschlaeger T. Combined RASSF1A and RASSF2A Promoter Methylation Analysis as Diagnostic Biomarker for Bladder Cancer. Molecular biology international. 2012; 2012:701814.
33. Farkas SA, Milutin-Gasperov N, Grce M and Nilsson TK. Genome-wide DNA methylation assay reveals novel candidate biomarker genes in cervical cancer. Epigenetics. 2013; 8:1213-1225.
34. Vedeld HM, Andresen K, Eilertsen IA, Nesbakken A, Seruca R, Gladhaug IP, Thiis-Evensen E, Rognum TO, Boberg KM and Lind GE. The novel colorectal cancer biomarkers CDO1, ZSCAN18 and ZNF331 are frequently methylated across gastrointestinal cancers. International journal of cancer. 2015; 136:844-853.
35. Guo S, Yan F, Xu J, Bao Y, Zhu J, Wang X, Wu J, Li Y, Pu W, Liu Y, Jiang Z, Ma Y, Chen X, et al. Identification and validation of the methylation biomarkers of non-small cell lung cancer (NSCLC). Clinical epigenetics. 2015; 7:3.
36. Deng Z, Glousker G, Molczan A, Fox AJ, Lamm N, Dheekollu J, Weizman OE, Schertzer M, Wang Z, Vladimirova O, Schug J, Aker M, Londono-Vallejo A, et al. Inherited mutations in the helicase RTEL1 cause telomere dysfunction and Hoyeraal-Hreidarsson syndrome. Proceedings of the National Academy of Sciences of the United States of America. 2013; 110:E3408-3416.
37. Wang X, Kuang YY and Hu XT. Advances in epigenetic biomarker research in colorectal cancer. World journal of gastroenterology. 2014; 20:4276-4287.
38. Shinjo K and Kondo Y. Targeting cancer epigenetics: Linking basic biology to clinical medicine. Advanced drug delivery reviews. 2015; 95:56-64.
39. Walsh T and King MC. Ten genes for inherited breast cancer. Cancer cell. 2007; 11:103-105.
40. Li Z, Guo X, Wu Y, Li S, Yan J, Peng L, Xiao Z, Wang S, Deng Z, Dai L, Yi W, Xia K, Tang L, et al. Methylation profiling of 48 candidate genes in tumor and matched normal tissues from breast cancer patients. Breast cancer research and treatment. 2015; 149:767-779.
41. Li Z, Heng J, Yan J, Guo X, Tang L, Chen M, Peng L, Wu Y, Wang S, Xiao Z, Deng Z, Dai L and Wang J. Integrated analysis of gene expression and methylation profiles of 48 candidate genes in breast cancer patients. Breast cancer research and treatment. 2016; 160:371-383.
42. Wright WE and Shay JW. Telomere-binding factors and general DNA repair. Nature genetics. 2005; 37:116-118.
43. Du Z, Zhao DS, Zhao YH, Wang SH, Gao Y and Li N. Identification and characterization of bovine regulator of telomere length elongation helicase gene (RTEL): molecular cloning, expression distribution, splice variants and DNA methylation profile. Bmc Mol Biol. 2007; 8.
44. Autexier C and Lue NF. The structure and function of telomerase reverse transcriptase. Annual review of biochemistry. 2006; 75:493-517.
45. Smogorzewska A, Van Steensel B, Bianchi A, Oelmann S, Schaefer MR, Schnapp G and De Lange T. Control of human telomere length by TRF1 and TRF2. Molecular and cellular biology. 2000; 20:1659-1668.
46. Kordi Tamandani DM, Hemati S, Davani SK and Arbabi F. Association between promoter methylation and expression of thyroid hormone receptor beta (THRbeta) gene in patients with gastric cancer in an Iranian population. Journal of gastroenterology and hepatology. 2015; 30:485-489.
47. Malhotra P, Anwar M, Kochhar R, Ahmad S, Vaiphei K and Mahmood S. Promoter methylation and immunohistochemical expression of hMLH1 and hMSH2 in sporadic colorectal cancer: a study from India. Tumour biology. 2014; 35:3679-3687.
48. Feng H, Zhang Z, Qing X, Wang X, Liang C and Liu D. Promoter methylation of APC and RAR-beta genes as prognostic markers in non-small cell lung cancer (NSCLC). Experimental and molecular pathology. 2016; 100:109-113.
49. Aitchison AA, Veerakumarasivam A, Vias M, Kumar R, Hamdy FC, Neal DE and Mills IG. Promoter methylation correlates with reduced Smad4 expression in advanced prostate cancer. The Prostate. 2008; 68:661-674.
50. Balgkouranidou I, Chimonidou M, Milaki G, Tsaroucha E, Kakolyris S, Georgoulias V and Lianidou E. SOX17 promoter methylation in plasma circulating tumor DNA of patients with non-small cell lung cancer. Clinical chemistry and laboratory medicine. 2016.
51. Hon GC, Hawkins RD, Caballero OL, Lo C, Lister R, Pelizzola M, Valsesia A, Ye Z, Kuan S, Edsall LE, Camargo AA, Stevenson BJ, Ecker JR, et al. Global DNA hypomethylation coupled to repressive chromatin domain formation and gene silencing in breast cancer. Genome research. 2012; 22:246-258.
52. Hinoue T, Weisenberger DJ, Lange CP, Shen H, Byun HM, Van Den Berg D, Malik S, Pan F, Noushmehr H, van Dijk CM, Tollenaar RA and Laird PW. Genome-scale analysis of aberrant DNA methylation in colorectal cancer. Genome research. 2012; 22:271-282.
53. Orlando FA and Brown KD. Unraveling breast cancer heterogeneity through transcriptomic and epigenomic analysis. Annals of surgical oncology. 2009; 16:2270-2279.
54. Barber LJ, Youds JL, Ward JD, McIlwraith MJ, O'Neil NJ, Petalcorin MI, Martin JS, Collis SJ, Cantor SB, Auclair M, Tissenbaum H, West SC, Rose AM, et al. RTEL1 maintains genomic stability by suppressing homologous recombination. Cell. 2008; 135:261-271.
55. Goldhirsch A, Winer EP, Coates AS, Gelber RD, Piccart-Gebhart M, Thurlimann B, Senn HJ and Panel m. Personalizing the treatment of women with early breast cancer: highlights of the St Gallen International Expert Consensus on the Primary Therapy of Early Breast Cancer 2013. Annals of oncology. 2013; 24:2206-2223.
56. Xu L, Li S and Stohr BA. The role of telomere biology in cancer. Annual review of pathology. 2013; 8:49-78.
57. Mirabello L, Yeager M, Chowdhury S, Qi L, Deng X, Wang Z, Hutchinson A and Savage SA. Worldwide genetic structure in 37 genes important in telomere biology. Heredity. 2012; 108:124-133.
58. Mirabello L, Yu K, Kraft P, De Vivo I, Hunter DJ, Prescott J, Wong JY, Chatterjee N, Hayes RB and Savage SA. The association of telomere length and genetic variation in telomere biology genes. Human mutation. 2010; 31:1050-1058.
59. Nan H, Qureshi AA, Prescott J, De Vivo I and Han J. Genetic variants in telomere-maintaining genes and skin cancer risk. Human genetics. 2011; 129:247-253.
60. Herbert BS, Wright WE and Shay JW. Telomerase and breast cancer. Breast cancer research. 2001; 3:146-149.