
Introduction
Polycystic ovary syndrome (PCOS) is a common endocrinopathy with various clinical features. According to criteria from Rotterdam [1], the National Institute of Health (NIH) [2], and the Androgen Excess and PCOS Society in 2006 [3], the key characteristics features of PCOS are clinical or biochemical hyperandrogenism, menstrual irregularity, and an ultrasound picture of PCO. Although obesity and insulin resistance (IR) are not included in these diagnostic criteria, 61%-76% of women with PCOS are overweight [4], and IR is seen in 95% of obese and 65% of lean women with PCOS [5]. Therefore, an association between PCOS and the long-term consequences, such as type 2 diabetes (T2DM) and cardiovascular diseases (CVD), has been recognized [6].
PCOS is related to low-grade chronic inflammation [6, 7]. The C-reactive protein (CRP), an acute-phase protein produced mainly by hepatocytes, plays an important role in low-grade chronic inflammation and oxidative stress, especially in women with CVD [8]. Elevated CRP levels are also positively associated with IR and the incidence of T2DM [9]. Hence, high CRP levels are considered a potential cause of the long-term consequences of PCOS [10]. Indeed, Toulis et al. [11] demonstrated that serum CRP concentrations were significantly elevated in women with PCOS compared with controls. In multiple regression analyses, elevated levels of CPR are independently predicted by higher body fat and lower insulin sensitivity in women with PCOS. Therefore, high CRP levels may be an intrinsic characteristic of PCOS, and efforts to prevent or to decrease the serum CRP levels could benefit patients with PCOS.
Metformin, an oral anti-diabetic biguanide drug, could not only benefit hyperinsulinemia, but could also decrease the total and free testosterone levels in patients with PCOS [12-14]. Therefore, metformin is suggested as the first-line treatment for PCOS [6]. Recent preclinical and clinical studies have suggested that metformin has a direct anti-inflammatory action [15]. Considering the relationship between CRP levels and chronic inflammation, IR, the beneficial effects of metformin treatment on CRP levels in patients with PCOS could be expected. However, previous studies about this possible association have yielded contradictory results. Some studies observed significantly decreased CRP levels in patients with PCOS after metformin treatment [12, 16-24], but these results were not confirmed by other studies [25-29]. The relatively small sample sizes of most of these studies could be to blame, at least in part, for the inconsistent results. Furthermore, the impact of metformin dose and treatment duration on CRP levels is unclear. We therefore conducted a meta-analysis to quantify the impact of treatment with metformin on CRP levels in patients with PCOS.
Results
Characteristics of the eligible studies
Figure 1 provides an outline of the selected studies. Fifteen articles [12, 16-29] representing 433 participating women with PCOS were identified as suitable literature for this meta-analysis. The study by Behradmanesh et al. [25] was separated into three studies because they included different BMIs and sample sizes. The study by Morin-Papunen et al. [22] was separated into four studies, as they included different BMIs and metformin treatment duration and dose levels. Therefore, a total of 20 studies were pooled into this meta-analysis. The Rotterdam criteria were used in most of the included studies [12, 16-20, 23, 24, 26-29]; the Homburg criteria were used in two articles [22, 25], and only one study used the NIH diagnostic criteria [21]. Small sample sizes ( < 10) were found in three articles (including six studies) [21, 22, 28]. All the studies used mg/L as the unit for CRP, and immunoturbidimetry method was used in most of studies (12 of 20) to measure serum CRP levels. Three articles [22, 24, 28] (including 7 studies) were assessed as “Low” quality and the other studies were all “High” quality according to the quality score assessment. The main characteristics of the included studies are provided in Table 2.
Table 1: Scale for quality assessment
Criteria |
Score |
1. Is the case definition adequate? |
|
Yes, clearly defined objective according to criteria of diagnosis of PCOS |
2 |
No criteria of diagnosis, but with independent validation |
1 |
No, or no description |
0 |
2. Is the exclusion criteria described adequate? |
|
Yes. clearly described |
2 |
With potential selection biases (e.g., other diseases or pregnancy) |
1 |
No, or no description |
0 |
3. Confound factors |
|
Baseline characteristics clearly described (e.g., BMI, hirsutism) |
2 |
No, or no description |
0 |
4. Dosage and usage of metformin |
|
Clearly described |
2 |
No, or no description |
0 |
5.Sample sizes |
|
≥50 |
2 |
>10,<50 |
1 |
≤10 |
0 |
Table 2: The characteristics of the included studies in meta-analysis
CRP (mean±SD.mg/L) |
||||||||||||||
Study |
Year |
Country |
PCOS Definition |
No. |
BMI |
Age |
Time (months) |
Dose(mg/day) |
Method |
pre |
post |
HOMA-IR ratio |
T ratio |
Score |
Banaszewska |
2009 |
USA |
Rotterdam |
36 |
<25 |
25.2±0.7 |
3 |
1700 |
ECLIA |
2.56±0.64 |
1.23±0.7 |
0.90 |
0.86 |
8 |
Banaszewska |
2011 |
USA |
Rotterdam |
47 |
<25 |
26.0 ±0.6 |
6 |
1700 |
ECLIA |
2.5±0.5 |
1.18±0.7 |
1.05 |
0.82 |
8 |
Behradmanesh |
2011 |
Iran |
Homburg |
12 |
<25 |
22.5±4.5 |
3 |
1500 |
IRMA |
1.4±0.73 |
1.3±0.4 |
0.62 |
NR |
9 |
Behradmanesh |
2011 |
Iran |
Homburg |
14 |
≥25 |
22.5±4.5 |
3 |
1500 |
IRMA |
5.07±5.7 |
2.9±1.9 |
1.21 |
NR |
9 |
Behradmanesh |
2011 |
Iran |
Homburg |
19 |
≥25 |
22.5±4.5 |
3 |
1500 |
IRMA |
2.8±2.4 |
2.5±2.8 |
1.39 |
NR |
9 |
Celik |
2012 |
Turkey |
Rotterdam |
20 |
≥25 |
25.9±5.7 |
3 |
2000 |
ITM |
0.72±0.4 |
0.3±0.2 |
0.84 |
0.91 |
8 |
Cetinkalp |
2009 |
Turkey |
Rotterdam |
47 |
≥25 |
NR |
4 |
2000 |
ITM |
1±1.86 |
0.28±0.3 |
0.86 |
0.85 |
8 |
Diamanti-Kandarakis |
2006 |
Greek |
Rotterdam |
22 |
≥25 |
24.3± 0.6 |
6 |
1700 |
ELISA |
1.92±0.6 |
0.52±0.3 |
0.67 |
0.89 |
8 |
Esfahanian |
2013 |
Iran |
Rotterdam |
17 |
≥25 |
21.9±9.3 |
3 |
2000 |
ITM |
5.2±2.5 |
3.7±1.9 |
0.80 |
0.63 |
8 |
Heutling |
2008 |
UK |
Rotterdam |
21 |
≥25 |
27.8± 4.7 |
6 |
1700 |
ITM |
4±3 |
4±2.2 |
0.84 |
0.70 |
8 |
Hoeger |
2008 |
USA |
Rotterdam |
6 |
≥25 |
16± 1.7 |
6 |
2000 |
CLIA |
3.6±2.7 |
2.8±2 |
0.88 |
1.04 |
5 |
Jakubowska |
2008 |
Poland |
Rotterdam |
29 |
≥25 |
28.2±6.3 |
6 |
1000 |
ITM |
3.53±3.64 |
3.73±3.7 |
0.98 |
0.59 |
9 |
Mohiyiddeen |
2013 |
UK |
Rotterdam |
17 |
≥25 |
30.0± 0.9 |
3 |
1000 |
CLIA |
4.11±1.09 |
1.98±0.6 |
0.66 |
0.83 |
9 |
Mohlig |
2004 |
Germany |
NIH |
9 |
≥25 |
28.9±0.7 |
6 |
2550 |
ITM |
3.34±0.82 |
1.92±0.3 |
1.20 |
0.71 |
6 |
Morin-Papunen |
2003 |
Finland |
Homburg |
8 |
<25 |
28.2±1.2 |
3 |
1000 |
ITM |
1.34±0.39 |
1.2±0.4 |
NR |
NR |
5 |
Morin-Papunen |
2003 |
Finland |
Homburg |
8 |
≥25 |
29.5±1.1 |
3 |
1000 |
ITM |
4.83±1.05 |
2.85±0.9 |
NR |
NR |
5 |
Morin-Papunen |
2003 |
Finland |
Homburg |
8 |
<25 |
28.2±1.2 |
6 |
*1000-2000 |
ITM |
1.34±0.39 |
0.92±0.3 |
NR |
NR |
5 |
Morin-Papunen |
2003 |
Finland |
Homburg |
8 |
≥25 |
29.5±1.1 |
6 |
*1000-2000 |
ITM |
4.83±1.05 |
2.11±0.4 |
NR |
NR |
5 |
Orio |
2007 |
Italy |
Rotterdam |
50 |
≥25 |
28.5±3.1 |
6 |
1700 |
ITM |
1.8±0.9 |
1.1±0.6 |
0.54 |
0.93 |
10 |
Velija-Ašimi |
2007 |
Bosnia and Herzegovina |
Rotterdam |
35 |
≥25 |
20-35 |
12 |
850 |
ITM |
6.37±1.72 |
1.67±0.7 |
NR |
0.72 |
7 |
Abbreviations: CRP, C-reactive protein; HOMA-IR, homeostasis model assessment of insulin resistance; T ratio: total testosterone ratio; CLIA, Chemiluminescent immunoassay; ITM, immunoturbidimetry; IRMA, immunoradiometric assay; ECLIA, electrochemiluminescence immunoassay; ELISA, Enzyme-linked immunosorbent assay; SD, standard deviation; NR, not reported;*1000-2000, 1000mg/day for 3 months, then 2000 mg/day for 3 months. Score, quality score
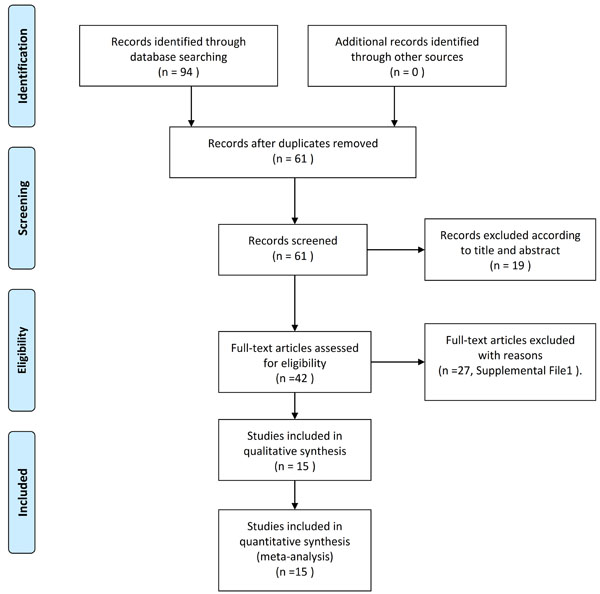
Figure 1: Flow diagram of literature review.
Meta-analysis results
As shown in Figure 2 and Table 3, significant heterogeneity was observed in the pooled analysis (I2 = 93% and PQ < 0.001); therefore, a random-effects model was used, and the pooled results indicated that CRP levels significantly decreased after metformin treatment in women with PCOS (WMD = -1.23mg/L, 95%CI: -1.65 to -0.81, P < 0.001).
Since significant heterogeneity was observed, a subgroup analysis was conducted. BMI was categorized as ≥ 25kg/m2 and < 25kg/m2. Treatment time was categorized as < 6 months and ≥ 6 months. The treatment dose of metformin was categorized as < 2000mg/day and ≥ 2000mg/day. The HOMA2-IR ratio and T ratio were categorized according to quartile intervals. As shown in Table 3, significantly decreased CRP levels were observed both in lean (BMI < 25 kg/m2) and obese (BMI > 25 kg/m2) patients, as well as in the treatment duration and dose subgroup. Similar results were also observed in different categories of HOMA2-IR ratio and total testosterone ratio values. Moreover, the CRP levels decreased more in obese patients (WMD = -1.48 mg/L, 95%CI: -2.16 to -0.80) than in lean patients (WMD = -0.79 mg/L, 95%CI: -1.28 to -0.30), and more in ≥ 6 months (WMD = -1.47 mg/L, 95%CI: -2.16 to -0.78) than in < 6 months (WMD = -1.48 mg/L, 95%CI: -1.41 to -0.47, Figure 3). However, treatment with metformin with ≥ 2000mg/day did not show any significant beneficial effects on CRP levels (WMD = -0.55 mg/L for ≥ 2000mg/day and WMD = -0.21 mg/L for < 2000mg/day, Figure 4). Significant heterogeneity was still observed in the subgroup analysis.
To further investigate which study characteristics of those mentioned above affected the WMD in CRP levels, we performed a meta-regression analysis. WMD was used as the dependent variable, and BMI was used at the baseline; treatment duration, daily dose, HOMA-IR ratio, and total testosterone ratio and sample size were entered as explanatory covariates. As shown in Table 3, BMI (20 studies, P = 0.185), treatment duration (20 studies, P = 0.402), daily dose (20 studies, P = 0.741), HOMA-IR ratio (17 studies, P = 0.172), and total testosterone ratio (20 studies, P = 0.496) were assessed independently. Since no regression coefficients of the covariates were significant at the level of 0.1, multivariate meta-regression was not carried out further.
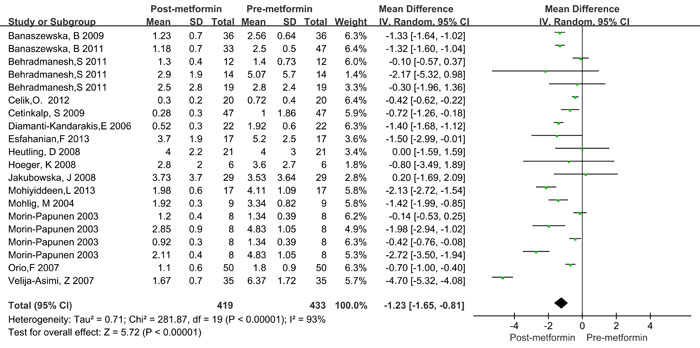
Figure 2: Forest plot for pooled quantitative synthesis.
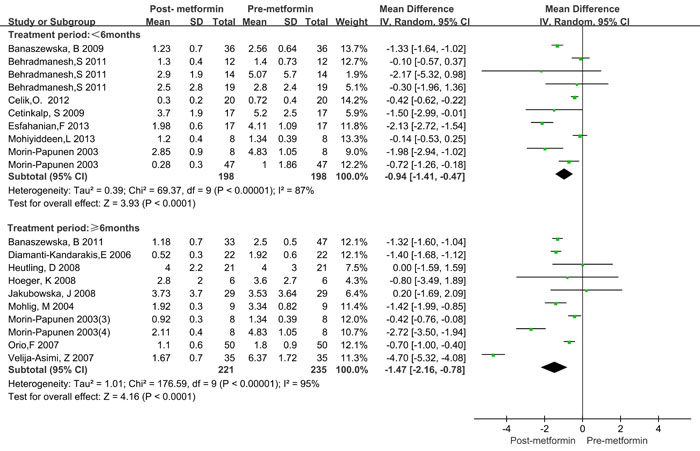
Figure 3: Forest plot for subgroup analysis stratified by treatment duration.
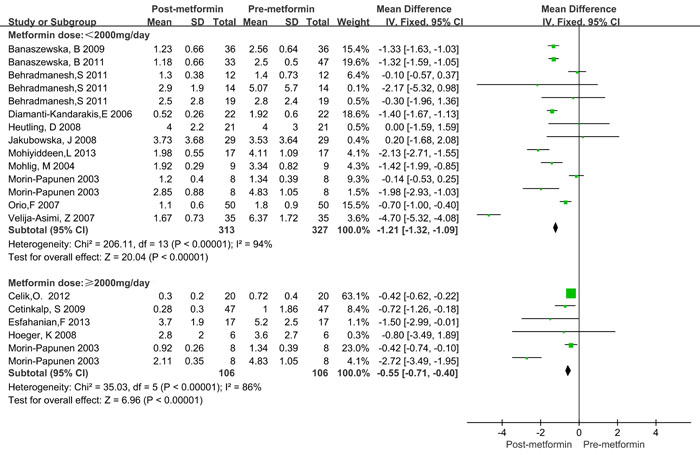
Figure 4: Forest plot for subgroup analysis stratified by metformin dose.
Sensitivity analysis
We first excluded studies one by one, and the pooled WMD was not significantly changed. We further excluded studies by Morin-Papunen et al. [22], Hoeger et al. [28], and Mohlig et al. [21] because these studies included small sample size (PCOS patients < 10), and the recalculated results did not significantly change (WMD = -1.23 mg/L, 95%CI:-1.75 to -0.71, P < 0.001). Using a Galbraith plot analysis, we excluded the outliers that might cause heterogeneity, the CRP levels still decreased significantly after treatment with metformin (WMD = -0.83 mg/L, 95%CI:-1.12 to -0.55); however, the heterogeneity also decreased significantly (I2 = 11% and PQ = 0.34, Supplementary Figure 1).
Publication bias and quality of evidence
Begg’s tests (P = 0.626, Supplementary Figure 2) and Egger’ tests (P = 0.278) showed that no significant publication bias was detected.
The quality of the evidence was shown in Table 3. Considering the included studies were all observational studies (before-after), evidence was downgraded for failure to adequately control confounding. Several comparisons had statistically significant heterogeneity, hence, evidence was downgraded for inconsistency. Evidence was also downgraded for the limitations of the included studies and lower total sample size. Therefore, the quality of the evidence for all outcomes should be rated as being very low.
Table 3: Subgroup analysis results in meta-analysis
Heterogeneity |
Quality of the evidence(GRADE) |
|||||
Subgroup |
No. study |
WMD(95%CI) |
P value |
I2 (%) |
P |
|
Overall |
20 |
-1.23 [-1.65, -0.81] |
<0.001 |
93 |
<0.001 |
⨁◯◯◯1,2 VERY LOW |
BMI |
||||||
<25 |
6 |
-0.79 [-1.28, -0.30] |
<0.001 |
91 |
<0.001 |
⨁◯◯◯1,2 VERY LOW |
≥25 |
14 |
-1.48 [-2.16, -0.80] |
<0.001 |
94 |
<0.001 |
⨁◯◯◯1,2 VERY LOW |
Duration(months) |
||||||
<6 |
10 |
-0.94 [-1.41, -0.47] |
<0.001 |
87 |
<0.001 |
⨁◯◯◯1,2 VERY LOW |
≥6 |
10 |
-1.47 [-2.16, -0.78] |
<0.001 |
95 |
<0.001 |
⨁◯◯◯1,2 VERY LOW |
Dose(mg/day) |
||||||
<2000 |
14 |
-1.21 [-1.32, -1.09] |
<0.001 |
94 |
<0.001 |
⨁◯◯◯1,2 VERY LOW |
≥2000 |
6 |
-0.55 [-0.71, -0.40] |
<0.001 |
86 |
<0.001 |
⨁◯◯◯1,2 VERY LOW |
HOMA-IR ratio |
||||||
<0.735 |
4 |
-1.07 [-1.76, -0.38] |
<0.001 |
93 |
<0.001 |
⨁◯◯◯1,2 VERY LOW |
0.735-0.865 |
4 |
-0.49 [-0.72, -0.25] |
<0.001 |
7 |
0.360 |
⨁◯◯◯2 VERY LOW |
0.865-1.015 |
3 |
-1.06 [-1.86, -0.26] |
<0.001 |
23 |
0.270 |
⨁◯◯◯2 VERY LOW |
<1.015 |
4 |
-1.32 [-1.56, -1.08] |
<0.001 |
0 |
0.600 |
⨁◯◯◯2 VERY LOW |
NR |
5 |
-1.98 [-3.59, -0.36] |
0.020 |
98 |
<0.001 |
⨁◯◯◯1,2 VERY LOW |
T ratio |
||||||
<0.714 |
4 |
-1.19 [-1.67, -0.70] |
<0.001 |
40 |
0.170 |
⨁◯◯◯1,2 VERY LOW |
0.714-0.825 |
2 |
-1.85 [-2.09, -1.60] |
<0.001 |
99 |
<0.001 |
⨁◯◯◯1,2 VERY LOW |
0.825-0.886 |
3 |
-1.35 [-1.58, -1.11] |
<0.001 |
84 |
<0.001 |
⨁◯◯◯1,2 VERY LOW |
<0.886 |
4 |
-0.74 [-0.88, -0.60] |
<0.001 |
91 |
<0.001 |
⨁◯◯◯,2 VERY LOW |
NR |
7 |
-0.52 [-0.73, -0.31] |
<0.001 |
87 |
<0.001 |
⨁◯◯◯1,2 VERY LOW |
Abbreviations: WMD, Weighted Mean Difference; HOMA-IR, homeostasis model assessment of insulin resistance; T ratio, Total testosterone ratio; NR, no reported.
1Downgraded by 1 level for substantial heterogeneity (I2 statistic is greater than 40%)
2Downgraded by two levels for the limitations of the included studies and lower total sample size
Table 4: Univariate meta-regression analysis for the potential variables between studies
Covariates |
No. studies |
Coefficient |
Standard error |
t |
P |
95% CI |
BMI |
20 |
-0.794 |
0.575 |
-1.38 |
0.185 |
[-2.004,0.150] |
Duration |
20 |
-0.464 |
0.541 |
-0.86 |
0.402 |
[-1.600,0.673] |
Dose |
20 |
0.205 |
0.609 |
0.34 |
0.741 |
[-1.074,1.483] |
HOMA-IR ratio |
20 |
-0.243 |
0.171 |
-1.42 |
0.172 |
[-0.601,0.116] |
T ratio |
20 |
0.128 |
0.184 |
0.70 |
0.496 |
[-0.259,0.515] |
Quality score |
20 |
0.758 |
0.546 |
1.39 |
0.182 |
[-0.391,1.908] |
Discussion
In this meta-analysis, we investigated whether metformin decreased CRP levels in women with PCOS. Our results showed that in women with PCOS, CRP levels significantly decrease after metformin treatment, especially in obese women with PCOS. Interestingly, we observed a significant time effect of metformin treatment on CRP levels in women with PCOS, but not with a dose relationship. However, the quality of evidence is very low.
Decreased levels of CRP in women with PCOS after metformin treatment may be related to PCOS’ biochemical characteristics, such as obesity and IR. Obesity is a major factor associated with elevated CRP in individuals with the metabolic syndrome [30], and CRP decreases after weight loss in obese subjects [31]. Harborne et al. found that weight loss is a feature of metformin therapy in obese women with PCOS, with a dose relationship [32]. Therefore, our study found that CRP levels decrease more in obese patients. There is a significant correlation at the baseline between CRP and insulin response [33], and high levels of CRP are associated with hyperinsulinemia [34]. Thus, with the improvement to IR in women with PCOS after metformin treatment, the elevated levels of CRP decrease.
Metformin can also reduce the levels of total testosterone in women with PCOS [35]. Indeed, in this study, decreased levels of total testosterone after metformin treatment were found in most of the included studies (T ratio < 1, Table 2). Previous studies have demonstrated an inverse relationship between total testosterone and CRP [36, 37]. However, we observed CRP levels decreased in different categories of T ratio. Interestingly, the decreased levels of CRP were also found in the subgroup with a HOMA-IR ratio ≥ 1. In addition, we did not observed a dose effect of metformin on CRP levels; in contrast, CRP levels decreased more in the subgroup with a dose of < 2000mg/day than that of ≥ 2000mg/day. These results suggest that decreased CRP levels are a result of multiple factors in women with PCOS.
PCOS is a life-time heterogeneous endocrinopathy, and long-term management of this frequent disorder must consider all the consequences of the syndrome, including T2DM and cardiovascular events [38, 39]. Kong et al. [40] found that metformin therapy could increase serum adiponectin concentrations and decrease serum leptin levels in women with PCOS. A systematic review also indicated that serum interleukin-6 levels of PCOS patients may be influenced by metformin [41]. CRP is a classical marker of inflammation that has be shown in persons with increased or sustained elevated CRP levels over a 6-year period has an increased risk of incident diabetes, coronary heart disease, ischemic stroke, heart failure, and mortality [42], moreover, the greatest hazard reduction in vascular events are observed in participants who achieved hs-CRP concentrations less than 1 mg/L in a prospective study [43]. On the basis of this meta-analysis and previous work, metformin is clearly a drug that is beneficial for chronic low-grade inflammation in women with PCOS. Therefore, metformin administration offers new possibilities for preventing CVD in women with PCOS, considering the important role of CRP in CVD.
This meta-analysis has several limitations. First, we noticed that all the sample sizes in the included studies were small (n < 50), with some even less than 10. This is probably the main reason for significant heterogeneity in this meta-analysis because significant heterogeneity still existed after the subgroup analysis, and the meta-regression analysis also could not determine the source of heterogeneity. The conflicting results in the subgroup analysis also may be caused by the small sample sizes. Second, since significant heterogeneity was observed in this study, a funnel plot of the data was not applied, as this may be incorrectly interpreted when studies are heterogeneous [44]. Third, some of the included studies had missing data for HOMA-IR, which suggests a certain degree of systemic bias in the association between the decreased levels of CRP and IR status. In addition, most of the included studies focused on Caucasian populations. Therefore, potential publication bias should be noted, which may influence the reliability of conclusions, although a Begg’s funnel plot and an Egger’s test showed no publication bias. Finally, the quality of evidence was very low, therefore, large studies, especially randomized trials are still needed.
Despite the above considerations, our study has some advantages. We assessed heterogeneity using various statistical methods. The pooled results were not significantly changed using a sensitivity analysis and a Galbraith plot analysis. In particular, the heterogeneity decreased significantly in the Galbraith plot analysis.
In summary, this study suggests that metformin has the potential effects on CRP levels in women with PCOS. However, considering the very low quality of evidence for the analysis, the effect of metformin on CRP levels are still very uncertain, and large-scale randomized-controlled study is needed to ascertain the long-term effects of metformin in PCOS.
Materials and Methods
This meta-analysis was strictly conducted according to the PRISMA 2009 statement (preferred reporting items for systematic reviews and meta-analyses), including the search strategy, selection criteria, data extraction, and data analysis [45](Supplementary Table 1).
Search strategy
PubMed, Embase, Scopus and the Cochrane Library were systematically searched by two investigators (YC and ML) up to November 2016 to obtain eligible studies. The following search terms were used: polycystic ovary disease, PCOD, polycystic ovary syndrome, PCOS, hyperandrogenism, CRP, C-reactive protein, and metformin (S1 file) Articles in reference lists were also hand searched. Any divergence was resolved through consultation with a third reviewer.
Inclusion and exclusion criteria
Inclusion criteria included (1) studies in which women with PCOS were treated with metformin, (2) studies with diagnostic criteria for PCOS, and (3) studies that reported the CRP means and standard deviation (SD) before and after treatment with metformin in PCOS women.
Exclusion criteria included (1) studies with no diagnostic criteria; (2) studies conducted on patients with other diseases or with a combination of other types of drugs; (3) studies without CRP levels (and where this information was not available from the contacted authors); and (4) review articles, letters, case reports, editorials, and conference abstracts.
Data extraction
The following data were extracted by two investigators (YC and HD) from the included studies: the first author’s name, publication year, country, total sample size, diagnostic criteria for PCOS, clinical variables (age and BMI), metformin information (dose and duration of metformin treatment), CRP means and SD (before and after metformin treatment), IR and total testosterone levels (before and after metformin treatment), and the measurement method for CRP. The investigators were instructed to try to contact the author to get the original data by email if the literature did not provide sufficient data. In cases of a dispute, the two investigators were obliged to check their data again, and any discrepancy was resolved by all authors through consultation.
Quality assessment
The quality of the included studies in this meta-analysis was assessed according to the Newcastle-Ottawa Quality Assessment Scale (NOS) [46] , with some of the criteria modified (Table 1). Studies with an NOS score ≤ 7 were considered “Low” quality studies. “High” quality studies were defined as having a quality score 8. The maximum NOS score was 10. We assessed the quality of the evidence using the GRADE approach (http://gdt.guidelinedevelopment.org)
Statistical analysis
CRP and total testosterone levels in each study were extracted as mean difference ± SD. Homeostasis model assessment of insulin resistance (HOMA2-IR) values were used as measures of insulin sensitivity. The weighted mean differences (WMDs) and 95% confidence intervals (CIs) of the CRP levels were used as a measure of effect size, as the CRP levels in included studies were measured in the same units and the mean level difference was small across studies.
Heterogeneity was analyzed using Cochran’s Q and Higgins’s I-squared (I2) statistics. If I2 < 50% or PQ ≥ 0.1, there is no significant amount of heterogeneity between studies and therefore, a fixed-effects model was conducted using the Mantel-Haenszel method. Otherwise, a random-effects model (the DerSimonian and Laird method) was used. If significant heterogeneity was observed, a subsequent subgroup analysis was carried out according to BMI, metformin dose and duration, HOMA2-IR ratio, and total testosterone ratio (T ratio). Univariate meta-regression analyses were further performed to investigate the source of heterogeneity. Covariates with values of P < 0.05 were considered the main sources of heterogeneity; however, variables that were significant at the 0.1 level were entered into the multivariable. Galbraith plot analysis was used to find the outliers that might cause the heterogeneity.
Sensitivity analysis was performed by omitting the studies one by one and recalculating the pooled WMD. Begg’s test and Egger’s test were performed to evaluate the potential publication bias.
All P values were two-sided, and a Pvalue < 0.05 was considered statistically significant. A meta-analysis was conducted using Review Manager (version 5.3; Oxford, UK: the Cochrane Collaboration) and STATA software (version 12.0; Stata Corporation, College Station, Texas, USA).
Acknowledgments
We thank scribendi.com for professional language editing. This work was supported by Hunan Provincial Department of Finance (NO XiangCaiQIZhi {2016} 62).
Conflicts of interest
The authors have declared that no competing interests exist.
References
1. ESHRE TR, Group A-SPCW. Revised 2003 consensus on diagnostic criteria and long-term health risks related to polycystic ovary syndrome. Fertil Steril. 2004; 81:19-25.
2. Zawadzki J, Dunaif A. Diagnostic criteria for polycystic ovary syndrome: towards a rational approach. Polycystic ovary syndrome Boston: Blackwell Scientific. 1992:377-384.
3. Azziz R, Carmina E, Dewailly D, Diamanti-Kandarakis E, Escobar-Morreale HF, Futterweit W, Janssen OE, Legro RS, Norman RJ, Taylor AE, Witchel SF. The Androgen Excess and PCOS Society criteria for the polycystic ovary syndrome: the complete task force report. Fertility and sterility. 2009; 91:456-488.
4. Glueck CJ, Dharashivkar S, Wang P, Zhu B, Gartside PS, Tracy T, Sieve L. Obesity and extreme obesity, manifest by ages 20-24 years, continuing through 32-41 years in women, should alert physicians to the diagnostic likelihood of polycystic ovary syndrome as a reversible underlying endocrinopathy. European journal of obstetrics, gynecology, and reproductive biology. 2005; 122:206-212.
5. Stepto NK, Cassar S, Joham AE, Hutchison SK, Harrison CL, Goldstein RF, Teede HJ. Women with polycystic ovary syndrome have intrinsic insulin resistance on euglycaemic-hyperinsulaemic clamp. Human reproduction (Oxford, England). 2013; 28:777-784.
6. El Hayek S, Bitar L, Hamdar LH, Mirza FG, Daoud G. Poly Cystic Ovarian Syndrome: An Updated Overview. Frontiers in physiology. 2016; 7:124.
7. Tarkun I, Arslan BC, Canturk Z, Turemen E, Sahin T, Duman C. Endothelial dysfunction in young women with polycystic ovary syndrome: relationship with insulin resistance and low-grade chronic inflammation. The Journal of clinical endocrinology and metabolism. 2004; 89:5592-5596.
8. Ridker PM, Hennekens CH, Buring JE, Rifai N. C-reactive protein and other markers of inflammation in the prediction of cardiovascular disease in women. The New England journal of medicine. 2000; 342:836-843.
9. Odegaard AO, Jacobs DR Jr, Sanchez OA, Goff DC Jr, Reiner AP, Gross MD. Oxidative stress, inflammation, endothelial dysfunction and incidence of type 2 diabetes. Cardiovascular diabetology. 2016; 15:51.
10. Repaci A, Gambineri A, Pasquali R. The role of low-grade inflammation in the polycystic ovary syndrome. Molecular and cellular endocrinology. 2011; 335:30-41.
11. Toulis KA, Goulis DG, Mintziori G, Kintiraki E, Eukarpidis E, Mouratoglou SA, Pavlaki A, Stergianos S, Poulasouchidou M, Tzellos TG, Makedos A, Chourdakis M, Tarlatzis BC. Meta-analysis of cardiovascular disease risk markers in women with polycystic ovary syndrome. Hum Reprod Update. 2011; 17:741-760.
12. Celik O, Acbay O. Effects of metformin plus rosuvastatin on hyperandrogenism in polycystic ovary syndrome patients with hyperlipidemia and impaired glucose tolerance. J Endocrinol Invest. 2012; 35:905-910.
13. Diamanti-Kandarakis E, Kouli C, Tsianateli T, Bergiele A. Therapeutic effects of metformin on insulin resistance and hyperandrogenism in polycystic ovary syndrome. European Journal of Endocrinology. 1998; 138:269-274.
14. Kolodziejczyk B, Duleba AJ, Spaczynski RZ, Pawelczyk L. Metformin therapy decreases hyperandrogenism and hyperinsulinemia in women with polycystic ovary syndrome. Fertil Steril. 2000; 73:1149-1154.
15. Saisho Y. Metformin, Inflammation: Its Potential Beyond Glucose-lowering Effect. Endocr Metab Immune Disord-Drug Targets. 2015; 15:196-205.
16. Banaszewska B, Pawelczyk L, Spaczynski RZ, Duleba AJ. Comparison of simvastatin and metformin in treatment of polycystic ovary syndrome: Prospective randomized trial. Journal of Clinical Endocrinology and Metabolism. 2009; 94:4938-4945.
17. Banaszewska B, Pawelczyk L, Spaczynski RZ, Duleba AJ. Effects of simvastatin and metformin on polycystic ovary syndrome after six months of treatment. Journal of Clinical Endocrinology and Metabolism. 2011; 96:3493-3501.
18. Cetinkalp S, Karadeniz M, Erdogan M, Ozgen G, Saygl F, Ylmaz C. The effects of rosiglitazone, metformin, and estradiol-cyproterone acetate on lean patients with polycystic ovary syndrome. Endocrinologist. 2009; 19:94-97.
19. Diamanti-Kandarakis E, Paterakis T, Alexandraki K, Piperi C, Aessopos A, Katsikis I, Katsilambros N, Kreatsas G, Panidis D. Indices of low-grade chronic inflammation in polycystic ovary syndrome and the beneficial effect of metformin. Human Reproduction. 2006; 21:1426-1431.
20. Mohiyiddeen L, Watson AJ, Apostolopoulos NV, Berry R, Alexandraki KI, Jude EB. Effects of low-dose metformin and rosiglitazone on biochemical, clinical, metabolic and biophysical outcomes in polycystic ovary syndrome. Journal of Obstetrics and Gynaecology. 2013; 33:165-170.
21. Mohlig M, Spranger J, Osterhoff M, Ristow M, Pfeiffer AF, Schill T, Schlosser HW, Brabant G, Schofl C. The polycystic ovary syndrome per se is not associated with increased chronic inflammation. European journal of endocrinology / European Federation of Endocrine Societies. 2004; 150:525-532.
22. Morin-Papunen L, Rautio K, Ruokonen A, Hedberg P, Puukka M, Tapanainen JS. Metformin Reduces Serum C-Reactive Protein Levels in Women with Polycystic Ovary Syndrome. Journal of Clinical Endocrinology and Metabolism. 2003; 88:4649-4654.
23. Orio F, Manguso F, Di Biase S, Falbo A, Giallauria F, Labella D, Tolino A, Lombardi G, Colao A, Palomba S. Metformin administration improves leukocyte count in women with polycystic ovary syndrome: A 6-month prospective study. European Journal of Endocrinology, Supplement. 2007; 157:69-73.
24. Velija-Asimi Z. C-reactive protein in obese PCOS women and the effect of metformin therapy. Bosnian journal of basic medical sciences / Udruzenje basicnih mediciniskih znanosti = Association of Basic Medical Sciences. 2007; 7:90-93.
25. Behradmanesh S, Ranjbar Omrani GH, Ghazanfarpour F, Baradaran A. Effect of metformin on serum ferritin level in women with polycystic ovary syndrome. Iran Red Crescent Med J. 2011; 13:487-492.
26. Esfahanian F, Zamani MM, Heshmat R, Moini Nia F. Effect of Metformin compared with hypocaloric diet on serum C-reactive protein level and insulin resistance in obese and overweight women with polycystic ovary syndrome. Journal of Obstetrics and Gynaecology Research. 2013; 39:806-813.
27. Heutling D, Schulz H, Nickel I, Kleinstein J, Kaltwasser P, Westphal S, Mittermayer F, Wolzt M, Krzyzanowska K, Randeva H, Schernthaner G, Lehnert H. Asymmetrical dimethylarginine, inflammatory and metabolic parameters in women with polycystic ovary syndrome before and after metformin treatment. Journal of Clinical Endocrinology and Metabolism. 2008; 93:82-90.
28. Hoeger K, Davidson K, Kochman L, Cherry T, Kopin L, Guzick DS. The impact of metformin, oral contraceptives, and lifestyle modification on polycystic ovary syndrome in obese adolescent women in two randomized, placebo-controlled clinical trials. Journal of Clinical Endocrinology and Metabolism. 2008; 93:4299-4306.
29. Jakubowska J, Bohdanowicz-Pawlak A, Milewicz A, Szymczak J, Bednarek-Tupikowska G, Demissie M. Plasma cytokines in obese women with polycystic ovary syndrome, before and after metformin treatment. Gynecological Endocrinology. 2008; 24:378-384.
30. Aronson D, Bartha P, Zinder O, Kerner A, Markiewicz W, Avizohar O, Brook GJ, Levy Y. Obesity is the major determinant of elevated C-reactive protein in subjects with the metabolic syndrome. Int J Obes. 2004; 28:674-679.
31. Rosc D, Adamczyk P, Boinska J, Szafkowski R, Ponikowska I, Stankowska K, Goralczyk B, Ruszkowska-Ciastek B. CRP, but not TNF-alpha or IL-6, decreases after weight loss in patients with morbid obesity exposed to intensive weight reduction and balneological treatment. J Zhejiang Univ-SCI B. 2015; 16:404-411.
32. Harborne LR, Sattar N, Norman JE, Fleming R. Metformin and weight loss in obese women with polycystic ovary syndrome: Comparison of doses. J Clin Endocrinol Metab. 2005; 90:4593-4598.
33. McLaughlin T, Abbasi F, Lamendola C, Liang L, Reaven G, Schaaf P, Reaven P. Differentiation between obesity and insulin resistance in the association with C-reactive protein. Circulation. 2002; 106:2908-2912.
34. Anan F, Takahashi N, Nakagawa M, Ooie T, Saikawa T, Yoshimatsu H. High-sensitivity C-reactive protein is associated with insulin resistance and cardiovascular autonomic dysfunction in type 2 diabetic patients. Metab-Clin Exp. 2005; 54:552-558.
35. Kolodziejczyk B, Duleba AJ, Spaczynski RZ, Pawelczyk L. Metformin therapy decreases hyperandrogenism and hyperinsulinemia in women with polycystic ovary syndrome. Fertil Steril. 2000; 73:1149-1154.
36. Joffe HV, Ridker PM, Manson JE, Cook NR, Buring JE, Rexrode KM. Sex hormone-binding globulin and serum testosterone are inversely associated with C-reactive protein levels in postmenopausal women at high risk for cardiovascular disease. Ann Epidemiol. 2006; 16:105-112.
37. Bhatia V, Chaudhuri A, Tomar R, Dhindsa S, Ghanim H, Dandona P. Low testosterone and high C-reactive protein concentrations predict low hematocrit in type 2 diabetes. Diabetes Care. 2006; 29:2289-2294.
38. Norman RJ, Dewailly D, Legro RS, Hickey TE. Polycystic ovary syndrome. The Lancet. 2007; 370:685-697.
39. Murri M, Luque-Ramirez M, Insenser M, Ojeda-Ojeda M, Escobar-Morreale HF. Circulating markers of oxidative stress and polycystic ovary syndrome (PCOS): a systematic review and meta-analysis. Human reproduction update. 2013; 19:268-288.
40. Kong W, Niu X, Zeng T, Lu M, Chen L. Impact of Treatment with Metformin on Adipocytokines in Patients with Polycystic Ovary Syndrome: A Meta-Analysis. PloS one. 2015; 10:e0140565.
41. Xu X, Du C, Zheng Q, Peng L, Sun Y. Effect of metformin on serum interleukin-6 levels in polycystic ovary syndrome: a systematic review. BMC women’s health. 2014; 14:93.
42. Parrinello CM, Lutsey PL, Ballantyne CM, Folsom AR, Pankow JS, Selvin E. Six-year change in high-sensitivity C-reactive protein and risk of diabetes, cardiovascular disease, and mortality. Am Heart J. 2015; 170:380-U247.
43. Ridker PM, Danielson E, Fonseca FA, Genest J, Gotto AM Jr, Kastelein JJ, Koenig W, Libby P, Lorenzatti AJ, Macfadyen JG, Nordestgaard BG, Shepherd J, Willerson JT, et al. Reduction in C-reactive protein and LDL cholesterol and cardiovascular event rates after initiation of rosuvastatin: a prospective study of the JUPITER trial. Lancet (London, England). 2009; 373:1175-1182.
44. Terrin N, Schmid CH, Lau J, Olkin I. Adjusting for publication bias in the presence of heterogeneity. Statistics in medicine. 2003; 22:2113-2126.
45. Moher D, Liberati A, Tetzlaff J, Altman DG. Preferred reporting items for systematic reviews and meta-analyses: the PRISMA statement. BMJ (Clinical research ed). 2009; 339:b2535.
46. Wells G, Shea B, O’connell D, Peterson J, Welch V, Losos M, Tugwell P. (2000). The Newcastle-Ottawa Scale (NOS) for assessing the quality of nonrandomised studies in meta-analyses.