
INTRODUCTION
Biliary tract cancer is the 10th most common cancer in the United States, and its mortality ranks 5th among all cancers [1]. The incidence of biliary tract cancer is higher in Eastern than Western populations, and it is the 9th most common cancer in Korea [2]. The actual 5-year survival rate for bile duct cancer after curative resection ranges from 28 to 30.1% [3, 4]. Radical resection of the tumor with a gross and microscopic negative resection margin is essential for long-term survival. However, surgical candidates are few because of difficulties in early diagnosis caused by asymptomatic manifestation, a lack of sensitive biomarkers, and the cancer’s aggressiveness. In addition, treatment modalities for bile duct cancer are limited, because the cancer is refractory to chemotherapy and radiation treatment. Therefore, discovery of diagnostic, therapeutic, and prognostic biomarkers for biliary tract cancer is important.
Recently, there have been marked advances in biomarkers for biliary tract cancers [5]. Diagnostic markers as p38 [6], MMP [7], and miR-21 [8], therapeutic markers such as Erb-1/EGFR [9], VEGF [10], ERKs [11], PI3K [12], mTOR [13], and SMAD4 [14], and prognostic markers such as Erb-B3/Her3 [15], PTEN [16], CA19-9 [17], SMAD4 [18], IDH [19], miR-26a [20], and miR-192 [21] have all been suggested. However, the number of study subjects was relatively small, and some studies used in vivo experiments. Moreover, most of those studies were performed with a Western population. Therefore the purpose of this study was to determine prognostic markers for bile duct cancer, especially in Korean patients. To our knowledge, this study is the first conducted in Eastern bile duct cancer patients with a large number of study subjects.
RESULTS
Clinicopathological characteristics of the study subjects
The clinicopathological characteristics of the 79 bile duct cancer patients are listed in Table 1. The mean age of the study subjects was 65.4 years and the male to female ratio was 1.82 to 1. Jaundice was identified in 32 (40.5%) patients. Sixty-three patients (79.7%) had extrahepatic bile duct cancer, and curative resection was performed in 73 patients (92.4%). Tumors were confined to the bile duct in 14 patients (17.7%), lymph node metastasis was identified in 31 patients (39.2%), and perineural invasion was seen in 56 (70.9%) patients. The median follow-up with the patients was 33.3 months. Overall 5-year survival rate of all patients was 45.5%, and 57.2% after R0 resection. After R0 resection, 5-year survival rate was 78.6% for those with tumors limited to bile duct, and 51.8% for those with tumors extending beyond bile duct (p=0.067). Node negative patients had higher 5-year survival rate compared with node positive patients (70.1% vs. 0%, p=0.001). Perineural invasion negative patients had higher 5-year survival rate compared with perineural invasion positive patients (85.0% vs. 43.4%, p=0.004).
Table 1: Demographics and pathologic data
Variables |
N=79 |
|---|---|
Age (years, mean ± SD) |
65.4±7.7 |
Gender (male: female) |
51:28 |
Location (Extrahepatic: Intrahepatic) |
63 (79.7%): 16 (20.3%) |
Location of extrahepatic bile duct cancer (Proximal: mid- to- distal) |
28 (44.4%): 35 (55.6%) |
Operative methods (Hepatectomy with BDR: BDR: PD) |
30 (38.0%): 19 (24.1%): 30 (38.0%) |
Curative resection |
73 (92.4%) |
Recurrence |
37 (50.7%) |
Follow-up duration (months, median, range) |
33.3 (0.8-76.2) |
Gross type (papillary: nodular: flat) |
14 (17.7%): 41 (51.9%): 24 (30.4%) |
Histologic grade (WD: MD: PD) |
12 (15.2%): 51 (64.6%): 10 (12.7%) |
Depth of invasion (confined to bile duct: beyond bile duct) |
14 (17.7%): 65 (82.3%) |
Lymph node metastasis |
31 (39.2%) |
Perineural invasion |
56 (70.9%) |
Abbreviations: BDR: bile duct resection, PD: pancreaticoduodenectomy, WD: well-differentiated, MD: moderate- differentiated, PD: poorly-differentiated.
Differentially expressed gene analysis
Comparing cancer and normal bile duct tissue, 29091 differentially expressed gene (DEGs) were identified with adjusted p value (FDR correction) <0.05. According to T stage, we found 304 significant DEGs, of which 113 genes had a log2 ratio >0. The top 50 genes are listed in Supplementary Table 1. According to lymph node metastasis, we found no significant DEG with an adjusted p value <0.05. 2604 DEGs were identified with a p value <0.05, and 1262 genes had a positive coefficient (Supplementary Table 2). According to perineural invasion, 7 significant DEGs were identified and 5 of them had a positive coefficient (Supplementary Table 3).
Candidate genes associated with advanced bile duct cancer
To find genes positively associated with increased T, N stage and positive perineural invasion, we performed multivariate analysis. Because we found no significant DEG for lymph node metastasis when applying adjusted p-value criteria, we included 157 genes with unadjusted p-value <0.05 in both T, N stage and perineural invasion in this analysis. The top 50 genes are listed in Table 2. Among the 477 genes we included in this analysis, we identified 199 significant DEGs, of which 29 had a positive coefficient with cancer tissue, advanced T, N stage, and perineural invasion (Figure 1).
Table 2: Top 50 genes with positive coefficient toward advanced T stage, N stage, and perineural invasion
log2.ratio of |
T stage |
log2ratio |
N stage |
log2ratio of |
PNI |
log2ratio of |
Multiple |
Adjusted |
Gene symbol |
|---|---|---|---|---|---|---|---|---|---|
1.405649235 |
0.005021 |
0.669221179 |
0.049282 |
0.414807777 |
0.0066929 |
0.577734589 |
8.67E-12 |
1.85E-09 |
CELSR1 |
0.902487966 |
0.017299 |
0.408004864 |
0.048754 |
0.274492969 |
0.0062699 |
0.388747711 |
8.01E-10 |
5.33E-08 |
PLXNA1 |
1.336755747 |
0.005524 |
0.878416145 |
0.010444 |
0.71439579 |
0.0018927 |
0.883976089 |
6.28E-08 |
1.46E-06 |
AHNAK2 |
0.774103937 |
0.000954 |
0.687681207 |
0.008804 |
0.45790676 |
0.0019398 |
0.569426772 |
5.74E-06 |
4.81E-05 |
LAMA5 |
0.568306702 |
0.015232 |
0.381576062 |
0.006886 |
0.351554572 |
0.0458663 |
0.278862871 |
7.42E-06 |
5.92E-05 |
RNF157-AS1 |
1.230802084 |
0.000229 |
1.183765995 |
0.005831 |
0.630328305 |
0.0271156 |
0.588247469 |
1.04E-05 |
7.72E-05 |
LOC728643 |
1.168560622 |
0.0305 |
0.781214914 |
0.00944 |
0.751484198 |
0.0016675 |
0.976805933 |
2.13E-05 |
0.000136725 |
TRIM29 |
1.593130487 |
0.042005 |
1.075298616 |
0.044852 |
0.915541975 |
0.0030054 |
1.328602148 |
4.05E-05 |
0.000229513 |
--- |
1.755681238 |
0.000359 |
1.952839198 |
0.006969 |
1.159846203 |
0.0261894 |
1.083681984 |
4.41E-05 |
0.000246188 |
CP |
1.256035134 |
0.000343 |
1.382233559 |
0.035821 |
0.723628435 |
0.0001428 |
1.271430559 |
4.65E-05 |
0.000256884 |
CACNG4 |
1.035723885 |
0.038296 |
0.680393235 |
0.000894 |
0.891679109 |
0.0103758 |
0.719665669 |
6.05E-05 |
0.000319024 |
FOXJ1 |
1.055140967 |
0.000506 |
1.21563373 |
0.000779 |
0.910845838 |
0.00771 |
0.80855569 |
0.000163 |
0.000718317 |
ANXA8 |
0.38719036 |
0.003896 |
0.381130034 |
0.046294 |
0.235723632 |
0.0367647 |
0.267271458 |
0.000187 |
0.000805512 |
--- |
1.422747031 |
0.001163 |
1.680970054 |
0.011585 |
1.149656434 |
0.0004231 |
1.636415885 |
0.000259 |
0.001056886 |
SCEL |
0.741694744 |
0.041854 |
0.500599655 |
0.017604 |
0.472999653 |
0.0090105 |
0.526894352 |
0.000303 |
0.001201835 |
IL20RB |
1.048336388 |
0.000656 |
1.256426426 |
0.00088 |
0.948583195 |
0.0102444 |
0.816245506 |
0.000367 |
0.001407568 |
ANXA8L1 |
0.439815207 |
0.007863 |
0.420094066 |
0.015973 |
0.298972856 |
0.0468603 |
0.276542029 |
0.000405 |
0.001524813 |
PACSIN3 |
0.644644964 |
0.031368 |
0.510770319 |
0.011303 |
0.457911463 |
0.0238407 |
0.477635525 |
0.000432 |
0.001607237 |
NUP210 |
0.41460036 |
0.03709 |
0.311652312 |
0.016663 |
0.291643291 |
0.000777 |
0.41712347 |
0.000651 |
0.002251733 |
RARG |
0.459884319 |
0.004722 |
0.493286574 |
0.045051 |
0.27407048 |
0.0322201 |
0.323656785 |
0.000967 |
0.003135081 |
MTSS1L |
0.752843756 |
0.001219 |
0.926599211 |
0.00119 |
0.702989327 |
0.0191047 |
0.575784542 |
0.000974 |
0.003154055 |
ANXA8L2 |
0.326934803 |
0.006896 |
0.339485505 |
0.023013 |
0.24777875 |
0.0025399 |
0.325922534 |
0.001317 |
0.004059408 |
KCTD15 |
0.327674175 |
0.021866 |
0.313482341 |
0.019959 |
0.25034948 |
0.036247 |
0.266040443 |
0.001513 |
0.004559996 |
ZNF550 |
0.638509872 |
0.01561 |
0.628376088 |
0.027736 |
0.496854056 |
0.0167853 |
0.527506439 |
0.001932 |
0.005596862 |
03-Sep |
0.641215401 |
0.002851 |
0.801735895 |
0.018654 |
0.562292769 |
0.0076319 |
0.66523785 |
0.002029 |
0.005824709 |
IGFBP3 |
0.499649263 |
0.042891 |
0.470272503 |
0.016633 |
0.459860135 |
0.0013724 |
0.619993877 |
0.005756 |
0.014050979 |
NMU |
0.401188962 |
0.03306 |
0.405520149 |
0.026384 |
0.332817538 |
0.0409198 |
0.34779977 |
0.00705 |
0.016707122 |
RPGRIP1L |
1.038620022 |
0.001477 |
1.622430348 |
0.01432 |
1.04114733 |
0.0001852 |
1.62939924 |
0.009159 |
0.020847277 |
MUC16 |
0.565775908 |
0.01136 |
0.736079957 |
0.019033 |
0.5676243 |
0.0199131 |
0.594558424 |
0.012178 |
0.026551104 |
--- |
0.375493033 |
0.042879 |
0.410540932 |
0.031223 |
0.373539325 |
0.001184 |
0.554925038 |
0.017506 |
0.036142137 |
SFTA2 |
0.375493033 |
0.042879 |
0.410540932 |
0.031223 |
0.373539325 |
0.001184 |
0.554925038 |
0.017506 |
0.036142137 |
SFTA2 |
0.187599817 |
0.024383 |
0.226129552 |
0.024041 |
0.187735793 |
0.0367099 |
0.179514001 |
0.019273 |
0.039199952 |
--- |
0.344763407 |
0.048564 |
0.379079767 |
0.027571 |
0.359760333 |
0.000962 |
0.530485462 |
0.021143 |
0.042354375 |
SFTA2 |
0.344763407 |
0.048564 |
0.379079767 |
0.027571 |
0.359760333 |
0.000962 |
0.530485462 |
0.021143 |
0.042354375 |
SFTA2 |
0.276170322 |
0.005814 |
0.433065399 |
0.008952 |
0.325178256 |
0.02379 |
0.303523881 |
0.02891 |
0.055235829 |
OBSL1 |
0.311893948 |
0.016383 |
0.456822732 |
0.02489 |
0.351506827 |
6.82E-05 |
0.62551085 |
0.029778 |
0.056617243 |
DUSP7 |
0.29107782 |
7.23E-05 |
0.680455719 |
0.031919 |
0.356012678 |
0.0002128 |
0.580257197 |
0.034151 |
0.063494817 |
SLC25A12 |
0.763158464 |
0.021464 |
1.089699767 |
0.000956 |
1.272277802 |
0.0286497 |
0.863378185 |
0.034747 |
0.064421874 |
CYP24A1 |
0.463353083 |
0.000208 |
1.071169232 |
0.002294 |
0.763081908 |
0.0003075 |
0.938569956 |
0.037331 |
0.068426105 |
PLAG1 |
0.235225211 |
0.006514 |
0.412864124 |
0.004589 |
0.359195411 |
0.0184164 |
0.333983417 |
0.037393 |
0.068520091 |
TBL1X |
0.415837064 |
0.020375 |
0.618452648 |
0.003429 |
0.642991749 |
0.0031283 |
0.661698671 |
0.038076 |
0.069551285 |
TP63 |
0.36489978 |
3.79E-05 |
0.952535143 |
0.037331 |
0.445880795 |
0.000191 |
0.781545771 |
0.04198 |
0.075557211 |
PTPRU |
0.221020043 |
0.001706 |
0.490176098 |
0.007407 |
0.367678885 |
0.0031479 |
0.422636582 |
0.064293 |
0.108164516 |
TMEM194B |
0.211173621 |
4.11E-05 |
0.598084608 |
0.007149 |
0.316272465 |
0.0025179 |
0.417098103 |
0.067198 |
0.112310859 |
ZNF772 |
0.244788935 |
0.007511 |
0.460172837 |
0.049158 |
0.291772733 |
0.0001663 |
0.540728636 |
0.068464 |
0.114089313 |
CYP27C1 |
0.196298462 |
0.046793 |
0.290292197 |
0.034977 |
0.247751009 |
0.0459685 |
0.264254519 |
0.073753 |
0.121551209 |
ZNF211 |
0.189809559 |
2.48E-06 |
0.65798624 |
0.037054 |
0.257415442 |
0.000286 |
0.467404599 |
0.092093 |
0.146412737 |
SRGAP2B |
0.46529506 |
0.013098 |
0.919444033 |
0.001183 |
0.98387549 |
0.0054371 |
0.850979956 |
0.10161 |
0.159071083 |
DSC3 |
0.336275552 |
0.048061 |
0.513851773 |
0.02283 |
0.482223223 |
0.0287236 |
0.459517938 |
0.111838 |
0.172326235 |
KRT4 |
0.432728625 |
0.043834 |
0.730488208 |
0.015057 |
0.717167303 |
0.0035367 |
0.883170907 |
0.116773 |
0.178647079 |
TRPV4 |
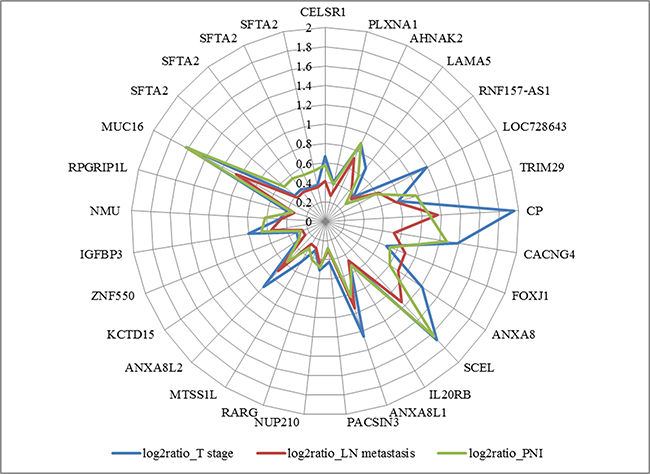
Figure 1: Diagram of positive coefficient of 29 genes with cancer to normal bile duct log2ratio >0, adjusted p-value <0.05.
A search of the PANTHER database showed that 23 of those genes were associated with molecular functions, biological processes, cellular components, protein classes, and pathways. Ten of those genes (43.5%) had a binding molecular function and 6 (26.1%) had receptor activity. According to biological process, 10 genes (43.5%) were involved in cellular processes, 9 (39.1%) in metabolic processes, and 7 (30.4%) in biological regulation. Among them, we identified top 3 candidate genes with a log2 ratio >1 for advanced T, N stage and perineural invasion (Table 3).
Table 3: Top 3 genes with positive coefficient >1, toward advanced T stage, N stage, and perineural invasion after multiple linear regression
log2- |
T stage |
log2-ratio |
N stage |
log2-ratio |
PNI |
log2-ratio of |
Multiple |
Adjusted |
Gene symbol |
|---|---|---|---|---|---|---|---|---|---|
1.755681 |
0.000359 |
1.952839 |
0.006969 |
1.159846 |
0.026189 |
1.083682 |
4.41E-05 |
0.000246 |
CP |
1.422747 |
0.001163 |
1.68097 |
0.011585 |
1.149656 |
0.000423 |
1.636416 |
0.000259 |
0.001057 |
SCEL |
1.03862 |
0.001477 |
1.62243 |
0.01432 |
1.041147 |
0.000185 |
1.629399 |
0.009159 |
0.020847 |
MUC16 |
Immunohistochemical analysis of expression
Immunohistochemical staining of tumor samples for candidate genes associated with ceruloplasmin was weakly positive in 16 samples (20.3%), and strongly positive in 4 (5.1%, Figure 2). Ceruloplasmin was overexpressed in patients with jaundice (n=4, 75.0% vs. 38.7%, p=0.298), extrahepatic bile duct cancer (n=4, 6.3% vs. 0, p=0.577), tumors invading beyond the bile duct (n=4, 6.2% vs. 0, p>0.999), and perineural invasion (n=4, 7.1% vs. 0, p=0.316, Table 4). Patients with strong ceruloplasmin expression tended to have shorter median overall survival than those with no or weak overexpression (median survival 27.5 vs. 46.1 months, p=0.307, Figure 3).
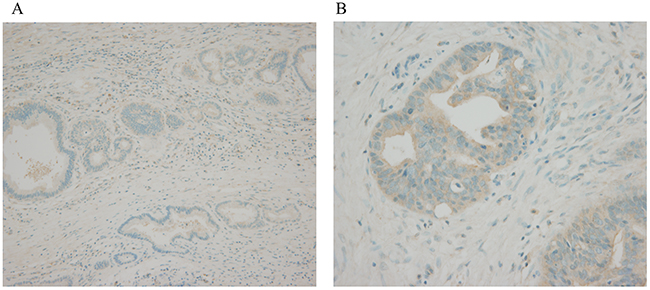
Figure 2: Immunohistochemical examination of bile duct cancer tissue. (A) normal bile duct, no expression, x100 (B) tumor tissue, strong expression, x400
Table 4: Clinical characteristics according to ceruloplasmin expression
No or weak ceruloplasmin |
Strong ceruloplasmin |
p-value |
|
|---|---|---|---|
Tumor location |
0577 |
||
Intrahepatic bile duct |
59 (78.7%) |
4 (100%) |
|
Extrahepatic bile duct |
16 (21.3%) |
0 |
|
T stage |
>0.999 |
||
Confined to bile duct |
14 (18.7%) |
0 |
|
Beyond bile duct |
61 (81.3%) |
4 (100%) |
|
N stage |
0.627 |
||
N (-) |
37 (55.2%) |
3 (75.0%) |
|
N (+) |
30 (44.8%) |
1 (25.0%) |
|
Perineural invasion |
0.316 |
||
Negative |
23 (30.7%) |
0 |
|
Positive |
52 (69.3%) |
4 (100%) |
|
Curative resection |
>0.999 |
||
Yes |
69 (92.0%) |
4 (100%) |
|
No |
6 (8.0%) |
0 |
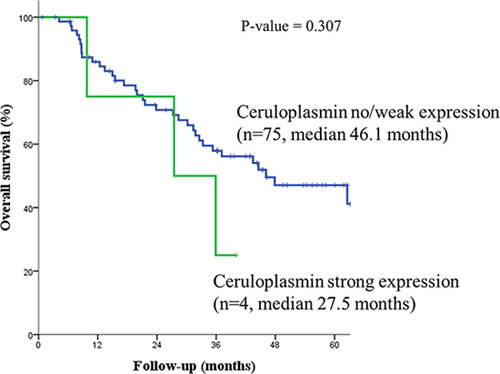
Figure 3: Patients with strong ceruloplasmin expression had shorter median overall survival than those with no or weak overexpression.
DISCUSSION
Depth of tumor invasion into the bile duct, lymph node metastasis, perineural invasion, histologic differentiation, resection margin status, and tumor markers are all well-recognized prognostic factors for bile duct cancer [4]. However, predicting patient prognosis using those factors is inadequate, more effective prognostic biomarkers are needed. In this study, we drew a prognostic marker for bile duct cancer in Korean patients using microarray experiment with a robust statistical method. We used a statistical analysis to find genes positively associated with 3 well-recognized prognostic factors, T, N stage and perineural invasion. As a result, we found 3 novel candidate genes (CP, SCEL, and MUC16), having positive coefficients with a log2 ratio >1 for advanced T, N stage and perineural invasion cancer tissue. The authors selected ceruloplasmin for tissue expression analysis. It showed a positive correlation with advanced disease and poor prognosis.
Ceruloplasmin is a multicopper oxidase with functions including copper transport, ferroxidase activity, superoxide dismutase activity, and amine oxidase activity [22]. A low level of serum ceruloplasmin indicates Wilson disease [23], or aceruloplasminemia [24] and a high level of serum ceruloplasmin is related to copper toxicity, oral contraceptive pill use [25], inflammatory diseases [22], angina [26], Alzheimer’s disease [27], schizophrenia [28], and obsessive-compulsive disorder [29].
Ceruloplasmin has also been reported to be related to several types of cancers. Elevated glycoconjugates could be the result of an inflammatory reaction associated with neoplasia, because serum ceruloplasmin which is an acute phase reactant, is also increased in those patients [30]. Ceruloplasmin was suggested as a promising marker for the patients with pancreatic ductal adenocarcinoma because it was highly secreted by PNAC1 cancer stem-like cells [31], especially those negative for CA19-9. [32] Inhibition of ceruloplasmin has been demonstrated to suppress tumor growth and angiogenesis in breast cancer [33]. In breast cancer, elevated ceruloplasmin has been found in patients with metastatic disease. In those patients, the ceruloplasmin level fell in response to treatment, and those with elevated post-mastectomy ceruloplasmin levels had a higher rate of recurrence [34]. Ceruloplasmin was also suggested to be a potentially reliable biomarker for the detection of hepatocellular carcinoma [35], especially in Hepatitis C virus-infected alcoholic patients [36]. A rise in serum ceruloplasmin was observed in cervical cancer, and that rise was higher in later stages of cancer than in early stages [30, 37]. Serum ceruloplasmin could complement biochemical screening in prostate carcinoma, [38] especially in cases without elevated serum PSA. [39] Ceruloplasmin levels were significantly increased in ovarian cancer patients compared with controls. [40] The ceruloplasmin promoter demonstrated significantly higher activities in ovarian cancers compared with normal organs [41], especially in patients with intrinsic chemoresistance [42]. Ceruloplasmin produced higher signals in the ascites fluids of epithelial ovarian cancer patients [43]. Ceruloplasmin was also suggested as a plasma biomarker of hypopharyngeal squamous cell carcinoma [44]. In this study, we found that ceruloplasmin was overexpressed 3.38 fold in tumor tissue compared with normal bile duct tissue. Moreover, strong expression of ceruloplasmin was observed in tumors with advanced T stage and perineural invasion.
On the other hand, a relation has been reported between bile duct obstruction and ceruloplasmin. In a rat model, common bile duct ligation brought about a rapid increase in serum ceruloplasmin concentration. [45] Primary biliary cirrhosis patients showed increased ceruloplasmin activity in the serum [46]. In this study, we observed strong expression of ceruloplasmin in extrahepatic bile duct cancer with advanced T stage and perineural invasion, suggesting a correlation with the severity of bile duct obstruction.
There are several limitations in this study. First, we did not measure the serum level of ceruloplasmin, because our study was retrospective. Second, we did not study the contribution of copper metabolism to cancer development and its progression, which needs to be evaluated in future prospective studies. In addition, the expression rate of ceruloplasmin in biliary epithelium had not previously been documented. In this study, the overall expression rate was 25.4% and only 5.1% showed strong expression, which left a relatively small number of patients for analysis. Furthermore, there was limited number of patient with ceruloplasmin strong expression without jaundice, therefore further analysis concerning the potential prognostic value of ceruloplasmin in relation with biliary obstruction was not conducted. Although we found a tendency for increased ceruloplasmin expression in advanced T stage cancer with perineural invasion, that finding did not achieve statistical significance. For the last, having no significant DEG for lymph node metastasis after age and sex adjustment, we included 157 genes with unadjusted p-value <0.05 in both T, N stage and perineural invasion. It would be more valuable to include DEGs with adjusted p-value <0.05, however, the shortage of sample inevitably lead to statistical limitation. A larger number of patients will be needed to validate our result in this study.
MATERIALS AND METHODS
Patients
Quality assessment of RNA for our experiment was performed using fresh frozen tumor tissue samples from 176 consecutive patients with intra- and extra-hepatic bile duct adenocarcinomas, along with normal bile duct tissue from 48 patients with ampulla of Vater adenocarcinoma, all of whom underwent surgical treatment at Seoul National University Hospital between year 2003 ~ 2011. After quality control, 79 samples of intra- and extra-hepatic bile duct adenocarcinoma and 21 samples of normal bile duct tissue were included in our experiments.
Tissue collection and RNA extraction
Immediately after tumor resection, 5 x 5 mm pieces of tumor tissue and normal bile duct tissue were fresh frozen and stored in -70°C liquid nitrogen. Routinely processed 4-um thick paraffin-embedded sections from the same lesion were stained with hematoxylin and eosin and examined histologically.
RNA was extracted from tumor and normal bile duct tissue using RNeasy® kits (QIAGEN Sciences, Germantown, PA, USA), according to the manufacturer’s instructions. RNA concentrations were determined spectrophotometrically, and RNA purity and integrity were evaluated by calculating the 260/280, and 260/239 ratios and by electrophoresis on 1% agarose gels [47].
Microarray
Total RNA was submitted to DNA Link (Seoul, Korea) for gene expression profiling using the Affymetrix GeneChip® Human Gene 2.0 ST Array (Affymetrix, Santa Clara, CA, USA). Synthesis and labeling of cDNA targets and hybridization of GeneChips were carried out. Images were scanned with an Affymetrix GeneChip® Scanner 3000 7G (Affymetrix, Santa Clara, CA, USA). The quality of hybridization and overall chip performance were monitored by visually inspecting both internal quality control checks and the raw scanned data. Raw data were extracted and normalized using the robust multi-array average algorithm with Affymetrix GCOS software.
Selection of DEG
The log 2 ratios of the samples were compared using permutation t-tests at simulation numbers of 100,000, adjusted for age and sex. An adjusted p value with false discovery rate correction less than 0.05 was considered significant. To find the DEGs with a linear association with increasing T, N stage and perineural invasion, DEGs that had positive coefficient were selected for further analysis. To evaluate the clinical effect of ceruloplasmin expression, we compared clinicopathological characteristics with the χ2-test. A p value of less than 0.05 was considered significant. The Kaplan-Meier method was used to calculate survival rates for candidate genes, compared using the log-rank test. All statistical analyses were performed in the R environment (The R Foundation for Statistical Computing, Vienna, Austria) and IBM SPSS Statistics version 21.0 (IBM Corp., Somers, NY, USA), with a p value less than 0.05 considered significant.
Selection of candidate genes
We drew the candidate gene list by filtering for those with a positive log2 ratio in cancer tissue compared with normal bile duct tissue, using covariates of T, N stage and perineural invasion, adjusted for age and sex. Genes considered significant were assessed by gene functional classification, gene function and pathway annotation, and data mining to explore the association of each gene with disease. Gene function was annotated using the PANTHER database (http://www.pantherdb.org). Data mining to explore the relationship of each gene with disease was performed using the i-hop (http://www.ihop-net.org), OMIM (http://www.ncbi.nlm.nih.gov/omim), and oncomine (https://www.oncomine.org/) databases.
Expression analysis of selected genes
Paraffin-embedded tissue samples were stained immunohistochemically with antibodies to ceruloplasmin (ab48614, Abcam, Cambridge, MA, USA, 1:200) according to the manufacturer’s instructions. Immunohistochemical staining results were reviewed by a pathologist specializing in biliary-pancreatic disease with more than 10 years of experience. The intensity of staining was evaluated as a score of 0, 1, or 2+ for no staining, weak staining, and strong staining, respectively.
Author contributions
Conception and design: Jin-Young Jang, Taesung Park. Development of methodology: In Woong Han, Jin-Young Jang, Wooil Kwon, Taesung Park. Analysis and interpretation of data: In Woong Han, Jin-Young Jang, Taesung Park, Yongkang Kim, Kyoung Bun Lee, and Sun-Whe Kim. Writing, review and/ or revision of manuscript: In Woong Han, Jin-Young Jang, Wooil Kwon, Taesung Park, Yongkang Kim, and Sun-Whe Kim. Administrative, technical and material support: In Woong Han, Jin-Young Jang, Taesung Park, Kyoung Bun Lee, and Sun-Whe Kim. All authors read and approved the final manuscript.
ACKNOWLEDGMENTS AND FUNDING
This study was supported by grant no.3420130180 from the SK Telecom Research Fund and by a grant of the Korea Health Technology R&D Project through the Korea Health Industry Development Institute (KHIDI), funded by the Ministry of Health & Welfare, Republic of Korea (grant number : HI16C2037).
CONFLICTS OF INTEREST
The authors have nothing to declare.
REFERENCES
1. Siegel RL, Miller KD, Jemal A. Cancer statistics, 2015. CA Cancer J Clin. 2015;65:5-29.
2. National Cancer Center. Cancer Facts & Figures 2015 in the Republic of Korea. Seoul, Korea2015.
3. Jang JY, Kim SW, Park DJ, Ahn YJ, Yoon YS, Choi MG, Suh KS, Lee KU, Park YH. Actual long-term outcome of extrahepatic bile duct cancer after surgical resection. Ann Surg. 2005;241:77-84.
4. Kang MJ, Jang JY, Chang J, Shin YC, Lee D, Kim HB, Kim SW. Actual Long-Term Survival Outcome of 403 Consecutive Patients with Hilar Cholangiocarcinoma. World J Surg. 2016 doi:10.1007/s00268-016-3551-9.
5. Hu J, Yin B. Advances in biomarkers of biliary tract cancers. Biomed Pharmacother. 2016;81:128-135.
6. Tan FL, Ooi A, Huang D, Wong JC, Qian CN, Chao C, Ooi L, Tan YM, Chung A, Cheow PC, Zhang Z, Petillo D, Yang XJ, et al. p38delta/MAPK13 as a diagnostic marker for cholangiocarcinoma and its involvement in cell motility and invasion. Int J Cancer. 2010;126:2353-2361.
7. Lumachi F, Lo Re G, Tozzoli R, D’Aurizio F, Facomer F, Chiara GB, Basso SM. Measurement of serum carcinoembryonic antigen, carbohydrate antigen 19-9, cytokeratin-19 fragment and matrix metalloproteinase-7 for detecting cholangiocarcinoma: a preliminary case-control study. Anticancer Res. 2014;34:6663-6667.
8. Kishimoto T, Eguchi H, Nagano H, Kobayashi S, Akita H, Hama N, Wada H, Kawamoto K, Tomokuni A, Tomimaru Y, Umeshita K, Doki Y, Mori M. Plasma miR-21 is a novel diagnostic biomarker for biliary tract cancer. Cancer Sci. 2013;104:1626-1631.
9. Claperon A, Mergey M, Nguyen Ho-Bouldoires TH, Vignjevic D, Wendum D, Chretien Y, Merabtene F, Frazao A, Paradis V, Housset C, Guedj N, Fouassier L. EGF/EGFR axis contributes to the progression of cholangiocarcinoma through the induction of an epithelial-mesenchymal transition. J Hepatol. 2014;61:325-332.
10. Lubner SJ, Mahoney MR, Kolesar JL, Loconte NK, Kim GP, Pitot HC, Philip PA, Picus J, Yong WP, Horvath L, Van Hazel G, Erlichman CE, Holen KD. Report of a multicenter phase II trial testing a combination of biweekly bevacizumab and daily erlotinib in patients with unresectable biliary cancer: a phase II Consortium study. J Clin Oncol. 2010;28:3491-3497.
11. Dokduang H, Juntana S, Techasen A, Namwat N, Yongvanit P, Khuntikeo N, Riggins GJ, Loilome W. Survey of activated kinase proteins reveals potential targets for cholangiocarcinoma treatment. Tumour Biol. 2013;34:3519-3528.
12. Menakongka A, Suthiphongchai T. Involvement of PI3K and ERK1/2 pathways in hepatocyte growth factor-induced cholangiocarcinoma cell invasion. World J Gastroenterol. 2010;16:713-722.
13. Buzzoni R, Pusceddu S, Bajetta E, De Braud F, Platania M, Iannacone C, Cantore M, Mambrini A, Bertolini A, Alabiso O, Ciarlo A, Turco C, Mazzaferro V. Activity and safety of RAD001 (everolimus) in patients affected by biliary tract cancer progressing after prior chemotherapy: a phase II ITMO study. Ann Oncol. 2014;25:1597-1603.
14. Yamada D, Kobayashi S, Wada H, Kawamoto K, Marubashi S, Eguchi H, Ishii H, Nagano H, Doki Y, Mori M. Role of crosstalk between interleukin-6 and transforming growth factor-beta 1 in epithelial-mesenchymal transition and chemoresistance in biliary tract cancer. Eur J Cancer. 2013;49:1725-1740.
15. Lee HJ, Chung JY, Hewitt SM, Yu E, Hong SM. HER3 overexpression is a prognostic indicator of extrahepatic cholangiocarcinoma. Virchows Arch. 2012;461:521-530.
16. Chen MH, Chiang KC, Cheng CT, Huang SC, Chen YY, Chen TW, Yeh TS, Jan YY, Wang HM, Weng JJ, Chang PM, Liu CY, Li CP, et al. Antitumor activity of the combination of an HSP90 inhibitor and a PI3K/mTOR dual inhibitor against cholangiocarcinoma. Oncotarget. 2014;5:2372-2389. doi: 10.18632/oncotarget.1706.
17. Grunnet M, Christensen IJ, Lassen U, Jensen LH, Lydolph M, Knox JJ, McNamara MG, Jitlal M, Wasan H, Bridgewater J, Valle JW, Mau-Sorensen M. Decline in CA19-9 during chemotherapy predicts survival in four independent cohorts of patients with inoperable bile duct cancer. Eur J Cancer. 2015;51:1381-1388.
18. Yan XQ, Zhang W, Zhang BX, Liang HF, Zhang WG, Chen XP. Inactivation of Smad4 is a prognostic factor in intrahepatic cholangiocarcinoma. Chin Med J (Engl). 2013;126:3039-3043.
19. Kipp BR, Voss JS, Kerr SE, Barr Fritcher EG, Graham RP, Zhang L, Highsmith WE, Zhang J, Roberts LR, Gores GJ, Halling KC. Isocitrate dehydrogenase 1 and 2 mutations in cholangiocarcinoma. Hum Pathol. 2012;43:1552-1558.
20. Zhang J, Han C, Wu T. MicroRNA-26a promotes cholangiocarcinoma growth by activating beta-catenin. Gastroenterology. 2012;143:246-256 e248.
21. Silakit R, Loilome W, Yongvanit P, Chusorn P, Techasen A, Boonmars T, Khuntikeo N, Chamadol N, Pairojkul C, Namwat N. Circulating miR-192 in liver fluke-associated cholangiocarcinoma patients: a prospective prognostic indicator. J Hepatobiliary Pancreat Sci. 2014;21:864-872.
22. Putnam FW. The plasma proteins: structure, function, and genetic control. Academic Press; 1975.
23. Scheinberg IH, Gitlin D. Deficiency of ceruloplasmin in patients with hepatolenticular degeneration (Wilson’s disease). Science. 1952;116:484-485.
24. Gitlin JD. Aceruloplasminemia. Pediatr Res. 1998;44:271-276.
25. Elkassabany NM, Meny GM, Doria RR, Marcucci C. Green plasma-revisited. Anesthesiology. 2008;108:764-765.
26. Ziakas A, Gavrilidis S, Souliou E, Giannoglou G, Stiliadis I, Karvounis H, Efthimiadis G, Mochlas S, Vayona MA, Hatzitolios A, Savopoulos C, Pidonia I, Parharidis G. Ceruloplasmin is a better predictor of the long-term prognosis compared with fibrinogen, CRP, and IL-6 in patients with severe unstable angina. Angiology. 2009;60:50-59.
27. Lutsenko S, Gupta A, Burkhead JL, Zuzel V. Cellular multitasking: the dual role of human Cu-ATPases in cofactor delivery and intracellular copper balance. Arch Biochem Biophys. 2008;476:22-32.
28. Wolf TL, Kotun J, Meador-Woodruff JH. Plasma copper, iron, ceruloplasmin and ferroxidase activity in schizophrenia. Schizophr Res. 2006;86:167-171.
29. Virit O, Selek S, Bulut M, Savas HA, Celik H, Erel O, Herken H. High ceruloplasmin levels are associated with obsessive compulsive disorder: a case control study. Behav Brain Funct. 2008;4:52.
30. Upadhya S, Upadhya S, Prabhu KS. Serum glycoconjugates and ceruloplasmin in cancer of uterine cervix. Indian J Clin Biochem. 2002;17:20-24.
31. Brandi J, Dalla Pozza E, Dando I, Biondani G, Robotti E, Jenkins R, Elliott V, Park K, Marengo E, Costello E, Scarpa A, Palmieri M, Cecconi D. Secretome protein signature of human pancreatic cancer stem-like cells. J Proteomics. 2016;136:1-12.
32. Balmana M, Sarrats A, Llop E, Barrabes S, Saldova R, Ferri MJ, Figueras J, Fort E, de Llorens R, Rudd PM, Peracaula R. Identification of potential pancreatic cancer serum markers: Increased sialyl-Lewis X on ceruloplasmin. Clin Chim Acta. 2015;442:56-62.
33. Pan Q, Kleer CG, van Golen KL, Irani J, Bottema KM, Bias C, De Carvalho M, Mesri EA, Robins DM, Dick RD, Brewer GJ, Merajver SD. Copper deficiency induced by tetrathiomolybdate suppresses tumor growth and angiogenesis. Cancer Res. 2002;62:4854-4859.
34. Schapira DV, Schapira M. Use of ceruloplasmin levels to monitor response to therapy and predict recurrence of breast cancer. Breast Cancer Res Treat. 1983;3:221-224.
35. Nayak SB, Yashwanth S, Pinto SM, Bhat VR, Mayya SS. Serum copper, ceruloplasmin, protein thiols and thiobarbituric acid reactive substance status in liver cancer associated with elevated levels of alpha-fetoprotein. Indian J Physiol Pharmacol. 2005;49:341-344.
36. Ferrin G, Rodriguez-Peralvarez M, Aguilar-Melero P, Ranchal I, Llamoza C, Linares CI, Gonzalez-Rubio S, Muntane J, Briceno J, Lopez-Cillero P, Montero-Alvarez JL, de la Mata M. Plasma protein biomarkers of hepatocellular carcinoma in HCV-infected alcoholic patients with cirrhosis. PLoS One. 2015;10:e0118527.
37. Arumanayagam M, Wong FW, Rogers M, Swaminathan R. Serum ceruloplasmin, plasma copper concentration and copper to ceruloplasmin ratio in cervical carcinoma. Gynecol Obstet Invest. 1993;35:175-178.
38. Nayak SB, Bhat VR, Upadhyay D, Udupa SL. Copper and ceruloplasmin status in serum of prostate and colon cancer patients. Indian J Physiol Pharmacol. 2003;47:108-110.
39. Fotiou K, Vaiopoulos G, Lilakos K, Giannopoulos A, Mandalenaki K, Marinos G, Koritsiadis G, Sourdis J, Konstantinidou E, Konstantopoulos K. Serum ceruloplasmin as a marker in prostate cancer. Minerva Urol Nefrol. 2007;59:407-411.
40. Nayak SB, Bhat VR, Mayya SS. Serum copper, ceruloplasmin and thiobarbituric acid reactive substance status in patients with ovarian cancer. Indian J Physiol Pharmacol. 2004;48:486-488.
41. Lee CM, Lo HW, Shao RP, Wang SC, Xia W, Gershenson DM, Hung MC. Selective activation of ceruloplasmin promoter in ovarian tumors: potential use for gene therapy. Cancer Res. 2004;64:1788-1793.
42. Huang H, Li Y, Liu J, Zheng M, Feng Y, Hu K, Huang Y, Huang Q. Screening and identification of biomarkers in ascites related to intrinsic chemoresistance of serous epithelial ovarian cancers. PLoS One. 2012;7:e51256.
43. Sogabe M, Nozaki H, Tanaka N, Kubota T, Kaji H, Kuno A, Togayachi A, Gotoh M, Nakanishi H, Nakanishi T, Mikami M, Suzuki N, Kiguchi K, et al. Novel glycobiomarker for ovarian cancer that detects clear cell carcinoma. J Proteome Res. 2014;13:1624-1635.
44. Tian WD, Li JZ, Hu SW, Peng XW, Li G, Liu X, Chen HH, Xu X, Li XP. Proteomic identification of alpha-2-HS-glycoprotein as a plasma biomarker of hypopharyngeal squamous cell carcinoma. Int J Clin Exp Pathol. 2015;8:9021-9031.
45. Kwak CS, Chang UK. Effect of actinomycin d on serum ceruloplasmin in common bile duct ligated rats. BMB Reports. 1979;12:103-112.
46. Sogawa K, Yamada T, Suzuki Y, Masaki T, Watanabe S, Uchida Y, Arima K, Nishioka M, Matsumoto K. Elevation of ceruloplasmin activity involved in changes of hepatic metal concentration in primary biliary cirrhosis. Res Commun Chem Pathol Pharmacol. 1994;84:367-370.
47. Kang MJ, Kim J, Jang JY, Park T, Lee KB, Kim SW. 22q11-q13 as a hot spot for prediction of disease-free survival in bile duct cancer: integrative analysis of copy number variations. Cancer Genet. 2014;207:57-69.