
Introduction
Cancer is a serious global public health problem and lung cancer, in particular, is a leading cause of cancer-related death in the United States. In 2016, almost 250,000 new cancer cases will be reported and slightly more than 150,000 deaths will result. [1] Additionally, lung cancer is the chief cause of cancer death among men and the second most common cause of cancer death among women worldwide. [2] Such high mortality is due to lack of early detection using lung cancer markers.
KRAS, one of the most frequently mutated oncogenes, contributes to the mitogen-activated protein (MAP) kinase pathway, which controls cell growth and differentiation. [3, 4] The KRAS pathway is also involved in the regulation of lung cancer, participating in the downstream signaling network of epidermal growth factor receptor (EGFR). The most commonly mutated codons are 12, 13, and 61 and this causes drug resistance to EGFR tyrosine kinase inhibitors (EGFR-TKIs). Several studies suggest that KRAS mutations should be known prior to using EGFR-TKI therapy for lung cancer patients. [5-7]
Although tumor tissue is the reference standard for KRAS mutation confirmation, obtaining tissue samples is difficult, costly, and invasive. [8] In addition, most advanced lung cancer patients are unable to tolerate surgical procedures. Thus, a more feasible but accurate method for assaying KRAS mutations is needed. Blood testing is less invasive, easily-accessible and can be repeated. [7, 9] Thus, ctDNA and CTCs can be used as a high diagnostic value and prognostically significant source for identifying KRAS mutations in lung cancer patients.
Results
Search results
As shown in Figure 1, our database searched 612 records, of which 59 records were duplicates. After a primary screening of the titles and abstracts, 487 records were excluded. By reviewing full-text articles, we excluded further articles. 12 eligible articles [7, 10-20] with 1131 patients for diagnosis and 11 articles (blood samples) [7, 12, 21-26] for prognosis were included in this meta-analysis. We also included 15 studies in which the KRAS mutation was detected by tumor tissue for prognostic subgroup analysis. [27-40]
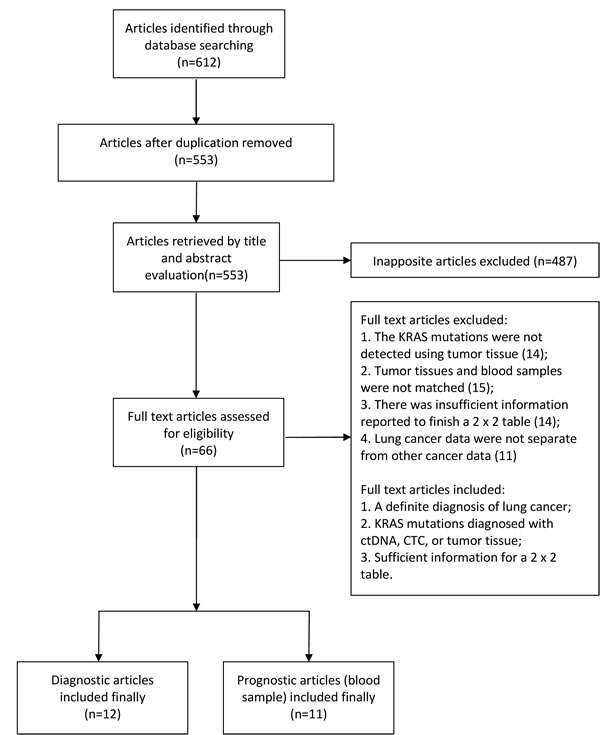
Figure 1: Flow diagram of study inclusion and exclusion for meta-analysis.
Baseline characteristics of identified studies
Baseline characteristics of eligible studies are shown in Table 1. The included articles were published between 2003 and Jan, 2017. Two articles had more than one combination of statistics. [13, 15] CTC were detected by two methods in Der-An Tsao’s article; and ctDNA and CTC were both detected in the article of Maxim B. Freidin. Most of the included lung cancer patients were at III/IV TNM stage with adenocarcinoma of the lung. All describing 1,131 subjects were included. Characteristics of eligible studies appear in Table 1. A QUADAS-2 plot is shown in Supplementary Figure S1, and sensitivity analysis is presented in (Figure 2A) which was accomplished by excluding studies one by one. Data were stable and were not significantly different.
Table 1: Characteristics of eligible studies.
Author(year) |
Country |
Number |
Female |
Smoker |
AC |
treatment |
sample |
Detection methods |
TNM(I/II/III/IV) |
Yao (2017) |
China |
39 |
51.30% |
25.60% |
87% |
Frozen or FFPE |
Plasma |
NGS |
0/0/8/31 |
Wang (2017) |
China |
103 |
53.40% |
32% |
100% |
FFPE |
Plasma |
cSMART |
0/0/25/78 |
Xu (2016) |
China |
42 |
45.20% |
NA |
69.00% |
FFPE |
Plasma |
NGS |
0/0/27/15 |
Del Re (2016) |
Italy |
8 |
60.60% |
33.30% |
NA |
NA |
Plasma |
ddPCR |
0/0/1/32 |
Freidin (2015)a |
England |
82 |
45.10% |
NA |
57.40% |
FFPE |
Plasma |
COLD-PCR |
27/9/8/31 |
Freidin (2015) |
England |
82 |
45.10% |
NA |
57.40% |
FFPE |
Peripheral blood |
HRM |
27/9/8/31 |
Tran (2014) |
America |
154 |
NA |
NA |
NA |
NA |
Plasma |
COLD-PCR |
NA |
Zhang (2013) |
China |
86 |
43.00% |
51.20% |
75.60% |
FFPE |
Plasma |
MEL |
0/0/16/70 |
Wang (2010) |
China |
273 |
42.10% |
58.60% |
72.50% |
FFPE |
Plasma |
RFLP-PCR |
0/0/74/199 |
Tsao (2010)a |
Taiwan, China |
209 |
NA |
NA |
NA |
Frozen |
Peripheral blood |
CLMA |
NA |
Tsao (2010) |
Taiwan, China |
209 |
NA |
NA |
NA |
Frozen |
Peripheral blood |
WCHMA |
NA |
Gautschi (2007) |
Switzerland |
9 |
30.60% |
69.40% |
43.90% |
FFPE |
Plasma |
RFLP-PCR |
15/11/63/91 |
Chong (2007) |
Taiwan, China |
76 |
57.90% |
46.10% |
72.40% |
Frozen |
Peripheral blood |
membrane array analysis |
10/21/20/25 |
Ramirez (2003) |
Spain |
50 |
4.00% |
98.00% |
30.00% |
Frozen |
Serum |
methylation-specific PCR |
6/11/18/5 |
AC: adenocarcinoma; NA: not available; FFPE: formalin-fixed paraffin embedded; NGS: next generation sequencing; cSMART: circulating single-molecule amplification and resequencing technology; ddPCR: droplet digital PCR; COLD-PCR: co-amplification at lower denaturation temperature-PCR ; HRM: high resolution melting; MEL: mutant enriched liquid chip; RFLP-PCR: restriction fragment length polymorphism PCR; CLMA: colorimetric membrane array method ; WCHMA: weighted chemiluminescent membrane array.
a: For studies by Freidin and Tsao’s group, KRAS mutation was measured in ctDNA and CTC, and ctDNA and CTC data were analyzed as two independent studies.
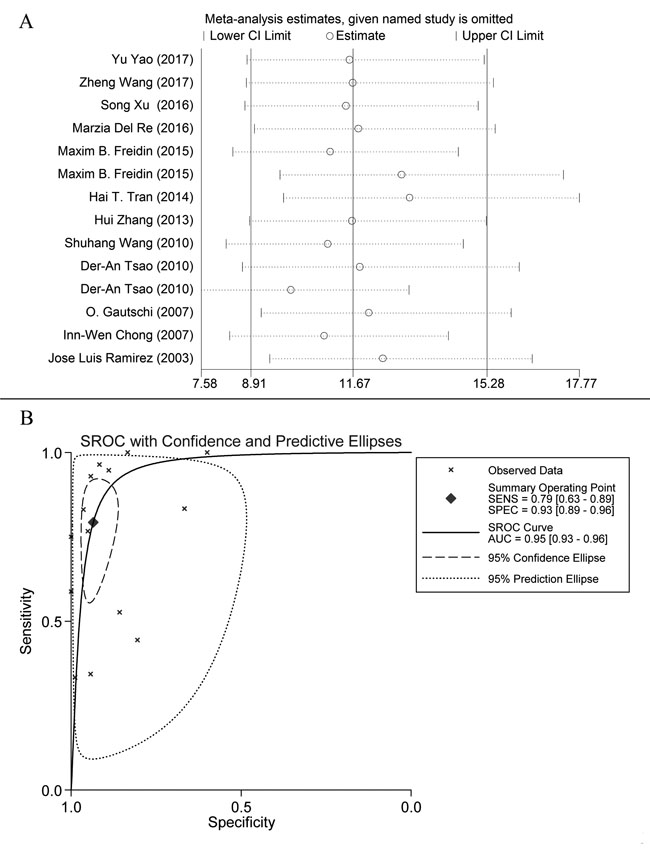
Figure 2: A. Sensitivity analysis plot of meta-analysis. Every row represents an included study. The width of the horizontal line represents the 95% CI for each study. The vertical bar on both sides represents the lowest and highest values of 95% CI. B. SROC curve: each X mark represents a study and AUC is the area under the curve.
Diagnostic accuracy of KRAS mutation in blood samples
Figure 3 shows a Forest plot of the meta-analysis.The pooled sensitivity of blood samples for the detection of KRAS mutation was 0.79 (95% confidence interval (CI), 0.63-0.89) and pooled specificity was 0.93 (95%CI, 0.89-0.96). Table 2 shows that pooled PLR was 12.13 (92%CI,7.11-20.67),, NLR was 0.22 (95%CI, 0.12-0.41) (Figure S2), DOR was 54.82 (95%CI, 23.11-130.09), and AUC was 0.95 (95%CI, 0.93-0.96) (Figure 2B). As the Fagan’s nomogram is shown in Figure 4B), PLR was 12, NLR was 0.22 and post-test probability were 75 and 5, respectively, indicating that blood samples are reliable for measuring KRAS mutations. Data show that KRAS mutations can be assayed with high diagnostic accuracy and specificity. Figure 5 shows a Forest plot of ctDNA and CTC. The pooled sensitivity of ctDNA was 0.74 (95%CI, 0.52-0.88) (Figure 5A), while the pooled specificity was 0.94 (95%CI, 0.85-0.97) (Figure 5B). The pooled sensitivity of CTC was 0.85 (95%CI, 0.66-0.95) (Figure 5C), and the pooled specificity was 0.93 (95%CI, 0.89-0.96) (Figure 5D).
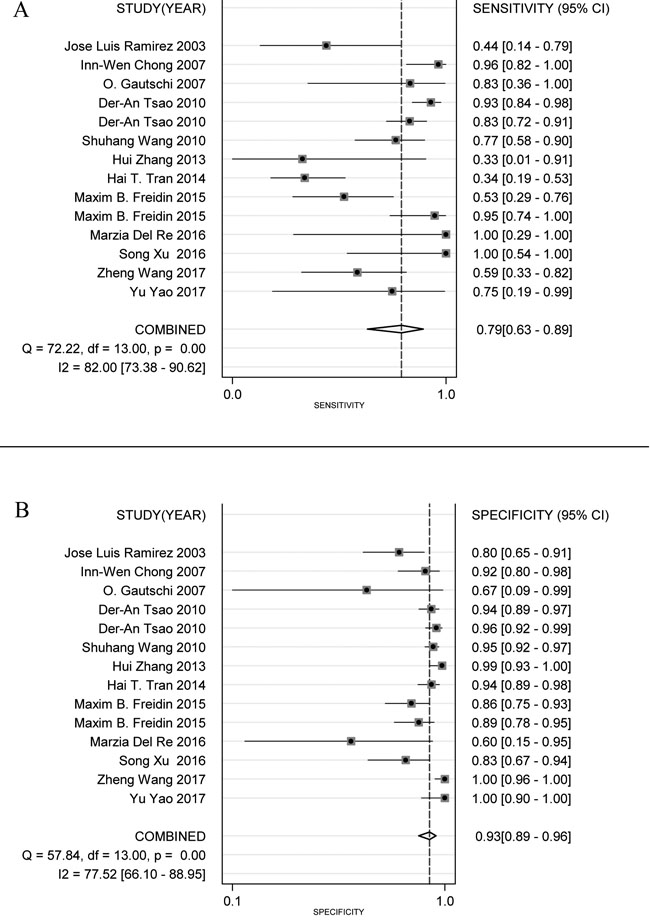
Figure 3: Forest plots of sensitivity (A) and specificity (B) for blood samples (ctDNA and CTC). The width of the horizontal line represents the 95% CI of each study, square proportional means the weight of every study. The weight is evaluated by the sample size and is presented as percent of total. The diamond represents pooled sensitivity, specificity and 95% CI.
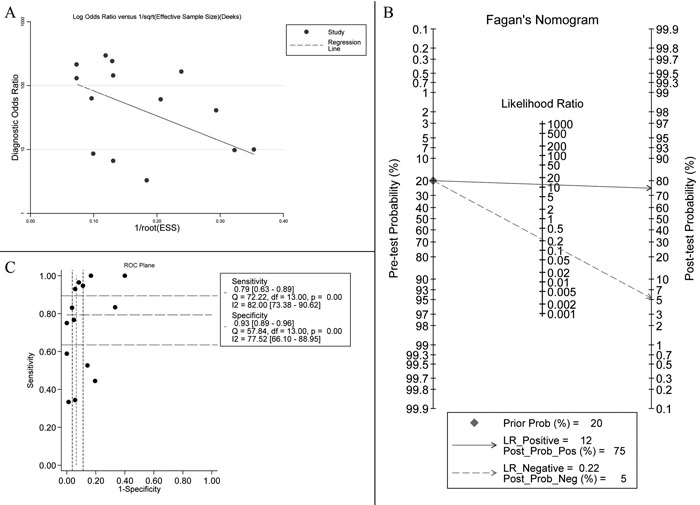
Figure 4: A. Deek’s funnel plot indicates no significant publication bias (p = 0.218 > 0.05). B. Fagan’s Nomogram of blood samples for KRAS mutation identification. C. ROC plane for threshold effect. Each black spot represents an included study and does not constitute a “shoulder shape” graph, which represents no significant threshold effect.
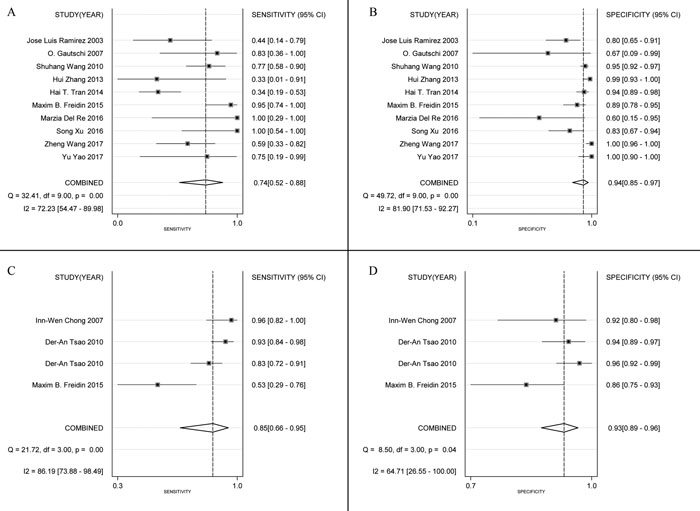
Figure 5: Forest plots of sensitivity and specificity for ctDNA (sensitivity, A; specificity, B) and CTC (sensitivity, C; specificity, D). The width of the horizontal line represents the 95% CI of each study, square proportional means the weight of every study. Weight is evaluated by sample size and presented as percent of total. Diamond represents pooled sensitivity, specificity and 95% CI.
Sub-groups
Sub-group analysis is shown in Table 2. Race, detection method and treatment are displayed and data show that Asian subjects experienced greater diagnostic accuracy compared with Caucasians. CTC and frozen tissue was more sensitive than ctDNA and FFPE.
Table 2: Subgroup analysis of KRAS mutation in blood sample.
Subgroups |
Patientsa |
Sensitivity |
Specificity |
PLR |
NLR |
DOR |
AUC |
Total |
1422 |
0.79 (0.63-0.89) |
0.93 (0.89-0.96) |
12.13 (7.11-20.67) |
0.22 (0.12-0.41) |
54.82 (23.11-130.09) |
0.95 (0.93-0.96) |
Race |
1422 |
||||||
Asian |
1037 |
0.84 (0.68-0.93) |
0.96 (0.92-0.98) |
22.02 (11.66-41.57) |
0.17 (0.08-0.34) |
132.57 (72.86-241.23) |
0.97 (0.95-0.98) |
Caucasian |
385 |
0.71 (0.42-0.89) |
0.87 (0.78-0.92) |
5.354 (3.207-8.937) |
0.334 (0.142-0.784) |
16.027 (4.953-51.858) |
0.89 (0.85-0.91) |
Detection method |
1422 |
||||||
ctDNA |
846 |
0.74 (0.52-0.88) |
0.94 (0.85-0.97) |
11.68 (5.19-26.27) |
0.28 (0.14-0.55) |
41.79 (14.48-120.60) |
0.93 (0.90-0.95) |
CTC |
576 |
0.85 (0.66-0.95) |
0.93 (0.89-0.96) |
12.72 (6.75-23.96) |
0.16 (0.06-0.41) |
81.188 (18.246-361.266) |
0.96 (0.94-0.97) |
Treatment in tissue |
1221 |
||||||
FFPE |
677 |
0.76 (0.56-0.89) |
0.94 (0.85-0.98) |
12.68 (5.36-30.02) |
0.26 (0.13-0.50) |
49.38 (17.81-136.87) |
0.93 (0.90-0.95) |
Frozen |
544 |
0.85 (0.63-0.95) |
0.93 (0.86-0.96) |
11.71 (5.38-25.49) |
0.16 (0.06-0.47) |
71.88 (12.75-405.10) |
0.95 (0.93-0.97) |
a: For studies by Freidin and Tsao’s group, KRAS mutation was measured in ctDNA and CTC, and ctDNA and CTC data were analyzed as two independent studies.
Outcomes
The estimated pooled HRs for OS and PFS is displayed in Figure 6 and data show that poorer prognosis is correlated with KRAS mutations. Subgroup analysis indicated that lung cancer patients with KRAS mutations had a significantly shorter OS and PFS compared to wild-type lung cancer patients. Additionally, there was no significant difference between HRs for blood samples and tumor tissues so both can be used.

Figure 6: Forest plots of pooled HR for OS (tumor tissue: A, blood sample: B) and PFS (tumor tissue: C, blood sample: D) comparing patients of KRAS mutations with wild-type KRAS. The width of horizontal line represents the 95% CI of each study and square proportional means the weight of every study. Weight is evaluated by sample size and is presented as percent of total. Diamond represents pooled HR and 95% CI.
Heterogeneity and publication bias
I2 values of pooled sensitivity and specificity were 82.00 (95%CI, 73.38-90.62) and 77.52 (95%CI, 66.10-88.95), respectively.For ctDNA, I2 of sensitivity and specificity were 72.23 (95%CI, 54.47-89.98) and 81.90 (95%CI, 71.53-92.27). For CTC, I2 of sensitivity and specificity were 86.19 (95%CI, 73.88-98.49) and 64.71 (95%CI, 26.55-100.00), which implies a statistically significant heterogeneity. Most heterogeneity was derived from the threshold effect and differenced among studies. The ROC plane and statistical data show no significant threshold effect (Figure 4C). The Spearman correlation coefficient was 0.367 and the P value was 0.197 (P > 0.05), indicating no significant threshold effect. Therefore, we suspect that heterogeneity is likely rooted in differences among studies. Potential publication bias was evaluated using a Deek regression test (Figure 4A), and no significant publication bias was discovered (p = 0.218 > 0.05).
Discussion
Detecting KRAS mutations in lung cancer is useful for predicting patient outcomes and targeting therapy and tumor tissue is currently used for this assay. Limitations to this approach include patient age and health, so a simple, minimally invasive approach for measuring KRAS mutations is required and blood sampling may be that solution. To address this issue, we conducted a meta-analysis to evaluate the diagnostic accuracy and prognostic significance of using blood samples for KRAS mutation assay. The results show that blood sampling offered high sensitivity and specificity which suggests that KRAS mutations can be assayed this way when tumor tissue is inconvenient or unavailable. Also, blood samples offered high diagnostic accuracy. [41, 42] Finally, likelihood ratios and post-test probability are also important testing standards. [43] The value of likelihood ratios ranges from 0 to infinity. When likelihood is 2-5, post-test probability is slightly increased. When likelihood is > 10, post-test probability increases significantly. In this study, PLR was 12 and NLR was 0.22, which clearly changed the post-test probability.
Subgroup analysis to identify factors that can influence diagnostic accuracy included race, detection method, and tissue treatment. Data show that compared with Caucasians, KRAS mutations in blood samples of Asians was more accurate and sensitive when using frozen tumor tissue samples and CTC methods compared to FFPE tissue samples and ctDNA. FFPE can lead to a cross-link between proteins and nucleic acids but this did not occurs with nitrogen-frozen tissues. CTC was more sensitive than ctDNA [44], perhaps due to fewer included studies. Detection methods, collection timing, and TNM stage were not analyzed due to too few studies including this information. Subgroup survival analysis indicated that KRAS mutations are associated with significant increases in mortality but there were no differences between blood samples and tumor tissues for OS and PFS, which suggest that blood sampling is suitable for replacing tissue assay.
This is the first meta-analysis to evaluate KRAS mutations in blood samples for treating lung cancer. Liquid biopsies allow identification of molecular targets, assessment of prognosis, monitoring therapeutic response and molecular profiles in real time as well as diagnosis of disease recurrence or progression. We found that liquid was highly accurate and high ctDNA and CTC are correlated with poorer prognosis for lung cancer patients. [45] Thus, ctDNA and CTC can be used to confirm KRAS mutations in lung cancer instead of tumor tissue and suggest details about prognosis. The diagnostic value and prognostic significance of blood sampling for lung cancer patient monitoring is unclear but our data suggest that it is worth investigating.
The meta-analysis has several limitations such as potential publication bias. We used well-selected articles and Supplementary Data and Deek’s funnel plot did not confirm statistical significance (p = 0.170 > 0.05). Second, some studies were small and this may have caused bias but a sensitivity analysis suggested that sample size did not influence pooled results significantly. Third, significant heterogeneity existed in our meta-analysis and the ROC plane and Spearman correlation coefficient data indicated that heterogeneity was not due to a threshold effect. Thus, heterogeneity may be primarily due to small sample studies [12, 17] and differences among study detection methods. Studies also differed with respect to race, TNM classification, and percent of lung adenocarcinomas. We tried to establish a subgroup for test methods but because we had few studies and varied methods within them, this was difficult. Future studies should be designed to evaluate differences in detection methods. Finally, in the prognostic analysis sub-group, most studies did not provide a HR so we calculated one (at 95% CI using a survival curve) and it may indicate result bias.
In conclusion, lung cancer is a leading cause of cancer-specific mortality around the world and with the rapid development of liquid biopsy, CTCs and ctDNA provide a novel method for assaying KRAS mutations in lung cancer. Our meta-analysis indicates that this approach has advantages over other methods and that it is highly specific, non-invasive, and a repeatable measuring approach with diagnostic and prognostic value that allows real-time monitoring.
Materials and Methods
Data source and search strategy
We reviewed reports published in PubMed, EMBASE, Web of Science and the Cochrane Library. We used these searched terms: ‘KRAS’ or ‘GTPase KRAS’ or ‘V-Ki-ras2 Kirsten rat sarcoma viral oncogene homolog,’ ‘serum’ or ‘plasma’ or ‘circulating,’ ‘mutation,’ ‘cancer’ or ‘carcinoma’ or ‘tumor’ or ‘neoplasm,’ and ‘lung.’ Only studies published in English were included.
Inclusion and exclusion criteria
Inclusion criteria for primary studies were d a definite diagnosis of lung cancer; KRAS mutations diagnosed with ctDNA, CTC, or tumor tissue; sufficient information for a 2 x 2 table. Articles were excluded if the KRAS mutations were not detected using tumor tissue; tumor tissues and blood samples were not matched; there was insufficient information reported to finish a 2 x 2 table; or lung cancer data were not separate from other cancer data. All selected studies were managed using EndNote X7. Studies included in our meta-analysis were assessed by two investigators independently.
Data extraction and quality assessment
The first author’s name, year of publication, country, number of patients, sex ratio, the proportion of smokers included, adenocarcinoma (AC) ratio, tumor tissue treatment, use of serum or plasma, KRAS mutation detection methods, and TNM stage were collected from eligible studies. Then, 2 x 2 tables were designed to show TP, TN, FP, and FN. When a KRAS mutation was detected by multiple methods, data for all methods were extracted, recorded, and evaluated by two investigators independently. QUADAS-2 (quality assessment of diagnostic accuracy studies 2) was used to evaluate diagnostic accuracy quality [46] using patient selection, index test, reference standard, and flow and timing.
Statistical analysis
KRAS mutation status in tumor tissues was designed as a reference standard. Diagnostic numbers (TP, FP, FN, TN) were used to calculate pooled sensitivity, specificity, positive likelihood ratio (PLR), negative likelihood ratio (NLR), diagnostic odds ratio (DOR), area under the curve (AUC) and corresponding 95% confidence intervals (95% CI). PLR is calculated as: sensitivity/(1-specificity) and NLR is: (1- sensitivity)/specificity. [47, 48] DOR is a measure of the effectiveness of a diagnostic test, which is defined as PLR/NLR. [41] Summary ROC curves (SROC) and AUCs of the SROC (AUSROC) were measured.
OS was defined as the survival time from randomization and PFS was defined as the time from randomization to progression, recurrence, death or termination of follow-up. When studies did not report HRs directly, two independent investigators calculated survival data from survival curves using an Engauge Digitizer, version 4.1integrated to calculate overall HR. The threshold effect was measured by using the ROC plane, a Spearman correlation coefficient and a p-value. We evaluated race, detection methods, and tissue treatment. Publication bias was measured using a Deek’s funnel plot and (p = 0.218) which indicated no significant bias. [49] All statistical analyses were performed using STATA software (version 12.0, STATA Corp, MIDAS module) and Meta-Disc. Quality assessment was managed with Review Manager 5.3.
Acknowledgments
We are grateful to everyone who helped complete this study successfully.
conflicts of interest
The authors declare no competing financial interests.
Grant support
The work was supported by Shandong Provincial Key Research Projects (2015GSF118129; 2015GSF118063) and National Natural Science Foundation of China (project 81672288).
References
1. Siegel RL, Miller KD, Jemal A. Cancer statistics, 2016. CA Cancer J Clin. 2016; 66: 7-30. doi: 10.3322/caac.21332.
2. Torre LA, Siegel RL, Jemal A. Lung Cancer Statistics. Adv Exp Med Biol. 2016; 893: 1-19. doi: 10.1007/978-3-319-24223-1_1.
3. Riely GJ, Kris MG, Rosenbaum D, Marks J, Li A, Chitale DA, Nafa K, Riedel ER, Hsu M, Pao W, Miller VA, Ladanyi M. Frequency and distinctive spectrum of KRAS mutations in never smokers with lung adenocarcinoma. Clin Cancer Res. 2008; 14: 5731-4. doi: 10.1158/1078-0432.CCR-08-0646.
4. Vojtek AB, Der CJ. Increasing complexity of the Ras signaling pathway. J Biol Chem. 1998; 273: 19925-8.
5. Neri M, Cesario A, Granone P, Dominioni L, Puntoni R, D’Angelillo RM, Russo P. Prognostic role of K-Ras mutations in non-small cell lung cancer: still an issue for open debate. Lung Cancer. 2006; 53: 393-5; author reply 7-8. doi: 10.1016/j.lungcan.2006.06.009.
6. Camps C, Sirera R, Bremnes R, Blasco A, Sancho E, Bayo P, Safont MJ, Sanchez JJ, Taron M, Rosell R. Is there a prognostic role of K-ras point mutations in the serum of patients with advanced non-small cell lung cancer? Lung Cancer. 2005; 50: 339-46. doi: 10.1016/j.lungcan.2005.06.007.
7. Wang S, An T, Wang J, Zhao J, Wang Z, Zhuo M, Bai H, Yang L, Zhang Y, Wang X, Duan J, Wang Y, Guo Q, et al. Potential clinical significance of a plasma-based KRAS mutation analysis in patients with advanced non-small cell lung cancer. Clin Cancer Res. 2010; 16: 1324-30. doi: 10.1158/1078-0432.ccr-09-2672.
8. Diaz LA Jr, Bardelli A. Liquid biopsies: genotyping circulating tumor DNA. J Clin Oncol. 2014; 32: 579-86. doi: 10.1200/jco.2012.45.2011.
9. Rogosnitzky M, Danks R. Validation of blood testing for K-ras mutations in colorectal and pancreatic cancer. Anticancer Res. 2010; 30: 2943-7.
10. Tran HT, Legendre BL, Kim ES, Blumenschein GR, Tsao AS, Herbst RS, Wistuba II, Lewis M, Richardson K, Hong WK, Heymach J. The use of improved and complete enrichment co-amplification at lower denaturation temperature (ICE COLD-PCR) method for the detection of EGFR and KRAS mutations from cell-free plasma DNA of non-small cell lung cancer (NSCLC) patients. Journal of Clinical Oncology. 2014; 32.
11. Ramirez JL, Sarries C, de Castro PL, Roig B, Queralt C, Escuin D, de Aguirre I, Sanchez JM, Manzano JL, Margelı́ M, Sanchez JJ, Astudillo J, Taron M, et al. Methylation patterns and K-ras mutations in tumor and paired serum of resected non-small-cell lung cancer patients. Cancer Letters. 2003; 193: 207-16. doi: 10.1016/s0304-3835(02)00740-1.
12. Gautschi O, Huegli B, Ziegler A, Gugger M, Heighway J, Ratschiller D, Mack PC, Gumerlock PH, Kung HJ, Stahel RA, Gandara DR, Betticher DC. Origin and prognostic value of circulating KRAS mutations in lung cancer patients. Cancer Letters. 2007; 254: 265-73. doi: 10.1016/j.canlet.2007.03.008.
13. Tsao DA, Yang MJ, Chang HJ, Yen LC, Chiu HH, Hsueh EJ, Chen YF, Lin SR. A fast and convenient new technique to detect the therapeutic target, K-ras mutant, from peripheral blood in non-small cell lung cancer patients. Lung Cancer. 2010; 68: 51-7. doi: 10.1016/j.lungcan.2009.05.023.
14. Zhang H, Liu D, Li S, Zheng Y, Yang X, Li X, Zhang Q, Qin N, Lu J, Ren-Heidenreich L, Yang H, Wu Y, Zhang X, et al. Comparison of EGFR signaling pathway somatic DNA mutations derived from peripheral blood and corresponding tumor tissue of patients with advanced non-small-cell lung cancer using liquidchip technology. J Mol Diagn. 2013; 15: 819-26. doi: 10.1016/j.jmoldx.2013.06.006.
15. Freidin MB, Freydina DV, Leung M, Montero Fernandez A, Nicholson AG, Lim E. Circulating tumor DNA outperforms circulating tumor cells for KRAS mutation detection in thoracic malignancies. Clin Chem. 2015; 61: 1299-304. doi: 10.1373/clinchem.2015.242453.
16. Xu S, Lou F, Wu Y, Sun DQ, Zhang JB, Chen W, Ye H, Liu JH, Wei S, Zhao MY, Wu WJ, Su XX, Shi R, et al. Circulating tumor DNA identified by targeted sequencing in advanced-stage non-small cell lung cancer patients. Cancer Lett. 2016; 370: 324-31. doi: 10.1016/j.canlet.2015.11.005.
17. Del Re M, Tiseo M, Bordi P, D’Incecco A, Camerini A, Petrini I, Lucchesi M, Inno A, Spada D, Vasile E, Citi V, Malpeli G, Testa E, et al. Contribution of KRAS mutations and c.2369C > T (p.T790M) EGFR to acquired resistance to EGFR-TKIs in EGFR mutant NSCLC: a study on circulating tumor DNA. Oncotarget. 2017; 8:13611-13619. doi: 10.18632/oncotarget.6957.
18. Chong IW, Chang MY, Sheu CC, Wang CY, Hwang JJ, Huang MS, Lin SR. Detection of activated K-ras in non-small cell lung cancer by membrane array: a comparison with direct sequencing. Oncol Rep. 2007; 18: 17-24.
19. Wang Z, Cheng G, Han X, Mu X, Zhang Y, Cui D, Liu C, Zhang L, Fan Z, Ma L, Yang L, Di J, Cram DS, et al. Application of Single-Molecule Amplification and Resequencing Technology for Broad Surveillance of Plasma Mutations in Patients with Advanced Lung Adenocarcinoma. J Mol Diagn. 2017; 19: 169-81. doi: 10.1016/j.jmoldx.2016.09.008.
20. Yao Y, Liu J, Li L, Yuan Y, Nan K, Wu X, Zhang Z, Wu Y, Li X, Zhu J, Meng X, Wei L, Chen J, et al. Detection of circulating tumor DNA in patients with advanced non-small cell lung cancer. Oncotarget. 2017; 8: 2130-40. doi: 10.18632/oncotarget.12883.
21. Amann JM, Lee JW, Roder H, Brahmer J, Gonzalez A, Schiller JH, Carbone DP. Genetic and proteomic features associated with survival after treatment with erlotinib in first-line therapy of non-small cell lung cancer in Eastern Cooperative Oncology Group 3503. J Thorac Oncol. 2010; 5: 169-78. doi: 10.1097/JTO.0b013e3181c8cbd9.
22. Camps C, Jantus-Lewintre E, Cabrera A, Blasco A, Sanmartin E, Gallach S, Caballero C, del Pozo N, Rosell R, Guijarro R, Sirera R. The identification of KRAS mutations at codon 12 in plasma DNA is not a prognostic factor in advanced non-small cell lung cancer patients. Lung Cancer. 2011; 72: 365-9. doi: 10.1016/j.lungcan.2010.09.005.
23. Dowler Nygaard A, Spindler KL, Pallisgaard N, Andersen RF, Jakobsen A. Levels of cell-free DNA and plasma KRAS during treatment of advanced NSCLC. Oncol Rep. 2014; 31: 969-74. doi: 10.3892/or.2013.2906.
24. Kim ST, Sung JS, Jo UH, Park KH, Shin SW, Kim YH. Can mutations of EGFR and KRAS in serum be predictive and prognostic markers in patients with advanced non-small cell lung cancer (NSCLC)? Medical Oncology. 2013; 30. doi: 10.1007/s12032-012-0328-3.
25. Kimura T, Holland WS, Kawaguchi T, Williamson SK, Chansky K, Crowley JJ, Doroshow JH, Lenz HJ, Gandara DR, Gumerlock PH. Mutant DNA in plasma of lung cancer patients: potential for monitoring response to therapy. Ann N Y Acad Sci. 2004; 1022: 55-60. doi: 10.1196/annals.1318.010.
26. Nygaard AD, Garm Spindler KL, Pallisgaard N, Andersen RF, Jakobsen A. The prognostic value of KRAS mutated plasma DNA in advanced non-small cell lung cancer. Lung Cancer. 2013; 79: 312-7. doi: 10.1016/j.lungcan.2012.11.016.
27. Brugger W, Triller N, Blasinska-Morawiec M, Curescu S, Sakalauskas R, Manikhas GM, Mazieres J, Whittom R, Ward C, Mayne K, Trunzer K, Cappuzzo F. Prospective molecular marker analyses of EGFR and KRAS from a randomized, placebo-controlled study of erlotinib maintenance therapy in advanced non-small-cell lung cancer. J Clin Oncol. 2011; 29: 4113-20. doi: 10.1200/jco.2010.31.8162.
28. Campos-Parra AD, Zuloaga C, Manriquez ME, Aviles A, Borbolla-Escoboza J, Cardona A, Meneses A, Arrieta O. KRAS mutation as the biomarker of response to chemotherapy and EGFR-TKIs in patients with advanced non-small cell lung cancer: clues for its potential use in second-line therapy decision making. Am J Clin Oncol. 2015; 38: 33-40. doi: 10.1097/COC.0b013e318287bb23.
29. Cserepes M, Ostoros G, Lohinai Z, Raso E, Barbai T, Timar J, Rozsas A, Moldvay J, Kovalszky I, Fabian K, Gyulai M, Ghanim B, Laszlo V, et al. Subtype-specific KRAS mutations in advanced lung adenocarcinoma: a retrospective study of patients treated with platinum-based chemotherapy. Eur J Cancer. 2014; 50: 1819-28. doi: 10.1016/j.ejca.2014.04.001.
30. Douillard JY, Shepherd FA, Hirsh V, Mok T, Socinski MA, Gervais R, Liao ML, Bischoff H, Reck M, Sellers MV, Watkins CL, Speake G, Armour AA, et al. Molecular predictors of outcome with gefitinib and docetaxel in previously treated non-small-cell lung cancer: data from the randomized phase III INTEREST trial. J Clin Oncol. 2010; 28: 744-52. doi: 10.1200/jco.2009.24.3030.
31. Eberhard DA, Johnson BE, Amler LC, Goddard AD, Heldens SL, Herbst RS, Ince WL, Janne PA, Januario T, Johnson DH, Klein P, Miller VA, Ostland MA, et al. Mutations in the epidermal growth factor receptor and in KRAS are predictive and prognostic indicators in patients with non-small-cell lung cancer treated with chemotherapy alone and in combination with erlotinib. J Clin Oncol. 2005; 23: 5900-9. doi: 10.1200/jco.2005.02.857.
32. Fiala O, Pesek M, Finek J, Benesova L, Bortlicek Z, Minarik M. Gene mutations in squamous cell NSCLC: insignificance of EGFR, KRAS and PIK3CA mutations in prediction of EGFR-TKI treatment efficacy. Anticancer Res. 2013; 33: 1705-11.
33. Herbst RS, Kelly K, Chansky K, Mack PC, Franklin WA, Hirsch FR, Atkins JN, Dakhil SR, Albain KS, Kim ES, Redman M, Crowley JJ, Gandara DR. Phase II selection design trial of concurrent chemotherapy and cetuximab versus chemotherapy followed by cetuximab in advanced-stage non-small-cell lung cancer: Southwest Oncology Group study S0342. J Clin Oncol. 2010; 28: 4747-54. doi: 10.1200/jco.2009.27.9356.
34. Jackman DM, Miller VA, Cioffredi LA, Yeap BY, Janne PA, Riely GJ, Ruiz MG, Giaccone G, Sequist LV, Johnson BE. Impact of epidermal growth factor receptor and KRAS mutations on clinical outcomes in previously untreated non-small cell lung cancer patients: results of an online tumor registry of clinical trials. Clin Cancer Res. 2009; 15: 5267-73. doi: 10.1158/1078-0432.ccr-09-0888.
35. Khambata-Ford S, Harbison CT, Hart LL, Awad M, Xu LA, Horak CE, Dakhil S, Hermann RC, Lynch TJ, Weber MR. Analysis of potential predictive markers of cetuximab benefit in BMS099, a phase III study of cetuximab and first-line taxane/carboplatin in advanced non-small-cell lung cancer. J Clin Oncol. 2010; 28: 918-27. doi: 10.1200/jco.2009.25.2890.
36. Ludovini V, Bianconi F, Pistola L, Pistola V, Chiari R, Colella R, Bellezza G, Tofanetti FR, Siggillino A, Baldelli E, Flacco A, Giuffrida D, Sidoni A, et al. Optimization of patient selection for EGFR-TKIs in advanced non-small cell lung cancer by combined analysis of KRAS, PIK3CA, MET, and non-sensitizing EGFR mutations. Cancer Chemother Pharmacol. 2012; 69: 1289-99. doi: 10.1007/s00280-012-1829-7.
37. Marks JL, Broderick S, Zhou Q, Chitale D, Li AR, Zakowski MF, Kris MG, Rusch VW, Azzoli CG, Seshan VE, Ladanyi M, Pao W. Prognostic and therapeutic implications of EGFR and KRAS mutations in resected lung adenocarcinoma. J Thorac Oncol. 2008; 3: 111-6. doi: 10.1097/JTO.0b013e318160c607.
38. Massarelli E, Varella-Garcia M, Tang X, Xavier AC, Ozburn NC, Liu DD, Bekele BN, Herbst RS, Wistuba, II. KRAS mutation is an important predictor of resistance to therapy with epidermal growth factor receptor tyrosine kinase inhibitors in non-small-cell lung cancer. Clin Cancer Res. 2007; 13: 2890-6. doi: 10.1158/1078-0432.ccr-06-3043.
39. Pesek M, Benesova L, Belsanova B, Mukensnabl P, Bruha F, Minarik M. Dominance of EGFR and insignificant KRAS mutations in prediction of tyrosine-kinase therapy for NSCLC patients stratified by tumor subtype and smoking status. Anticancer Res. 2009; 29: 2767-73.
40. Shepherd FA, Domerg C, Hainaut P, Janne PA, Pignon JP, Graziano S, Douillard JY, Brambilla E, Le Chevalier T, Seymour L, Bourredjem A, Le Teuff G, Pirker R, et al. Pooled analysis of the prognostic and predictive effects of KRAS mutation status and KRAS mutation subtype in early-stage resected non-small-cell lung cancer in four trials of adjuvant chemotherapy. J Clin Oncol. 2013; 31: 2173-81. doi: 10.1200/jco.2012.48.1390.
41. Glas AS, Lijmer JG, Prins MH, Bonsel GJ, Bossuyt PM. The diagnostic odds ratio: a single indicator of test performance. J Clin Epidemiol. 2003; 56: 1129-35.
42. Swets JA. Measuring the accuracy of diagnostic systems. Science. 1988; 240: 1285-93.
43. Gallagher EJ. Clinical utility of likelihood ratios. Ann Emerg Med. 1998; 31: 391-7.
44. Ilie M, Hofman V, Long E, Bordone O, Selva E, Washetine K, Marquette CH, Hofman P. Current challenges for detection of circulating tumor cells and cell-free circulating nucleic acids, and their characterization in non-small cell lung carcinoma patients. What is the best blood substrate for personalized medicine? Ann Transl Med. 2014; 2: 107. doi: 10.3978/j.issn.2305-5839.2014.08.11.
45. Pathak AK, Bhutani M, Kumar S, Mohan A, Guleria R. Circulating cell-free DNA in plasma/serum of lung cancer patients as a potential screening and prognostic tool. Clin Chem. 2006; 52: 1833-42. doi: 10.1373/clinchem.2005.062893.
46. Whiting PF, Rutjes AW, Westwood ME, Mallett S, Deeks JJ, Reitsma JB, Leeflang MM, Sterne JA, Bossuyt PM. QUADAS-2: a revised tool for the quality assessment of diagnostic accuracy studies. Ann Intern Med. 2011; 155: 529-36. doi: 10.7326/0003-4819-155-8-201110180-00009.
47. Fischer JE, Bachmann LM, Jaeschke R. A readers’ guide to the interpretation of diagnostic test properties: clinical example of sepsis. Intensive Care Med. 2003; 29: 1043-51. doi: 10.1007/s00134-003-1761-8.
48. Jaeschke R, Guyatt GH, Sackett DL. Users’ guides to the medical literature. III. How to use an article about a diagnostic test. B. What are the results and will they help me in caring for my patients? The Evidence-Based Medicine Working Group. Jama. 1994; 271: 703-7.
49. Deeks JJ, Macaskill P, Irwig L. The performance of tests of publication bias and other sample size effects in systematic reviews of diagnostic test accuracy was assessed. J Clin Epidemiol. 2005; 58: 882-93. doi: 10.1016/j.jclinepi.2005.01.016.