
INTRODUCTION
Non-small cell lung cancer (NSCLC) accounts for approximately 80% of lung cancer which has become the top cause of cancer deaths in the world [1]. NSCLC includes adenocarcinoma (AC), squamous cell carcinoma (SCC), large cell carcinoma, and adenosquamous carcinoma [2, 3]. NSCLC is commonly diagnosed by a comprehensive evaluation of symptoms, medical imaging, assessment of the levels of serum tumor biomarkers, and, eventually, cytological examination. Imaging methods, such as chest X-rays and computed tomography (CT), are widely used, but they do not have sufficient sensitivity and specificity to detect the early stages of NSCLC [4]. Reportedly, PET imaging has a better potential for detection of NSCLC but is characterized by the high costs of analysis [5, 6]. Many studies suggest that the combined detection of several tumor markers, including CEA, PRO-GRP, NSE, SCC-AG, CYFRA21-1, and CA199, is more effective than their single detection [7, 8].
In a previous study, epigenetic changes were shown to be significantly associated with NSCLC [9]. Moreover, genes with aberrant DNA methylation were associated with the diagnosis of cancer and treatment prediction and prognostication [10–13], and aberrant DNA methylation was present in the early tumor stage of many cancer types [11, 12]. In addition, aberrantly methylated DNA was found in different types of samples, such as plasma, urine, semen, and stool, indicating that DNA methylation had the potential to become a non-invasive diagnostic biomarker which may facilitate the early diagnosis of NSCLC [11, 14, 15].
However, the value of the detection of gene methylation in blood samples as a non-invasive biomarker in NSCLC remains to be elucidated. Therefore, in our analysis, we aimed to establish a list of genes with altered methylation in NSCLC in an attempt to provide molecular clues for their use as potential biomarkers.
RESULTS
Study characteristics
A total of 5,572 articles were initially identified by a search of PubMed, EMBASE, CNKI and Wanfang literature databases. Among the retrieved the titles, abstracts, and full-text papers, a total of 37 case-control studies published finally met the inclusion criteria based on the use of blood samples in NSCLC. We determined the correlation between aberrantly methylated genes in blood samples and the risk of NSCLC. All eligible studies met a score of equal to or above 5. The process of study selection is summarized in Figure 1, and the detailed characteristics of the included studies are listed in Supplementary Table 1.
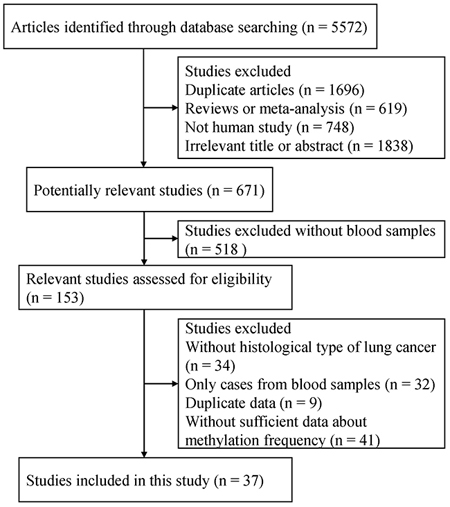
Figure 1: Flow chart of study selection procedure.
Association between aberrantly methylated genes in the blood and NSCLC
For the analyses of more than three studies on the methylation of P16, DAPK, and MGMT (I2 < 50%, P ≥ 0.1), the fixed-effects model was used. The random effects models were applied for methylated RASSF1A, APC, RARβ, CDH13, and FHIT (I2 > 50%, P < 0.1).
The results showed that the methylated P16 (OR = 17.28, P < 0.001), RASSF1A (OR = 16.41, P < 0.001), APC (OR = 14.01, P < 0.001), RARβ (OR = 7.94, P < 0.001), DAPK (OR = 30.78, P < 0.001), CDH13 (OR = 12.63, P = 0.001) and MGMT (OR = 15.29, P < 0.001) genes were significantly associated with NSCLC in the blood samples (Figures 2–8). No significant association involving 290 patients with NSCLC and 186 controls was found between FHIT methylation and NSCLC (P = 0.073) (Table 1).
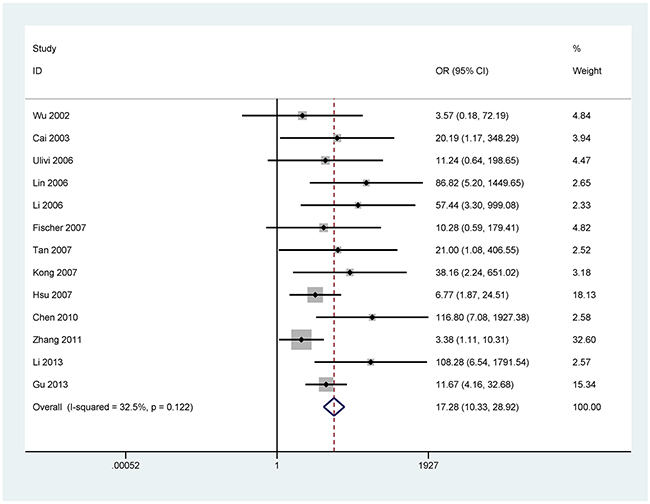
Figure 2: Forest plot of the association between P16 methylation and NSCLC.
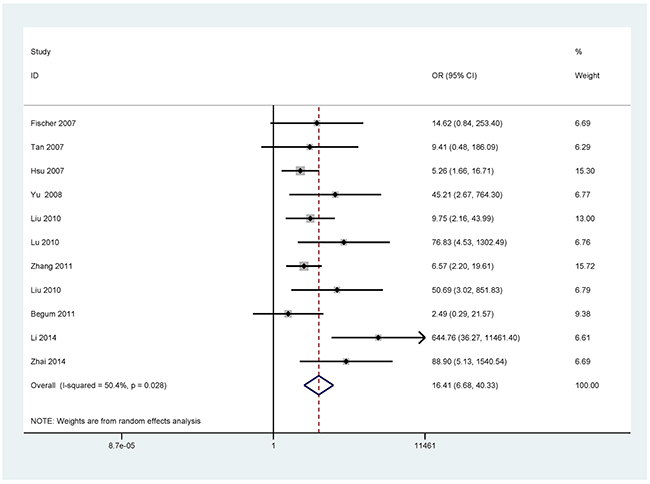
Figure 3: Forest plot of the association between RASSF1A methylation and NSCLC.
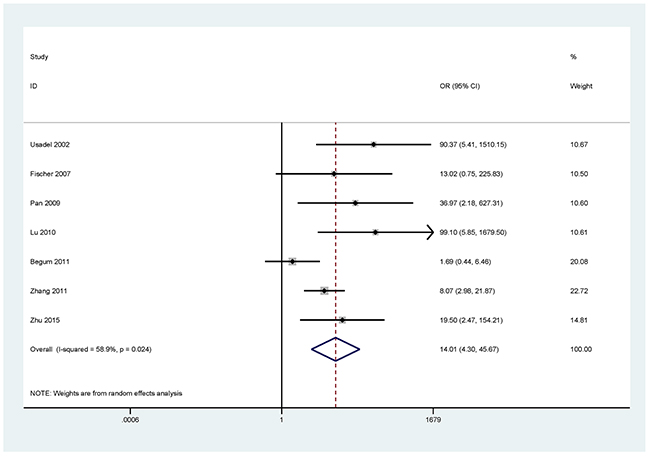
Figure 4: Forest plot of the association between APC methylation and NSCLC.
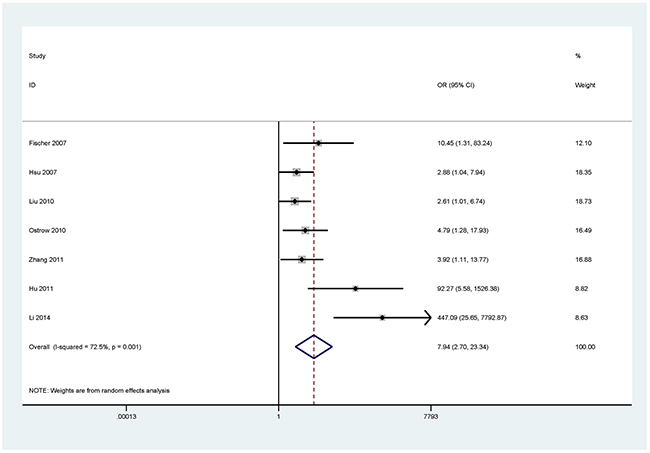
Figure 5: Forest plot of the association between RARβ methylation and NSCLC.
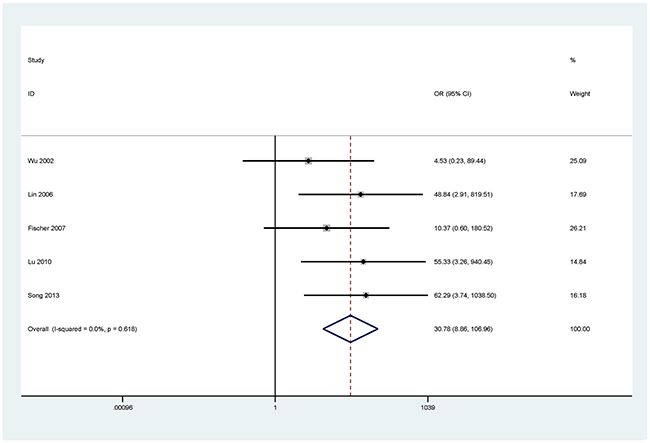
Figure 6: Forest plot of the association between DAPK methylation and NSCLC.
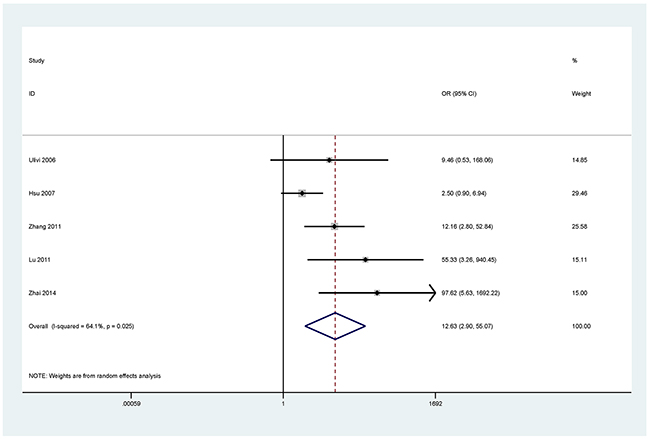
Figure 7: Forest plot of the association between CDH13 methylation and NSCLC.
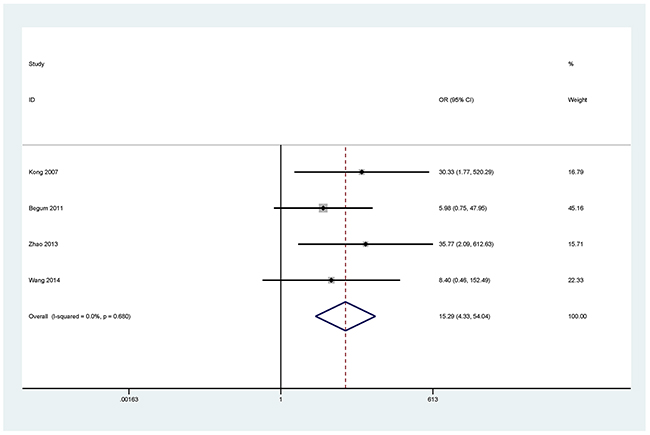
Figure 8: Forest plot of the association between MGMT methylation and NSCLC.
Table 1: Associations between 28 methylated genes detected in blood samples and NSCLC
Gene |
Studies |
Overall OR (95% CI) |
I2; P |
P-value |
Cases |
Controls |
P (Egger’s test) |
|---|---|---|---|---|---|---|---|
P16 |
13 |
17.28 (10.33–28.92) |
32.5%; 0.122 |
< 0.001 |
903 |
587 |
0.018 |
RASSF1A |
11 |
16.41 (6.68–40.33) |
50.4%; 0.028 |
< 0.001 |
770 |
444 |
0.016 |
APC |
7 |
14.01 (4.30–45.67) |
58.9%; 0.024 |
< 0.001 |
563 |
314 |
0.088 |
RARB |
7 |
7.94 (2.70–23.34) |
72.5%; 0.001 |
< 0.001 |
591 |
436 |
0.001 |
DAPK |
5 |
30.78 (8.86–106.96) |
0.0%; 0.618 |
< 0.001 |
385 |
237 |
NA |
CDH13 |
5 |
12.63 (2.90–55.07) |
64.1%; 0.025 |
0.001 |
338 |
187 |
NA |
FHIT |
4 |
4.23 (0.87–20.49) |
79.3%; 0.002 |
0.073 |
290 |
186 |
NA |
MGMT |
4 |
15.29 ( 4.33–54.04) |
0.0%; 0.680 |
< 0.001 |
267 |
129 |
NA |
DCC |
3 |
11.44 ( 5.09 - 25.71) |
0.0%; 0.531 |
< 0.001 |
205 |
180 |
NA |
P14 |
2 |
8.95 (1.70–47.19) |
0.0%; 0.738 |
0.01 |
199 |
34 |
NA |
CDH1 |
2 |
3.97 (1.66–9.46) |
0.0%; 0.795 |
0.002 |
96 |
40 |
NA |
RUNX3 |
2 |
45.64 (5.89–353.72) |
0.0%; 0.654 |
< 0.001 |
82 |
56 |
NA |
BLU |
2 |
1.63 (0.95–2.78) |
12.1%; 0.286 |
0.073 |
143 |
116 |
NA |
SFRP1 |
1 |
7.43 (1.69–32.68) |
NA; NA |
0.008 |
110 |
50 |
NA |
TMS1 |
1 |
27.80 (1.61–479.59) |
NA; NA |
0.022 |
62 |
46 |
NA |
TIMP3 |
1 |
35.87 (2.12–607.48) |
NA; NA |
0.013 |
110 |
110 |
NA |
DLEC1 |
1 |
16.73 (2.21–126.86) |
NA; NA |
0.006 |
110 |
50 |
NA |
EFEMP1 |
1 |
4.37 (1.25–15.29) |
NA; NA |
0.021 |
110 |
50 |
NA |
Dkk3 |
1 |
27.43 (7.93–94.86) |
NA; NA |
< 0.001 |
75 |
75 |
NA |
BRMS1 |
1 |
45.16 (2.60–784.96) |
NA; NA |
0.009 |
48 |
24 |
NA |
KLK10 |
1 |
9.85 (2.26–42.96) |
NA; NA |
0.002 |
110 |
50 |
NA |
RASSF2 |
1 |
59.18 (3.48–1005.20) |
NA; NA |
0.005 |
62 |
46 |
NA |
DCLK1 |
1 |
6.991 (2.74–17.82) |
NA; NA |
< 0.001 |
46 |
95 |
NA |
AIM1 |
1 |
6.55 (0.82 - 52.21) |
NA; NA |
0.076 |
76 |
30 |
NA |
hOGG1 |
1 |
3.58 (1.34–9.58) |
NA; NA |
0.011 |
80 |
80 |
NA |
KIF1A |
1 |
18.02 (2.29–141.69) |
NA; NA |
0.006 |
70 |
80 |
NA |
NISCH |
1 |
2.12 (1.06–4.25) |
NA; NA |
0.034 |
70 |
80 |
NA |
SEMA3B |
1 |
11.53 (4.73–28.10) |
NA; NA |
< 0.001 |
80 |
80 |
NA |
Abbreviations: NA: not applicable.
For the remaining 20 genes investigated in less than four studies, 18 genes were shown to be correlated with NSCLC (Table 1), more studies are needed to confirm these results of gene methylation with fewer four studies in the future.
Subgroup analyses
Subgroup analyses of the methylated P16, RASSF1A, APC, and RARβ were performed by methylation detection methods and ethnic population (Caucasians and Asians) (Table 2).
Table 2: Subgroup analyses of the associations between P16, RASSF1A, APC, and RARβ genes and NSCLC
Gene |
Studies |
Overall OR 95% CI |
I2; P |
P value |
Cases |
Controls |
|---|---|---|---|---|---|---|
P16 |
||||||
Method |
||||||
MSP |
10 |
13.09 (5.77–29.71) |
29.0%; 0.178 |
< 0.001 |
655 |
386 |
nMSP |
2 |
67.21 ( 9.15–493.61) |
0.0%; 0.578 |
< 0.001 |
185 |
165 |
qMSP |
1 |
6.77 (1.87–24.51) |
NA; NA |
0.004 |
63 |
36 |
Race |
||||||
Caucasians |
2 |
14.28 (6.93–29.42) |
0.0%; 0.965 |
0.022 |
146 |
29 |
Asians |
11 |
15.92 (6.88–36.83) |
44.5%; 0.055 |
< 0.001 |
757 |
558 |
RASSF1A |
||||||
Method |
||||||
MSP |
7 |
22.17 (6.77–72.60) |
50.9%; 0.057 |
< 0.001 |
473 |
300 |
nMSP |
2 |
12.00 (1.12–129.03) |
61.8%; 0.105 |
0.04 |
159 |
68 |
qMSP |
1 |
2.49 (0.29–21.57) |
NA; NA |
0.409 |
76 |
30 |
PCR |
1 |
76.83 (4.53–1302.49) |
NA; NA |
0.003 |
62 |
46 |
Race |
||||||
Caucasians |
2 |
4.77 (0.83–27.50) |
2.8%; 0.310 |
0.08 |
166 |
44 |
Asians |
9 |
21.15 (7.62–58.71) |
55.6%; 0.021 |
< 0.001 |
604 |
400 |
APC |
||||||
Method |
||||||
MSP |
3 |
10.32 (4.38–24.32) |
0.0%; 0.732 |
< 0.001 |
260 |
134 |
qMSP |
3 |
14.85 (0.68–322.24) |
81.4%; 0.005 |
0.086 |
241 |
134 |
PCR |
1 |
99.10 (5.85–1679.50) |
NA; NA |
0.001 |
62 |
46 |
Race |
||||||
Caucasians |
3 |
10.44 (0.62–174.92) |
77.7%; 0.011 |
0.103 |
256 |
94 |
Asians |
4 |
17.17 (7.79–37.87) |
24.5%; 0.264 |
< 0.001 |
307 |
220 |
RARβ |
||||||
Method |
||||||
MSP |
4 |
10.02 (1.75–57.37) |
79.5%; 0.002 |
0.01 |
338 |
200 |
nMSP |
2 |
13.65 (0. –805.76) |
86.8%; 0.006 |
0.209 |
183 |
156 |
qMSP |
1 |
4.79 (1.28–17.93) |
NA; NA |
0.02 |
70 |
80 |
Race |
||||||
Caucasians |
2 |
5.99 (1.97–18.27) |
0.0%; 0.526 |
0.002 |
162 |
94 |
Asians |
5 |
7.94 (2.70–23.34) |
81.7%; < 0.001 |
0.003 |
429 |
342 |
Abbreviations: NA: not applicable; MSP: methylation specific PCR; PCR: polymerase chain reaction; qMSP; quantitative methylation specific PCR; nMSP: nested methylation specific PCR.
P16 methylation was found to be significantly correlated with NSCLC in the MSP, nMSP, and qMSP subgroups (all P < 0.01). On the other hand, the subgroup analysis by ethnicity indicated that the methylation of the P16 gene was significantly associated with NSCLC in Caucasians and Asians (P < 0.05).
Varying OR values of RASSF1A methylation were obtained in the subgroups of the different methods (MSP: OR = 22.17, P < 0.001; nMSP: OR = 12.00, P = 0.04; qMSP: P = 0.409; PCR: OR = 76.83, P = 0.003). It is noteworthy that the association between RASSF1A methylation and NSCLC tended to be stronger in Asians (OR = 21.15, P < 0.001) than in Caucasians (P = 0.08).
Based on the subgroup analysis by methods, significant association between APC methylation status and NSCLC was found in the MSP and PCR subgroups (OR = 10.32, P < 0.001; OR = 99.10, P = 0.001; respectively), but not in the qMSP subgroup (P = 0.086). The further subgroup analysis by ethnicity indicated that APC methylation was significantly associated with NSCLC in the Asian population (OR = 17.17, P < 0.001), but not in Caucasian population (P = 0.103).
A statistically significant relationship was found between RARβ methylation status and NSCLC in the MSP and qMSP method subgroups (OR = 10.02, P = 0.01; OR = 4.79, P = 0.02; respectively), but not for the nMSP method (P = 0.209). The subgroup analysis by ethnicity revealed that the methylation status of RARβ was significantly associated with NSCLC in both the Asian and Caucasian populations (OR = 7.94, P = 0.003; OR = 5.99, P = 0.002; respectively).
Meta-regression
Considering the evidence of heterogeneity in the meta-analysis of RASSF1A methylation reported in 11 studies (I2 = 50.4%, P = 0.028), meta-regression analyses were performed to detect the potential sources of heterogeneity in the methylation detection methods, ethnicity (Caucasians and Asians), and age status (60 or more years: elderly patients; 60 or less years: young patients) (Table 3). The testing method and ethnicity could not explain the sources of heterogeneity (P > 0.1); however, the age factor might have been a possible source of heterogeneity (P = 0.025).
Table 3: Meta-regression analysis of the RASSF1A methylation
Subgroup |
Coefficient (95% CI) |
t |
P-value |
|---|---|---|---|
Method |
-0.901 (-2.467, 0.665) |
-1.33 |
0.221 |
Ethnicity |
0.441 (-2.727, 3.610) |
0.32 |
0.756 |
Age |
2.752 (0.458, 5.046) |
2.84 |
0.025 |
Sensitivity analyses
Sensitivity analyses were conducted to assess the stability of the overall effects and the change of heterogeneity by omitting a single study in the meta-analysis of the methylated RASSF1A,APC, RARβ, and CDH13 (Supplementary Figure 1). The heterogeneity of the RASSF1A methylation status was significantly decreased by deleting a single study by Li et al. (2014), which caused a change of the P-value of the heterogeneity from 0.028 to 0.258. The pooled OR did not substantially change, with a range from 16.41 (95% CI = 6.68– 40.33) to 13.14 (95% CI = 7.55–22.86). The omission of another individual study (Begum et al., 2011) increased the P-value of heterogeneity of the APC methylation status from 0.024 to 0.310, with a rise in the pooled OR from 14.01 (95% CI = 4.30– 45.67) to 20.88 (95% CI = 10.04–43.44). The heterogeneity of the methylated RARβ was significantly decreased by omitting a single study by Li et al. (2014), with a change of P-value of the heterogeneity from 0.001 to 0.129. The overall OR did not significantly change, ranging from 7.94 (95% CI = 2.70– 23.34) to 5.52 (95% CI = 3.37– 9.04). When the study of Hsuet al, (2007) was excluded, the pooled OR remained significant, with a range from 12.63 (95% CI = 2.90– 55.07) to 23.30 (95% CI = 8.03– 67.65), and a change of the respective P-value of the heterogeneity from 0.025 to 0.483 was observed.
The sensitivity analysis suggested that our results for methylated RASSF1A, APC, RARβ, and CDH13 were stable.
Publication bias
Egger’s test was performed to estimate the possible publication bias for the methylated P16, RASSF1A, APC, and RARβ genes investigated in more than five studies (Supplementary Figure 2). The results of the Egger’s test provided statistical data of funnel plot symmetry, which suggested the absence of publication bias concerning the APC methylation (P = 0.088). There was evidence of publication bias for the methylation status of P16, RASSF1A, and RARβ (P < 0.05). Further, we removed one study or two studies to reevaluate whether the potential publication bias for the methylated P16 and RASSF1A genes was reduced. Our results showed that the pooled results regarding P16 and RASSF1A genes did not sustainably change, and no obvious evidence of publication bias was present (Supplementary Figure 3). We further assessed the change of the publication bias by deleting one study or two studies on the P16 and RASSF1A genes. The pooled results of the P16 and RASSF1A genes remained statistically significant, with no substantial evidence of publication bias, indicating credibility. However, a reason for the potential publication bias in the analysis of the low number of studies and/or small sample sizes might have been the unequal comparison of the sample sizes of cases and controls. Thus, we attempted to minimize the bias by using the above-mentioned databases as comprehensively as possible.
Relation of methylated P16, RASSF1A, APC, RARβ, DAPK, CDH13, and MGMT genes to clinicopathological features of NSCLC
We analyzed whether P16, RASSF1A, APC, RARβ, DAPK, CDH13, and MGMT methylation status was correlated with clinicopathological characteristics of NSCLC, including age (≥60 years vs. ≤ 60years), gender (male vs. female), smoking behavior (smoking vs. nonsmoking), tumor stage (stage 0–2 vs. stage 3–4), and tumor histology (SCC vs. AC). As depicted in Supplementary Figure 4, the methylation status of P16, RASSF1A, APC, RARβ, DAPK, CDH13, or MGMT was not associated with these clinicopathological features (P > 0.05), suggesting that the mentioned genes manifested similar methylation properties in the patients examined.
DISCUSSION
Tumor-specific DNA methylation can be considered a powerful tool for future cancer detection and diagnosis in blood samples in clinical settings [13, 16, 17]. The present analysis was performed to evaluate the potential value of tumor suppressor genes methylation as a feasible biomarker for the detection and screening of NSCLC in blood samples, more specifically with a focus on eight tumor suppressor genes investigated in more than three studies.
CDKN2A, also known as p16/Ink4a and p14/ARF, is one of the major effectors that participate in the oncogenically induced senescence [18–20]. RASSF1A may be associated with the transmission of inhibitory growth signals. It is inactivated in the presence of a tumor, and its methylation was detected in many human cancers [21, 22]. APC involves in the cell migration and adhesion, transcriptional activation, and apoptosis [23]. Its expression was found to be associated with colorectal cancer [24]. The retinoic acid receptor-β gene (RARβ) is shown to be associated with the embryonal development, cell growth, and differentiation [25, 26]. The silencing of the RARβ gene expression may lead to resistance to retinoic acid treatment [27]. DAPK encodes a cytoskeletal-associated protein kinase (DAPK) that can have some functions in apoptosis and tumor suppression [28, 29]. The downregulation of CDH13 was linked to a poorer prognosis in patients with various cancer types, including lung cancer [30]. CDH13 re-expression can reduce tumor growth by inhibiting cell proliferation and invasiveness [30, 31]. MGMT encodes O6-methylguanine-DNA methyltransferase (MGMT) that is a DNA damage reversal protein [32]. MGMT protect the cell from cancer by removing adducts from the O6 position of guanine [33]. Some previous studies have shown that some genes with methylation status can become useful biomarkers for NSCLC diagnosis in the mixed samples [34–36]. However, the usefulness of the detection of gene methylation in blood samples from NSCLC patients as a noninvasive biomarker remains to be elucidated.
Increasing evidence suggests that gene methylation may become a potential diagnostic biomarker in NSCLC (i.e., P16, RASSF1A, APC, RARβ, DAPK and CDH13) [37, 38], and serve as a prognostic biomarker such as P16 and RASSF1A [39, 40]. Our findings demonstrated that the methylation status of P16, RASSF1A, APC, RARβ, DAPK, CDH13, and MGMT in the blood was correlated with the availability of NSCLC. In addition, we found that methylated genes with good sensitivity and specificity had differently diagnostic levels for NSCLC, such as P16 gene (sensitivity: 62.5%, specificity: 87.5%) [41], RASSF1A (sensitivity: 85.7%, specificity: 100%) [42], APC (sensitivity: 51.6%, specificity: 100%) [43], RARβ (sensitivity: 80.4%, specificity: 100%) [42], DAPK (sensitivity: 37.1%, specificity: 100%) [44], CDH13 (sensitivity: 54.8%, specificity: 100%) [45], and MGMT (sensitivity: 32.8%, specificity: 100%) [46], which suggested that RASSF1A and RARβ genes can be better promising noninvasive biomarkers for the clinical detection and screening of NSCLC. Further, we analyzed whether the methylation status of P16, RASSF1A, APC, RARβ, DAPK, CDH13, and MGMT there were differences in the characteristics of gene methylation in different tumor stages (early stage vs. advanced stage) and tumor histotypes (SCC vs. AC). The results showed that the methylation features of these genes could not facilitate the distinction between early NSCLC and advanced NSCLC, nor between AC, and SCC. One study reported that RASSF1A methylation was correlated with overall survival in blood samples of patients with NSCLC, but other genes (P16, RARβ and DAPK) were not found to be linked to overall survival [38]. Two studies reported that APC methylation was not associated with survival in blood samples [38, 47].
The current study revealed that the methylation status of FHIT detected in blood samples was not associated with NSCLC. In contrast to a previous meta-analysis conducted by Yan et al. [48], this study found that FHIT methylation was correlated with NSCLC in tissue samples, but this meta-analysis did not analyze whether FHIT methylation was linked to NSCLC in blood samples. Additional studies with larger subjects are necessary to further assess the role of FHIT methylation in blood samples of patients with NSCLC.
The subgroup analysis by ethnicity regarding the methylation of P16, RASSF1A, APC, and RARβ genes showed that the methylation of the P16 and RARβ genes was associated with the occurrence of NSCLC in the Asian and Caucasian populations with, suggesting that the methylation of P16 and RARβ genes can be used as biomarkers for NSCLC detection in both ethnical groups. Methylated RASSF1A and APC were correlated with NSCLC in the Asian population, but not in the Caucasian population. Nevertheless, this finding could be due to the small sample sizes used in this analysis, especially for the Caucasian population, and thus more studies with larger sample sizes are needed to confirm that result in blood samples from Caucasians with NSCLC.
Further, subgroup analyses by detection methods of P16, RASSF1A, APC, and RARβ methylation were conducted. Association between NSCLC and the MSP method was found, suggesting that MSP (n ≥ 3 studies per gene) was a sensitive method for detection of methylated P16, RASSF1A, APC, and RARβ. The qMSP method had sensitivity for the detection of P16 and RARβ, but not for RASSF1A and APC. On the other hand, the nMSP method was sensitive to identification of P16 and RASSF1A methylation, but not to that of RARβ. In addition, we found that PCR was sensitive to the methylation of RASSF1A and APC. However, the findings of the subgroup analyses for qMSP, nMSP, and PCR should be interpreted cautiously due to the small sample sizes of the studies included herein.
The meta-regression analysis of RASSF1A methylation revealed that testing method and ethnicity failed to the sources of heterogeneity, but age factor can be a potential source. Sensitivity analyses were also conducted for the RASSF1A, APC, RARβ, and CDH13 genes with significant heterogeneity. The data based on the omission of one study indicated that the pooled results for the genes investigated remained statistically significant, with absence of heterogeneity, confirming the stability of our findings.
Full-text papers with eligible studies published in English or Chinese were included in this analysis. Nonetheless, investigation in other languages and of other types, such as unpublished studies and conference abstracts, were excluded due to the insufficient availability of information. In addition, studies with positive results are more often and more easily published than those with negative results, which might have contributed to the omission of some examinations. Therefore, in the present meta-analyses, publication bias was detected for the genes investigated in fewer studies and/or such with small sample sizes. Further large-scale studies and well-matched research design with equal comparisons between cases and controls are required in the future to confirm the role of gene methylation as a noninvasive biomarker for NSCLC detection and screening in blood samples, especially for FHIT.
Some other limitations of the present research should be carefully considered. First, owing to the limited number of studies with obvious heterogeneity, meta-regression analysis could not be performed for the methylated APC and RARβ. Moreover, meta-regression and subgroup analyses were not conducted for CDH13 methylation. Second, the results of some genes methylation and a part of the subgroup analyses should be interpreted with caution as only one or two studies with small subjects were included in our analysis. Finally, gene methylation is shown to be correlated with cigarette smoking factor in mixed samples of patients with NSCLC, including CDKN2A, RASSF1, MGMT, RARB, DAPK, WIF1 and FHIT [35]. Based on the small sample sizes, our study showed that theses methylated genes was not correlated with smoking behavior in the blood. More large-scale studies are essential to further validate our findings in blood samples of patients with NSCLC.
In conclusion, the use of the P16, RASSF1A, APC, RARβ, DAPK, CDH13, and MGMT methylation are exceedingly promising and could become useful biomarkers for blood-based screening and detection of NSCLC in the clinical practice. More studies with larger numbers of blood samples are required to further confirm the diagnostic and screening value of gene methylation in NSCLC.
MATERIALS AND METHODS
Literature selection
A comprehensive search was performed in PubMed, EMBASE, CNKI and Wanfang literature databases up to November 26, 2015, using the following search keywords and terms: (lung cancer OR lung tumor OR lung carcinoma OR lung neoplasm OR pulmonary carcinoma) AND (methylation OR epigenetic silencing). No language restriction was employed, and the titles and abstracts were independently assessed by two authors.
The eligible studies had to meet the following criteria: (1) NSCLC patients had to be diagnosed by histopathological examination; (2) gene methylation was evaluated in blood samples in case-control studies, and the control blood samples were collected from individuals with no history of cancer or from healthy subjects; (3) the frequency of gene methylation had to be sufficient to evaluate the associations between gene methylation and NSCLC; (4) the studies were published in English or Chinese. In the case of the presence of more than one published article that had used the same sample data, only the most recent paper or the publication with the larger sample size was selected. Only studies containing data on the histological type of lung cancer were included for inclusion in the current analysis.
Data extraction and quality assessment
The data extracted from the articles included the following information: the names of the first author, publication year, country, ethnicity, histology, method for the detection of methylation, methylation status. Information on patients’ characteristics was also collected, such as age, gender status, smoking behavior, tumor stage, and pathological subtypes. A cancer stage of ≤ 2 was defined as early, and stages of 3 and 4 were referred to as advanced. The quality assessment of the included studies was performed based on the Newcastle–Ottawa Scale (NOS), with a range from 0 to 9. Each study with a NOS score of more than or equal to six was considered as high quality, and a NOS score of less than or equal to three was considered as low quality [49, 50] (Supplementary Table 1).
Data analysis
The pooled odds ratio (OR) with the corresponding 95% confidence interval (95% CI) was calculated using Stata software (STATA version 12.0, Stata Corporation, College Station, TX, USA) to evaluate the relationships between gene methylation and risk of NSCLC. The statistical heterogeneity among the studies included in the meta-analysis was assessed by Cochran’s Q statistic and I2 test [51]. The fixed-effect model was applied for the meta-analysis with moderate or lack of heterogeneity (I2 < 50% and P ≥ 0.1); otherwise, the random-effects model was employed [52, 53]. Meta-regression analysis was used to identify the potential sources of heterogeneity. Subgroup analyses were conducted to find the variations among the different subgroups. Sensitivity analysis was also performed by omitting one study to assess the influence of an individual study on the overall OR [54]. P < 0.05 was considered significant. Egger’s test was used to estimate the potential publication bias for the methylated genes investigated in more than five studies [55].
Authors’ contributions
YQL, BHW, and LYZ conceived and designed the study. YQL, BHW, JZH, HLZ, LZ, and LYZ performed the study. BHW and JZH analyzed the data, whereas. BHW and JZH wrote the paper. YQL critically revised the manuscript.
CONFLICTS OF INTEREST
We declare no competing financial interests.
REFERENCES
1. Carter D. New global survey shows an increasing cancer burden. Am J Nurs. 2014; 114:17.
2. Pao W, Chmielecki J. Rational, biologically based treatment of EGFR-mutant non-small-cell lung cancer. Nat Rev Cancer. 2010; 10:760-774.
3. Takeda K, Hida T, Sato T, Ando M, Seto T, Satouchi M, Ichinose Y, Katakami N, Yamamoto N, Kudoh S, Sasaki J, Matsui K, Takayama K, et al. Randomized phase III trial of platinum-doublet chemotherapy followed by gefitinib compared with continued platinum-doublet chemotherapy in Japanese patients with advanced non-small-cell lung cancer: results of a west Japan thoracic oncology group trial (WJTOG0203). J Clin Oncol. 2010; 28:753-760.
4. Fujikawa A, Takiguchi Y, Mizuno S, Uruma T, Suzuki K, Nagao K, Niijima M, Edo H, Hino M, Kuriyama T. Lung cancer screening--comparison of computed tomography and X-ray. Lung Cancer. 2008; 61:195-201.
5. Backhus LM, Farjah F, Zeliadt SB, Varghese TK, Cheng A, Kessler L, Au DH, Flum DR. Predictors of imaging surveillance for surgically treated early-stage lung cancer. Ann Thorac Surg. 2014; 98:1944-1951; discussion 1951-1942.
6. Rauscher I, Eiber M, Furst S, Souvatzoglou M, Nekolla SG, Ziegler SI, Rummeny EJ, Schwaiger M, Beer AJ. PET/MR imaging in the detection and characterization of pulmonary lesions: technical and diagnostic evaluation in comparison to PET/CT. J Nucl Med. 2014; 55:724-729.
7. Cedres S, Nunez I, Longo M, Martinez P, Checa E, Torrejon D, Felip E. Serum tumor markers CEA, CYFRA21-1, and CA-125 are associated with worse prognosis in advanced non-small-cell lung cancer (NSCLC). Clin Lung Cancer. 2011; 12:172-179.
8. Chen F, Li WM, Wang DM, Gao SS, Bao Y, Chen WB, Liu D. Clinical value of combined detection of serum tumor markers in lung cancer diagnosis. [Article in Chinese] Sichuan Da Xue Xue Bao Yi Xue Ban. 2008; 39:832-835.
9. Hanahan D, Weinberg RA. Hallmarks of cancer: the next generation. Cell. 2011; 144:646-674.
10. Mulero-Navarro S, Esteller M. Epigenetic biomarkers for human cancer: the time is now. Crit Rev Oncol Hematol. 2008; 68:1-11.
11. Paluszczak J, Baer-Dubowska W. Epigenetic diagnostics of cancer--the application of DNA methylation markers. J Appl Genet. 2006; 47:365-375.
12. Miyamoto K, Ushijima T. Diagnostic and therapeutic applications of epigenetics. Jpn J Clin Oncol. 2005; 35:293-301.
13. Laird PW. The power and the promise of DNA methylation markers. Nat Rev Cancer. 2003; 3:253-266.
14. Dai WM, Yang B, Chu XY, Wang YQ, Zhao M, Chen L, Zhang GQ. Association between folate intake, serum folate levels and the risk of lung cancer: a systematic review and meta-analysis. Chin Med J (Engl). 2013; 126:1957-1964.
15. Shivapurkar N, Gazdar AF. DNA methylation based biomarkers in non-invasive cancer screening. Curr Mol Med. 2010; 10:123-132.
16. Warton K, Samimi G. Methylation of cell-free circulating DNA in the diagnosis of cancer. Front Mol Biosci. 2015; 2:13.
17. Guzzetta AA, Pisanic Ii TR, Sharma P, Yi JM, Stark A, Wang TH, Ahuja N. The promise of methylation on beads for cancer detection and treatment. Expert Rev Mol Diagn. 2014; 14:845-852.
18. Zhang HS, Postigo AA, Dean DC. Active transcriptional repression by the Rb-E2F complex mediates G1 arrest triggered by p16INK4a, TGFbeta, and contact inhibition. Cell. 1999; 97:53-61.
19. Koh J, Enders GH, Dynlacht BD, Harlow E. Tumour-derived p16 alleles encoding proteins defective in cell-cycle inhibition. Nature. 1995; 375:506-510.
20. Lee MO, Lee HJ, Kim MA, Kim EK, Lee JH, Heo JH, Lee SH, Cho SH, Fornace AJ Jr., Jeong HC, Cha HJ. p16Ink4a suppression of lung adenocarcinoma by Bmi-1 in the presence of p38 activation. J Thorac Oncol. 2011; 6:423-431.
21. Liu L, Tommasi S, Lee DH, Dammann R, Pfeifer GP. Control of microtubule stability by the RASSF1A tumor suppressor. Oncogene. 2003; 22:8125-8136.
22. Pfeifer GP, Dammann R. Methylation of the tumor suppressor gene RASSF1A in human tumors. Biochemistry (Mosc). 2005; 70:576-583.
23. Fodde R, Kuipers J, Rosenberg C, Smits R, Kielman M, Gaspar C, van Es JH, Breukel C, Wiegant J, Giles RH, Clevers H. Mutations in the APC tumour suppressor gene cause chromosomal instability. Nat Cell Biol. 2001; 3:433-438.
24. Kamory E, Olasz J, Csuka O. Somatic APC inactivation mechanisms in sporadic colorectal cancer cases in Hungary. Pathol Oncol Res. 2008; 14:51-56.
25. Flamini MI, Gauna GV, Sottile ML, Nadin BS, Sanchez AM, Vargas-Roig LM. Retinoic acid reduces migration of human breast cancer cells: role of retinoic acid receptor beta. J Cell Mol Med. 2014; 18:1113-1123.
26. Ross SA, McCaffery PJ, Drager UC, De Luca LM. Retinoids in embryonal development. Physiol Rev. 2000; 80:1021-1054.
27. Bushue N, Wan YJ. Retinoid pathway and cancer therapeutics. Adv Drug Deliv Rev. 2010; 62:1285-1298.
28. de Diego I, Kuper J, Bakalova N, Kursula P, Wilmanns M. Molecular basis of the death-associated protein kinase-calcium/calmodulin regulator complex. Sci Signal. 2010; 3:ra6.
29. Lin Y, Hupp TR, Stevens C. Death-associated protein kinase (DAPK) and signal transduction: additional roles beyond cell death. FEBS J. 2010; 277:48-57.
30. Andreeva AV, Kutuzov MA. Cadherin 13 in cancer. Genes Chromosomes Cancer. 2010; 49:775-790.
31. Kuphal S, Martyn AC, Pedley J, Crowther LM, Bonazzi VF, Parsons PG, Bosserhoff AK, Hayward NK, Boyle GM. H-cadherin expression reduces invasion of malignant melanoma. Pigment Cell Melanoma Res. 2009; 22:296-306.
32. Lv J, Liu R, Li B, Qiu X, Li Q, Wang E. [MGMT expression and its relationship with efficacy of chemotherapy and prognosis in patients with non-small cell lung cancer]. Zhongguo Fei Ai Za Zhi. 2003; 6:63-66.
33. Belinsky SA, Klinge DM, Liechty KC, March TH, Kang T, Gilliland FD, Sotnic N, Adamova G, Rusinova G, Telnov V. Plutonium targets the p16 gene for inactivation by promoter hypermethylation in human lung adenocarcinoma. Carcinogenesis. 2004; 25:1063-1067.
34. Huang T, Li J, Zhang C, Hong Q, Jiang D, Ye M, Duan S. Distinguishing Lung Adenocarcinoma from Lung Squamous Cell Carcinoma by Two Hypomethylated and Three Hypermethylated Genes: A Meta-Analysis. PLoS One. 2016; 11:e0149088.
35. Huang T, Chen X, Hong Q, Deng Z, Ma H, Xin Y, Fang Y, Ye H, Wang R, Zhang C, Ye M, Duan S. Meta-analyses of gene methylation and smoking behavior in non-small cell lung cancer patients. Scientific reports. 2015; 5:8897.
36. Hua F, Fang N, Li X, Zhu S, Zhang W, Gu J. A meta-analysis of the relationship between RARbeta gene promoter methylation and non-small cell lung cancer. PLoS One. 2014; 9:e96163.
37. Zhang Y, Wang R, Song H, Huang G, Yi J, Zheng Y, Wang J, Chen L. Methylation of multiple genes as a candidate biomarker in non-small cell lung cancer. Cancer Lett. 2011; 303:21-28.
38. Fischer JR, Ohnmacht U, Rieger N, Zemaitis M, Stoffregen C, Manegold C, Lahm H. Prognostic significance of RASSF1A promoter methylation on survival of non-small cell lung cancer patients treated with gemcitabine. Lung Cancer. 2007; 56:115-123.
39. Lou-Qian Z, Rong Y, Ming L, Xin Y, Feng J, Lin X. The prognostic value of epigenetic silencing of p16 gene in NSCLC patients: a systematic review and meta-analysis. PloS one. 2013; 8:e54970.
40. Wang J, Wang B, Chen X, Bi J. The prognostic value of RASSF1A promoter hypermethylation in non-small cell lung carcinoma: a systematic review and meta-analysis. Carcinogenesis. 2011; 32:411-416.
41. Gu L, Zhao T, Lu XL, Qin GY. Identification of Epigenetic Aberrant Promoter Methylation of p16INK4A in Serum for Nonsmall Cell Lung Cancer Early Diagnosis. J Med Res. 2013; 42:163-166.
42. Li W, Deng J, Tang JX. Combined effects methylation of FHIT, RASSF1A and RARbeta genes on non-small cell lung cancer in the Chinese population. Asian Pac J Cancer Prev. 2014; 15:5233-5237.
43. Lu DG, Ji XQ, Liu W, Guo SD. Significance of adenomatous polyposis coli gene methylation in serum DNA of patients with non-small lung cancer. J Chin Physician. 2010; 12:82-84.
44. Lu DG, Ji XQ. Detection and significance of aberrant Death-Associated Protein Kinase gene methylation in the serum of non-small lung cancer patients. Shandong Med. 2010; 50:69-70.
45. Zhai X, Li SJ. Methylation of RASSF1A and CDH13 genes in individualized chemotherapy for patients with non-small cell lung cancer. Asian Pac J Cancer Prev. 2014; 15:4925-4928.
46. Wang YN, Xiao JB, Zhao Y, Yue HS, Li HL. The effect and the significance of plasma MGMT in concurrent chemoradiotherapy for locally advanced non-small cell lung cancer. Mod Oncol. 2014; 22:1856-1858.
47. Usadel H, Brabender J, Danenberg KD, Jeronimo C, Harden S, Engles J, Danenberg PV, Yang S, Sidransky D. Quantitative adenomatous polyposis coli promoter methylation analysis in tumor tissue, serum, and plasma DNA of patients with lung cancer. Cancer Res. 2002; 62:371-375.
48. Yan W, Xu N, Han X, Zhou XM, He B. The clinicopathological significance of FHIT hypermethylation in non-small cell lung cancer, a meta-analysis and literature review. Sci Rep. 2016; 6:19303.
49. Ding Y, Yang Q, Wang B, Ye G, Tong X. The Correlation of MGMT Promoter Methylation and Clinicopathological Features in Gastric Cancer: A Systematic Review and Meta-Analysis. PloS one. 2016; 11:e0165509.
50. Xiao J, Hu CP, He BX, Chen X, Lu XX, Xie MX, Li W, He SY, You SJ, Chen Q. PTEN expression is a prognostic marker for patients with non-small cell lung cancer: a systematic review and meta-analysis of the literature. Oncotarget. 2016; 7:57832-57840. doi: 10.18632/oncotarget.11068.
51. Coory MD. Comment on: Heterogeneity in meta-analysis should be expected and appropriately quantified. International journal of epidemiology. 2010; 39:932; author reply 933.
52. Higgins JP, Thompson SG, Deeks JJ, Altman DG. Measuring inconsistency in meta-analyses. BMJ. 2003; 327:557-560.
53. DerSimonian R. Meta-analysis in the design and monitoring of clinical trials. Stat Med. 1996; 15:1237-1248; discussion 1249-1252.
54. Lau J, Ioannidis JP, Schmid CH. Quantitative synthesis in systematic reviews. Ann Intern Med. 1997; 127:820-826.
55. Egger M, Davey Smith G, Schneider M, Minder C. Bias in meta-analysis detected by a simple, graphical test. Bmj. 1997; 315:629-634.