
INTRODUCTION
Gliomas are the most prevalent primary brain tumors and are highly aggressive and malignant [1]. Higher-grade gliomas are more severe and have been associated with poor prognosis in human patients [2]. The genetics, etiology, and treatment of gliomas have been well investigated [1, 3, 4], but targeted treatments are still needed to improve the prognosis [5]. Understanding the pathways that promote or reduce survival will promote the development of essential new treatments.
Isocitrate dehydrogenase (IDH1) mutations are frequent in glioma patients [6, 7]. The R132H mutation (IDH1R132H) is the most common [7, 8]. This mutation significantly improves the prognosis of patients with glioblastoma [9]. We recently showed that the IDH1 R132H mutation reduces the proliferation and invasion of human glioblastoma cells, indicating a tumor suppressor function. These effects were mediated by negatively regulating β-catenin signaling [10]. Wnt/β-catenin signaling is mediated by microRNAs (miRNAs), which regulate cancer-related genes. They have been used to classify [11] and detect [12] different cancers, and may represent therapeutic targets through oncogenic and tumor suppressor functions [13, 14].
To better understand the function of the IDH1 R132H mutation, we investigated the effect of this mutation on gene expression in glioma tissues. MiR-148a expression was enhanced and growth arrest and DNA-damage-inducible protein (GADD45A) expression was reduced in human IDH1R132H gliomas. MicroRNA 148a (MiR-148a) is aberrantly expressed in cancer tissues [15]. It is highly expressed in glioblastoma tissues [16] and regulates glioma development and progression [17, 18]. Upregulation of miR-148a promotes malignancy and reduces patient survival [16, 19]. In contrast, GADD45A reduces cancer progression by promoting apoptosis and cell-cycle arrest [20–24].
In contrast to previous reports that IDH1 R132H mutations promote survival, we confirmed that miR-148a increased cell migration and invasion by downregulating GADD45A in IDH1R132H glioblastomas. Our findings provide a deeper insight into how miR-148a is increased in IDH1R132H gliomas.
RESULTS
GADD45A and miR-148a expression in IDH1WT and IDH1R132H glioma tissues
To investigate which genes are differentially expressed in IDH1 wild type (IDH1WT) and IDH1R132H glioma cells, we performed microarray analysis (Supplementary Figure 1). GADD45A was significantly downregulated in IDH1R132H gilomas cells compared with IDH1WT cells (Supplementary gene-list.xls). Clinicopathological characteristics of 81 gliomas patients are presented in Table 1. Patients were divided into two groups based on the intensity of GADD45A immunostaining. Glioma tissue samples included 30 WHO grade I–II (15 with IDH1R132H), 26 WHO grade III (12 with IDH1R132H), and 25 WHO grade IV tumors (two with IDH1R132H). GADD45A was significantly downregulated in IDH1R132H tumors compared with IDH1WT. To confirm differential expression of GADD45A and miR-148a, we measured GADD45A and miR-148a mRNA levels in the same human glioma tissues using qRT-PCR. GADD45A expression was higher in normal tissues compared with glioma tissues (Figure 1A) and was lower in IDH1R132H glioma tissue than IDH1WT glioma (P<0.01). In contrast, miR-148a expression was lower in normal tissues compared with glioma tissues (Figure 1B) and was higher in IDH1R132H glioma tissue than IDH1WT gliomas (P<0.01).
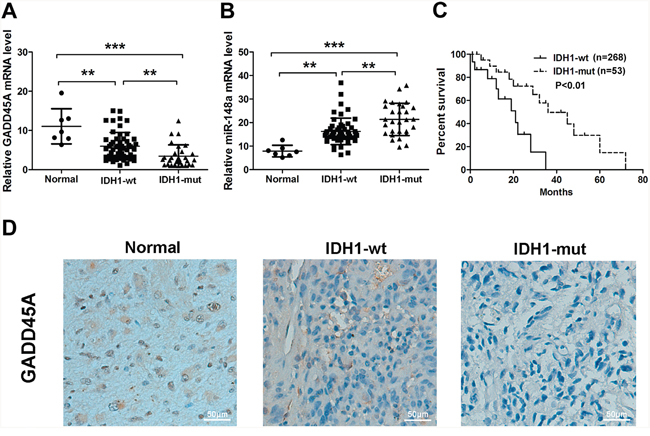
Figure 1: GADD45A and miR-148a expression in normal tissues and IDH1WT or IDH1R132H glioma tissues. (A–B) qRT-PCR analysis of GADD45A and miR-148a mRNA expression in the three tissue types. (C) Kaplan-Meier analysis of the relationship between IDH1R132H (n=53) and IDH1WT (n=268) with patient survival in glioma patients (P<0.01, Log-rank test). (D) GADD45A immunostaining revealed lower protein expression in IDH1R132H glioma tissues compared with normal tissues and IDH1WT gliomas. Magnification: ×200. **P<0.01, ***P<0.001.
Table 1: GADD45A staining and clinicopathological characteristics of 81 gliomas patients
Age (years) |
GADD45A expression |
Total |
P-value |
|
|---|---|---|---|---|
Low |
High |
|||
Negative (%) |
Positive (%) |
0.383 |
||
<50 |
30 (69.77) |
13 (30.23) |
43 |
|
≥50 |
23 (60.53) |
15 (39.47) |
38 |
|
Gender |
0.071 |
|||
Male |
31 (58.49) |
22 (41.51) |
53 |
|
Female |
22 (78.57) |
6 (21.43) |
28 |
|
WHO grade |
0.025* |
|||
Low-grade (I–II) |
15 (50.00) |
15 (50.00) |
30 |
|
High-grade (III–IV) |
38 (74.51) |
13 (25.49) |
51 |
|
IDH1 |
0.049* |
|||
Wild type |
30 (57.69) |
22 (42.31) |
52 |
|
Mutation |
23 (79.31) |
6 (20.69) |
29 |
|
* P<0.05, Chi-square test.
We analyzed data in the Cancer Genome Atlas (TCGA) to investigate the correlation between IDH1R132H and IDH1WT patient survival. Kaplan-Meier analysis showed that IDH1R132H correlated positively with overall survival (P<0.01, Log-rank test; Figure 1C).
We examined GADD45A protein expression in normal and glioma tissues by immunohistochemistry. GADD45A staining appeared to be stronger in normal tissues than glioma tissues. In addition, staining was stronger in IDH1WT than IDH1R132H glioma tissue (Figure 1D).
The IDH1 R132H mutation decreases GADD45A while increases miR148a expression in glioblastoma cell lines
We stably expressed IDH1WT or IDH1R132H in U87 cells, U251 cells, and the glioblastoma stem cell (GSC) line 0308 by lentiviral infection. Expression of IDH1WT or IDH1R132H protein was confirmed in both cell lines by western blotting. Cells infected with lentiviral particles carrying the empty vector (EV) were used as controls (Figure 2A). IDH1R132Hprotein was only detected in the IDH1R132H cell lines, and was overexpressed by 6-fold compared with EV or IDH1WT cell lines, while IDH1WT protein was detected in IDH1WT and IDH1R132H glioblastoma cells and GSCs and was overexpressed 4-fold over endogenous IDH1 (Figure 2A), these were in agreement with previous reports [10, 25]. GADD45A mRNA expression was reduced (Figure 2B) and miR-148a expression was increased in IDH1R132H cells (Figure 2C). However, expression was not different in EV and IDH1WT cells. We confirmed a reduction of GADD45A expression on the protein level in IDH1R132H cells compared with EV and IDH1WT cells by western blotting (Figure 2D).
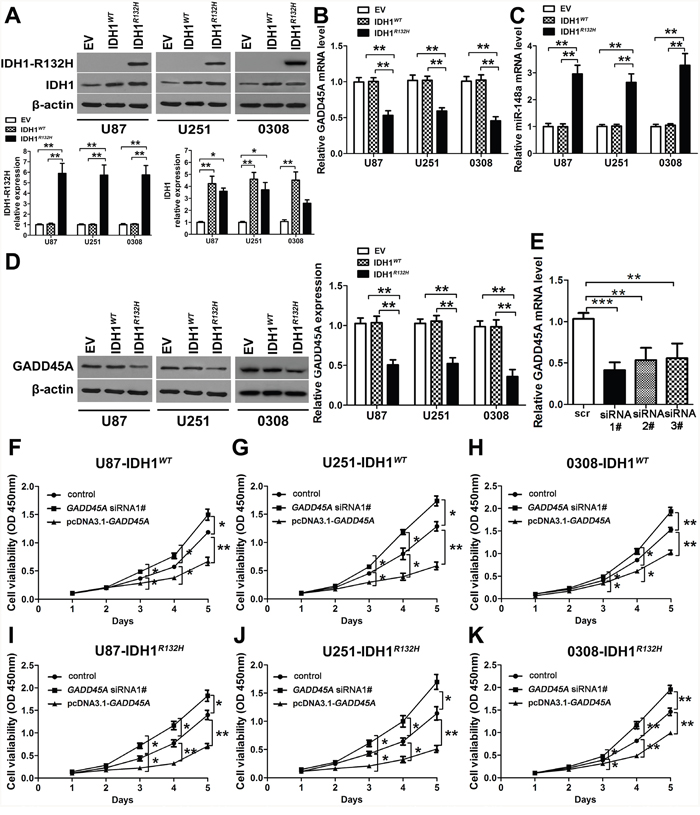
Figure 2: GADD45A inhibits cell proliferation in vitro. (A) Western blot analysis of IDH1WT and IDH1R132H protein expression in U87 and U251 glioblastoma cell lines and GSC 0308 cells after stable transfection with empty vector (EV), IDH1WT, and IDH1R132H. (B–C) qRT-PCR analysis of GADD45A and miR-148a expression in U87 and U251 glioblastoma cell lines and GSC 0308 cells stably transfected with EV, IDH1WT, and IDH1R132H. (D) Western blot analysis of GADD45A expression in U87, U251 glioblastoma cell lines and GSC 0308 stably transfected with EV, IDH1WT, or IDH1R132H. (E) GADD45A was silenced in U87 cells by three different siRNAs (siRNA#1–3) as shown by qRT-PCR. (F–K) The effect of GADD45A knockdown and overexpression on cell viability in IHD1WT or IDH1R132H U87, U251, and GSC 0308 cells. Non-transfected IHD1WT or IDH1R132H U87, U251 and 0308 cells were used as controls. *P<0.05, **P<0.01, ***P<0.001.
GADD45A expression inhibits glioblastoma cell proliferation in vitro
We knocked down GADD45A expression in glioblastoma cells using three different siRNAs (Figure 2E). GADD45A was overexpressed by introducing a pcDNA3.1-GADD45A plasmid (Figure 2F–2K). After GADD45A knockdown or overexpression, we measured cell proliferation of IDH1WT or IDH1R132H U87, U251, and 0308 cells. GADD45A knockdown increased cell proliferation while GADD45A overexpression reduced cell proliferation in IDH1WT and IDH1R132H cells (Figure 2F–2K). Taken together, these findings indicated that GADD45A inhibits glioma cell and GSC proliferation in vitro.
GADD45A expression suppresses glioblastoma tumor growth in vivo
To investigate the influence of GADD45A expression on tumor growth in vivo, we injected mice with IDH1R132HU87-Luc2 cells that stably expressed either pcDNA3.1-GADD45A or GADD45A-siRNA and monitored tumor growth. We observed pcDNA3.1-GADD45A or GADD45A-siRNA glioblastoma cells in mouse brains in vivo by bioluminescence imaging (BLI) (Figure 3A). BLI showed increasing radiance values corresponding to increasing tumor growth higher in GADD45A-siRNA tumors compared with control, while pcDNA3.1-GADD45A showed a lower radiance than control (Figure 3). Taken together, these findings suggested that GADD45A inhibits glioma tumorigenesis in vivo.
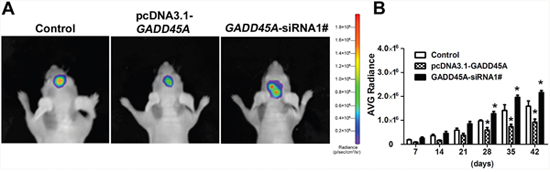
Figure 3: GADD45A inhibits tumor growth in vitro. (A) Implanted U87 MG-luc2 cells stably expressing pcDNA3.1-GADD45A or GADD45A-siRNA1# are visible in mouse brains as red–blue signals. Red indicates the highest Bioluminescence imaging (BLI) signal intensity. The BLI signal intensity increased from day 42, indicating progressive growth of the glioblastoma xenograft. (B) Average IVIS values of mice, data are expressed as mean ± SD. *P<0.05.
MiR-148a targets GADD45A
The expression patterns of GADD45A and miR-148a were opposite in human glioma tissues. To investigate whether GADD45A expression is downregulated by miR-148a, we transfected U87 cells with miR-148a mimics, mimics-NC, miR-148a inhibitor, or inhibitor-NC for 48 h. Upregulation of miR-148a expression by miR-148a mimics significantly increased miR-148a levels and miR-148a inhibitors significantly reduced miR-148a expression (Figure 4A–4B).
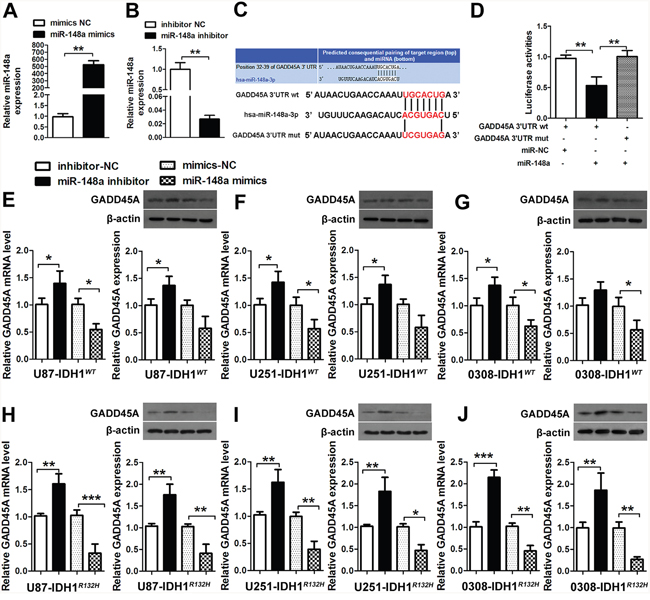
Figure 4: miR-148a binds GADD45A. (A-B) U87 cells were transfected with miR-148a mimics, mimics-NC, miR-148a inhibitor, or inhibitor-NC for 48 h. The miR-148a levels were determined by qRT-PCR. (C) The putative miR-148a binding sites in the GADD45A sequence. (D) The luciferase reporter plasmid containing wild type or mutant GADD45A 3'-UTR was co-transfected into HEK-293 T cells with miR-148a mimics or miR-148a mimics-NC. Luciferase activity was determined 48 h after transfection and was normalized to Renilla activity. (E–G) GADD45A expression in IDH1WT U87, U251, and GSC 0308 cells transfected with miR-148a inhibitor/ miR-148a inhibitor-NC, or miR-148a mimics/miR-148a mimics-NC for 48 h was measured by qRT-PCR and western blotting. (H–J) qRT-PCR analysis of GADD45A mrna and western blot analysis of GADD45A expression in IDH1R132H U87, U251, and 0308 cells transfected with miR-148a inhibitor/miR-148a inhibitor-NC or miR-148a mimics/miR-148a mimics-NC for 48 h. β-actin was used as a control. *P<0.05, **P<0.01, ***P<0.001.
To investigate the relationship between GADD45A and miR-148a, we searched for a putative miRNA binding site in the GADD45A sequence (Figure 4C). We used luciferase reporter assays to confirm regulation of GADD45A expression by miR-148a. The luciferase reporter plasmid containing wild type or mutant GADD45A 3'-UTR sequences was co-transfected into HEK-293 cells with miR-148a mimics or miR-NC (Figure 4D). Luciferase activity was measured 48 h after transfection and was normalized to Renilla activity. Luciferase activity of wild type GADD45A was significantly reduced when co-transfected with miR-148a mimics compared with miR-NC, while the activity of mutant GADD45A was not altered. These results suggested that miR-148a negatively regulates GADD45A expression by binding to a specific sequence in the 3'-UTR.
MiR-148a mimics or miR-148a inhibitors were transfected into IDH1WT and IDH1R132H U87, U251, and 0308 cells. In IDH1WT cells, miR-148a inhibitors increased GADD45A mRNA and protein expression and miR-148a mimics reduced GADD45A expression (Figure 4E–4G). In IDH1R132H glioblastoma cells, miR-148a inhibitors significantly increased and miR-148a mimics significantly decreased GADD45A expression (Figure 4H–4J). These findings provided further support that miR-148a is a direct target of GADD45A in IDH1R132H glioma cells and GSC.
GADD45A overexpression inhibits the expression of β-catenin and MMP, and the epithelial-mesenchymal transition (EMT) in glioblastoma cells
To investigate whether GADD45A inhibits expression of β-catenin, MMP-9, and EMT markers, we performed western blotting on total protein extracts from IDH1WT or IDH1R132H glioblastoma cell extracts after GADD45A overexpression. We prepared membrane, cytoplasmic, and nuclear extracts from both cell types for western blotting (Figure 5A–5C and Figure 6A–6C, respectively). GADD45A overexpression inhibited β-catenin, MMP-9, N-cadherin, and fibronectin expression in cytoplasmic and nuclear (β-catenin only) extracts. In contrast, GADD45A overexpression increased E-cadherin expression in IDH1WT and IDH1R132H glioblastoma cells (Figure 5A–5C and Figure 6A–6C). These findings suggested that GADD45A inhibits the EMT in glioblastoma cells.
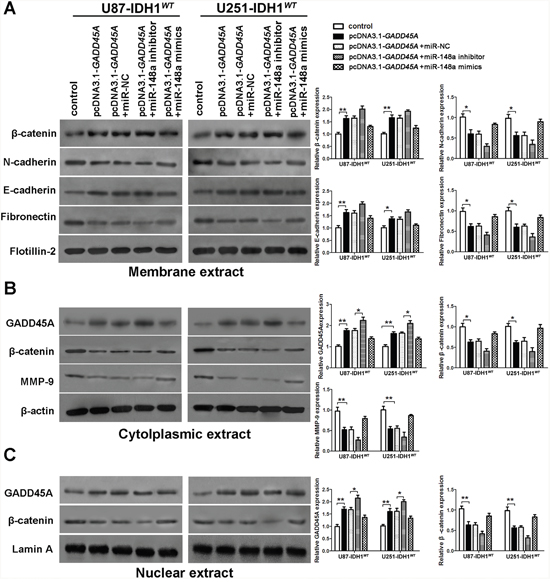
Figure 5: miR-148a partly stimulates β-catenin, MMP-9, and the epithelial-mesenchymal transition by downregulating GADD45A in IDH1WT glioblastoma cells. (A) Western blot analysis of β-catenin, N-cadherin, E-cadherin, and fibronectin expression in membrane extracts. Flotillin-2 was used as a membrane marker. (B) Western blot analysis of GADD45A, β-catenin, and MMP-9 expression in cytoplasmic extracts. β-actin was used as a control. (C) Western blot analysis of β-catenin and GADD45A expression in nuclear extracts. Lamin A was used as a control. All extracts were prepared from IDH1WT U87 and U251 glioblastoma cells. *P<0.05, **P<0.01.
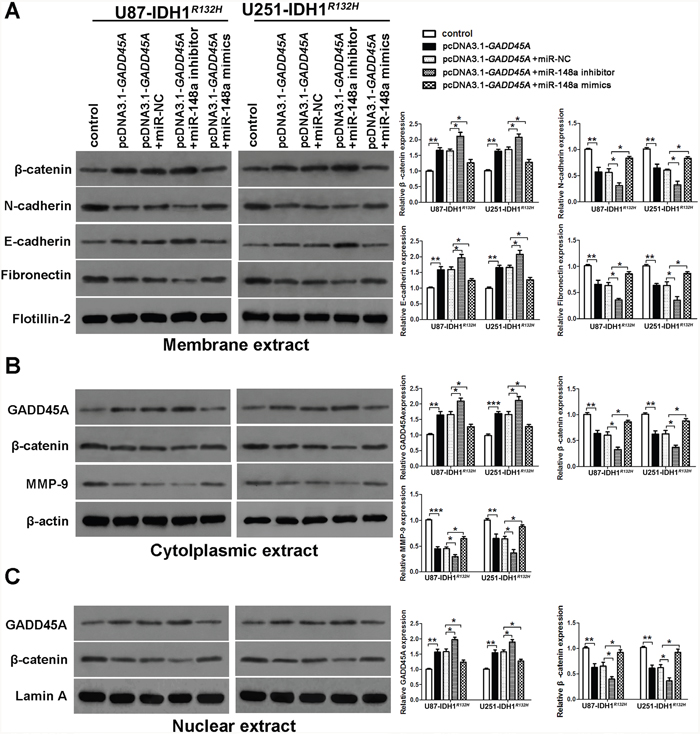
Figure 6: miR-148a stimulates β-catenin, MMP-9, and the epithelial-mesenchymal transition by inhibiting GADD45A in IDH1R132H glioblastoma cells. (A) Western blot analysis of β-catenin, N-cadherin, E-cadherin, and fibronectin expression in membrane extracts. Flotillin-2 was used as a membrane marker. (B) Western blot analysis of GADD45A, β-catenin, and MMP-9 expression in cytoplasmic extracts. β-actin was used as a control. (C) Western blot analysis of β-catenin and GADD45A expression in nuclear extracts. Lamin A was used as a control. All extracts were prepared from IDH1R132H U87 and U251 glioblastoma cells. *P<0.05, **P<0.01, ***P<0.001.
MiR-148a stimulates β-catenin, MMP-9, and EMT marker expression by downregulating GADD45A
To determine the effect of miR-148a on GADD45A-mediated control of β-catenin, MMP-9, and EMT marker expression, we upregulated or downregulated miR-148a in IDH1WT or IDH1R132H glioblastoma cells overexpressing GADD45A (Figure 5A–5C and Figure 6A–6C). Upregulation of miR-148a only significantly increases β-catenin, MMP-9, and EMT marker expression in IDH1R132H glioblastoma cells by downregulating GADD45A. These findings suggested that miR-148a inhibits GADD45A in IDH1R132H gliomas cells.
MiR-148a increases glioblastoma cell migration and invasion, and stimulates the cellular distribution of β-catenin
To investigate the effect of miR-148a on glioblastoma cell migration and invasion, we performed transwell assays. GADD45A overexpression reduced the migration and invasive ability of IDH1WT and IDH1R132H glioblastoma cells (Figure 7A and Figure 8A). The effect of GADD45A on glioblastoma cell proliferation was inhibited by miR-148a inhibitors and increased by miR-148a mimics in IDH1WT and IDH1R132H glioblastoma cells. However, this effect was only significant in IDH1R132H cells. This indicates that miR-148a significantly inhibits GADD45A to increase the migration and invasion of IDH1R132H glioma cells.
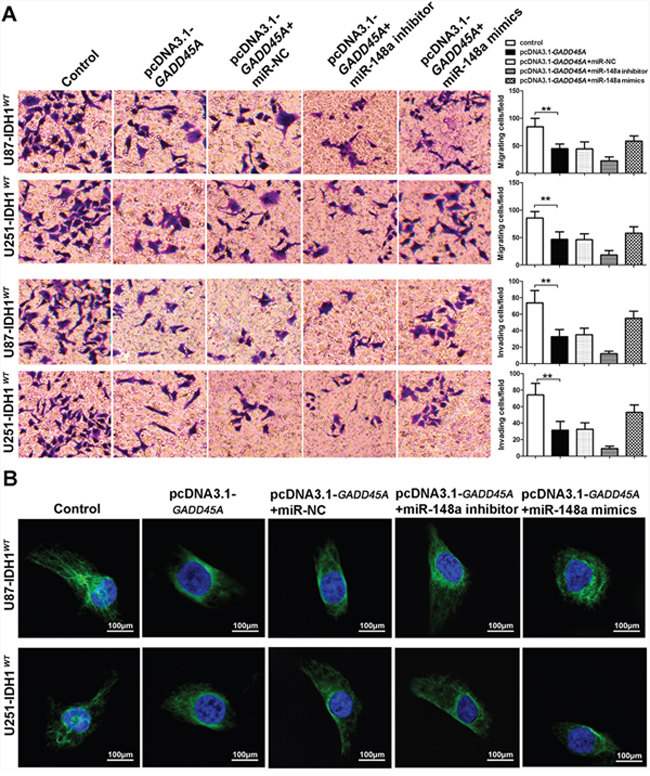
Figure 7: miR-148a partly increases cell migration and invasion and β-catenin distribution by downregulating GADD45A in IDH1WT glioblastoma cells. (A) Migration and invasion of IDH1WT U87 and U251 glioblastoma cells were measured using transwell assays. (B) Immunofluorescence staining of β-catenin in IDH1WT U87 and U251 cells. **P<0.01.
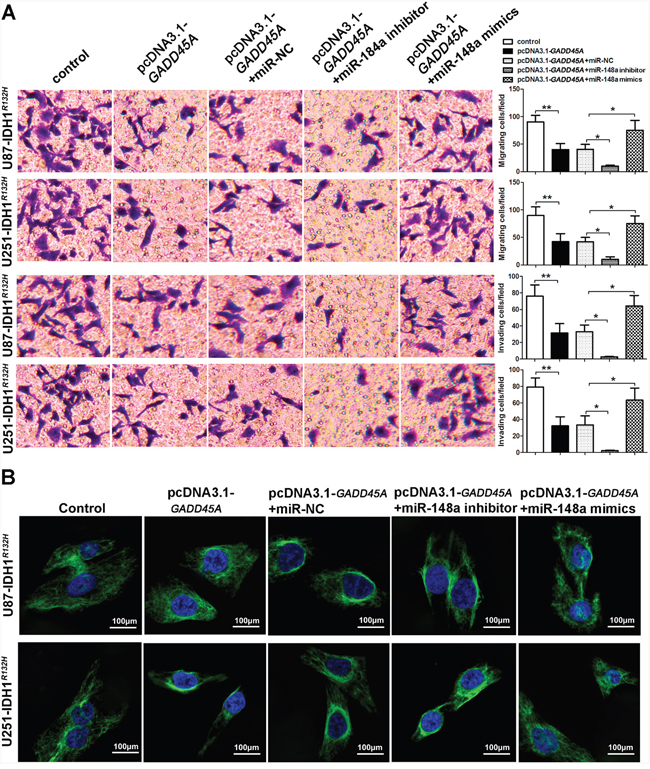
Figure 8: miR-148a increases cell migration and invasion and β-catenin distribution by inhibiting GADD45A in IDH1R132H U87 and U251 cells. (A) Migration and invasion of IDH1R132H U87 and U251 glioblastoma cells were measured using transwell assays. (B) Immunofluorescence staining of β-catenin in IDH1R132H U87 and U251 cells. GADD45A overexpression removed β-catenin from the nucleus and this effect was antagonized by miR-148a. *P<0.05, **P<0.01.
We observed that miR-148a controls β-catenin expression by targeting GADD45A. To explore the effect of miR-148a and GADD45A on the cellular distribution of β-catenin, we performed immunofluorescence staining experiments. β-catenin was distributed evenly throughout the nucleus and cytoplasm of control cells (Figure 7B and Figure 8B). GADD45A overexpression removed β-catenin from the nucleus and increased staining at the membrane. Inhibition of miR-148a enhanced this effect, while only upregulation of miR-148a increased β-catenin staining in the nucleus in IDH1R132H cells (Figure 8B). Taken together, these findings show that miR-148a stimulates the cellular distribution of β-catenin by inhibiting GADD45A in IDH1R132H glioma cells.
MiR-148a stimulates GSC neurosphere formation by inhibiting GADD45A
MiR-148a has been implicated in GSC neurosphere self-renewal [16]. In the present study, GADD45A overexpression significantly reduced the size and number of IDH1WT or IDH1R132H GSC 0308 neurospheres (Figure 9). We showed that miR-148a partly reverses GADD45A-inhibited effects in IDH1WT GSC 0308 cells. In contrast, miR-148a significantly promotes the self-renewal ability of IDH1R132H GSC 0308 cells by inhibiting GADD45A expression. These results indicated that miR-148a significantly inhibits GADD45A expression in IDH1R132H GSCs.
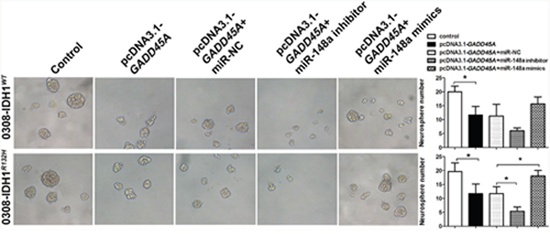
Figure 9: MiR-148a increases GSC neurosphere formation by downregulating GADD45A in IDH1WT and IDH1R132H cells. GSCs were transfected with pcDNA3.1-GADD45A without or with miR-148a inhibitor, miR-148a mimics, or controls and neurosphere formation was measured *P<0.05, **P<0.01.
GADD45A mediates the effects of miR-148a in IDH1R132H glioblastoma cells and stem cells
We investigated whether miR-148a-stimulated oncogenesis is inhibited by GADD45A. IDH1R132H glioblastoma cells were transfected with scrambled or GADD45A siRNA together with miR-148a inhibitors. Then, the expression of β-catenin, EMT markers, and MMP-9 was measured. Inhibition of miR-148a significantly reduced β-catenin, EMT marker, and MMP-9 expression in IDH1R132H glioblastoma cells and these effects were prevented by GADD45A knockdown (Figure 10). MiR-148a inhibition increased the formation of IDH1R132H GSC neurospheres and this effect was eliminated by GADD45A knockdown (Figure 11). Taken together, these findings show that GADD45A suppresses the effects of miR-148a in I IDH1R132H gliomas.
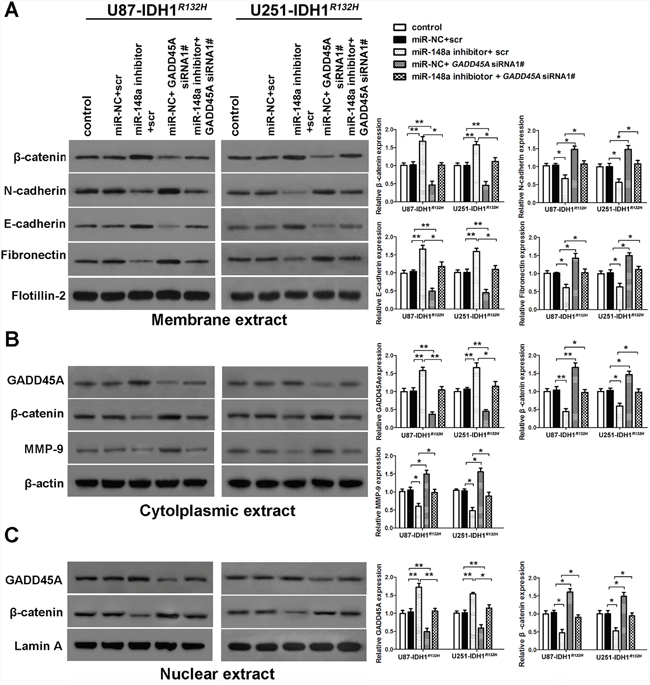
Figure 10: GADD45A inhibits the effects of miR-148a on β-catenin, MMP-9, and EMT marker expression in IDH1R132H glioblastoma cells. (A) Western blot analysis of β-catenin, N-cadherin, E-cadherin, and fibronectin expression in membrane extracts. Flotillin-2 was used as a membrane marker. (B) Western blot analysis of GADD45A, β-catenin, and MMP-9 expression in cytoplasmic extracts. β-actin was used as a control. (C) Western blots analysis of β-catenin and GADD45A expression in nuclear extracts. Lamin A was used as a control. IDH1R132H U87 and U251 cells were transfected with miR-148a inhibitor before transfection with GADD45A siRNA1# or scrambled controls. GADD45A siRNA1# rescued the effects of miR-148a inhibition on protein expression. *P<0.05, **P<0.01.
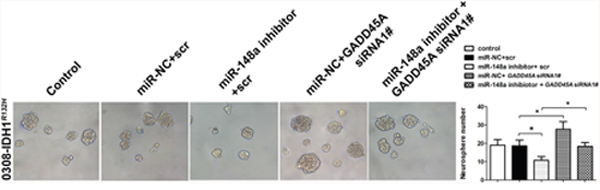
Figure 11: GADD45A inhibits the effects of miR-148a on IDH1R132H GSC neurosphere formation. GSCs were transfected with miR-148a inhibitor before transfection with GADD45A siRNA1# or scrambled controls. GADD45A siRNA1# rescued the effects of miR-148a inhibition on neurosphere formation. *P<0.05, **P<0.01.
DISCUSSION
The IDH1 R132H mutation promotes the survival of glioma patients. Understanding the underlying mechanisms may uncover novel treatments for the disease. In the current study, we searched for novel genes that were differentially expressed in IDH1 R132H glioma cells and revealed a downregulation of GADD45A. GADD45A reduced IDH1R132H glioblastoma cell proliferation and tumor growth. This was in agreement with previous reports that GADD45A reduces cancer progression [20] by promoting apoptosis and cell-cycle arrest [21–24]. In addition, we found that miR-148a was upregulated in IDH1R132H glioma tissue and inhibited the tumor suppressor function of GADD45A by downregulating its expression.
We have previously shown that the IDH1 R132H mutation reduces glioblastoma progression by inhibiting Wnt/β-catenin signaling [10]. β-catenin signaling plays several roles in cancer progression [26–28]. Importantly, when β-catenin is inhibited or prevented from translocating into the nucleus, apoptosis and cell-cycle arrest is promoted and cell proliferation is reduced [29–31].
GADD45A prevents the EMT by controlling the expression of matrix metalloproteinases (MMPs) [20] and β-catenin distribution within cancer cells [32]. In this study, we confirmed that GADD45A reduced the expression of β-catenin and MMP-9 in IDH1R132H glioblastoma cells, providing a deeper insight into how β-catenin is regulated in these tumors [10]. GADD45A-mediated regulation of the EMT was inhibited by miR-148a. This is in agreement with previous findings that miR-148a inhibits metastasis by blocking the EMT [33, 34].
GADD45A overexpression promoted the redistribution of β-catenin from the nucleus and cytoplasm to the membrane in IDH1R132H glioblastoma cells [10]. Furthermore, GADD45A increased E-cadherin expression at the membrane and inhibited glioblastoma cell invasion. This supports previous findings that GADD45A induces β-catenin translocation to the cell membrane to stabilize focal adhesions and promote contact inhibition, thereby preventing tumorigenesis [32].
MiR-148a was reported to be downregulated in IDH1R132H gliomas due to miR148a promoter hypermethylation [35]. This contradicts our finding that miR-148a is upregulated in IDH1 R132H glioma tissues. Further support for our findings comes from another study showing that miR-148 is upregulated in >500 human glioblastoma tissues [16]. The authors showed that miR-148a exerted an oncogenic effect and reduced patient survival by targeting the EGFR regulator MIG6 and the apoptosis regulator BIM [16]. In the present study, we confirmed the oncogenic potential of miR-148a and identified a novel miR-148a target, GADD45A.
In conclusion, we have demonstrated that the tumor suppressor gene GADD45A and the miR-148a are differentially expressed in IDH1R132H gliomas. MiR-148a promotes malignancy in these gliomas by inhibiting the tumor suppressor function of GADD45A.
MATERIALS AND METHODS
Human tissue samples
Tumor tissues were collected from glioma patients admitted to the Shanghai Tenth People's Hospital and control tissues were obtained from healthy individuals as previously described [10]. Tumor tissues were classified according to the 2007 WHO classification. Brain tissues were collected from seven healthy individuals and 81 glioma patients and flash frozen. All participants provided written informed consent according to the ethical guidelines of the Shanghai Tenth People's Hospital ethics committee (Tongji University, Shanghai, China).
Microarray analysis
For microarray-based comparison of gene expression, total RNA was isolated from IDH1WT or IDH1R132H U87 glioblastoma cells. Samples were processed by Invitrogen Biotechnology (Shanghai, China). RNA quality was analyzed, and then the transcripts were hybridized to Affymetrix GeneChip Human Exon 1.0 ST Arrays. The arrays were scanned using an Affymetrix GeneChip scanner 3000 7G system. Differentially expressed genes were identified using the TwoClassDif method.
Database analysis
We obtained whole genome mRNA microarray data and clinical information for gliomas as a discovery set from the Chinese Glioma Genome Atlas database (http://www.cgga.org.cn). In addition, we analyzed 268 IDH1WT (n=268) and IDH1R132H (n=53) gliomas from the TCGA database as previously described [36].
Cell culture
The human glioma cell lines U87 and U251 were obtained from the Chinese Academy of Sciences Cell Bank (Shanghai, China). The GSC 0308 cell line was obtained from the American Type Culture Collection (ATCC, Manassas, VA, USA). Glioma cells were cultured in Dulbecco’s modified Eagle’s medium (Gibco, Grand Island, NY, USA) supplemented with 10% fetal bovine serum (FBS) (Gibco), 2 mM glutamine and 100 ug/ml penicillin/streptomycin, at 37°C and 5% CO2, as previously described [10]. GSC were cultured in DMEM/F12 medium supplemented with 20% BIT, 100 ug/ml penicillin/streptomycin, 20 ng/ml epidermal growth factor (EGF), and 20 ng/ml basic fibroblast growth factor. U87MG-luc2 (U87-luc2), a human glioblastoma cell line was purchased from Caliper Life Sciences (Hopkinton, USA). The cells were grown in Minimum Essential Medium (Invitrogen) with 10% FBS and 100 ug/ml penicillin/streptomycin at 37°C and 5% CO2.according to previously study [37].
RNA isolation and real-time quantitative RT PCR (qRT-PCR)
Total RNA was extracted from fresh-frozen tissues or cells using Trizol reagent (Invitrogen, Carlsbad, CA, USA) and miRNA molecules were purified using the mirVana miRNA isolation kit (Ambion, Austin, USA) as previously described [38]. RNA was reverse transcribed using the PrimeScript RT reagent kit (Takara, Dalian, China). qRT-PCR was performed using SYBR Premix Ex Taq II (Takara) on an ABI Prism 7500 PCR system (Applied Biosystems, USA). Data were normalized to β-actin. Mature miR-148a was analyzed by qRT-PCR using the TaqMan MicroRNA Assay Kit (Applied Biosystems). The expression of mature miR-148a was determined by real-time PCR analysis following stem-loop RT and data were normalized to U6 snRNA. Relative expression was measured using the 2-ΔΔCT method [39] with the following primers: GADD45A forward: 5'- GAGCAGAAGACCGAAAGCGAC-3', reverse: 5'-GAATGTGGATTCGTCACCAGC-3'. MiR-148a RT-primer: 5'-GTCGTATCCAGTGCAGGGTCCGAGGTATTCGCACTGGATACGACAACAAAGTT-3'; MiR-148a PCR forward: 5'-GCTAGTGTTCTGAGACACTCCG-3', PCR reverse: 5'-GTGCAGGGTCCGAGGT-3'. U6 RT-primer: 5'-CGCTTCACGAATTTGCGTGTCAT-3', U6 PCR forward: 5'-GCTTCGGCAGCACATATACTAAAAT-3', PCR reverse: 5'-CGCTTCACGAATTTGCGTGTCAT-3'.
Immunohistochemistry
Tissues were prepared for immunohistochemical staining as previously described [10]. Paraffin-embedded sections were incubated in anti-GADD45A primary antibody (1:100 dilution; Abcam, Cambridge, USA) at 4°C overnight. After washing, sections were incubated with HRP-conjugated anti-mouse secondary antibody (1:1000 dilution; Abcam) for 1 h at 37°C. The signal was enhanced using the ABC peroxidase staining kit (ThermoFisher Scientific) and staining was detected by diaminobenzidine (DAB). Sections were counterstained with hematoxylin.
Evaluation of immunostaining intensity
GADD45A immunostaining was analyzed using intensity and distribution measurements as previously described [40, 41]. The staining intensity was scored as 0 (no staining), 1 (weak), 2 (moderate), and 3 (strong). The staining distribution was measured as the percentage of positive tumor cells (0% to 100%). GADD45A expression was scored by multiplying the intensity with the distribution. A final score of 0 corresponded to no staining and a high score of 300 indicated 100% of cells with a staining intensity of 3. Cells were further divided according to GADD45A expression into “low or negative” (GADD45A low) and “high or positive” (GADD45A high) groups, according to a cutoff point. The cutoff point for GADD45A expression was calculated using the X-tile software program as previously described [42].
Lentiviral constructs and cell constructs
We overexpressed IDH1R132H and IDH1WT cDNAs as previously described [10, 43]. To generate lentiviral particles, lentiviral vectors (pLenti6.3-MCS-IRES2-EGFP) (Invitrogen) were co-transfected with packaging vectors pLP1, pLP2, and pLP/VSVG into 293T cells using Lipofectamine 2000 (Life Technologies, Carlsbad, CA, USA) according to the manufacturer’s instructions. Supernatants were collected 48 h and 72 h after transfection and concentrated by ultracentrifugation. The virus titer was determined and lentiviral particles were used to infect the target cells. Infected cells were selected by 6 μg/ml blasticidin (Invitrogen) for 2 weeks to generate stable-transfected cell lines.
Plasmid construction
GADD45A expression was knocked down using three short interfering RNAs (siRNA) as follows: GADD45A-siRNA1# (5'-ATAAGTTGACTTAAGGCAGGA-3'), GADD45A-siRNA2# (5'-CATTGATCCATGTAGCGA CTT-3'), GADD45A-siRNA3# (5'-AACCCATTGATC CATGTAGCG-3') and a scramble negative siRNA (scr) (5'-GACCTGTACGCCAACACAGTG-3'). The siRNAs were chemically synthesized (Genechem, Shanghai, China) and subcloned into a psilencer 4.1 vector (Invitrogen). Transfected cells were selected using puromycin to generate stable cell lines. To overexpress GADD45A, the following primers were used for amplification: forward: 5'-GCGGGTACCATGACTTTGGAGGAATTCTC-3' and reverse: 5'-GGCCTCGAGTCACCGTTCAGGGAGATTAA-3'. The GADD45A cDNA product was cloned into the mammalian expression pcDNA3.1(+) vector (Invitrogen) at KpnI and XhoI restriction sites (TaKaRa, Dalian, China). Stable colonies were selected using Geneticin (G418).
Plasmid transfection
Plasmid DNA was extracted using a DNA Midiprep kit (Qiagen, Hilden, Germany). GADD45A siRNAs and scr were purchased from GeneChem (Shanghai, China). GADD45A siRNA1#, pcDNA3.1-gadd45a, miR-148a mimics or miR-148a inhibitor (GenePharma, Shanghai, China) were transfected into U87, U251, and GSC 0308 cells that stably expressed IDH1WT or IDH1R132H using Lipofectamine 2000 (Invitrogen). Forty-eight hours after transfection, cells were harvested for qRT-PCR or western blotting.
Western blotting
To measure protein expression in glioma cells, we prepared cellular extracts using the NE-PER® nuclear, cytoplasmic, and membrane extraction kit (Thermo Scientific, Waltham, MA, USA), according to the manufacturer’s instructions. Protein extracts were separated by SDS-PAGE on a 12% polyacrylamide gel, and then transferred to a PVDF membrane (Millipore, Bedford, MA, USA). Membranes were blocked at room temperature with 5% non-fat milk before incubating overnight at 4°C with the following primary antibodies: anti-IDH1 R132H mutation antibody (1:500 dilution; Dianova, Hamburg, Germany), anti-IDH1 antibody (1:500 dilution; Dianova), anti-GADD45A (1:200 dilution;Abcam, San Francisco, California, USA), anti-β-catenin (1:1,000 dilution; Abcam), anti-MMP-9 (1:1,000 dilution; Abcam), anti-E-cadherin (1:50 dilution; Abcam), anti-N-cadherin (1:1,000 dilution; Abcam), and anti-fibronectin (1:100 dilution, Abcam). Anti-β-actin (1:1,000 dilution; Abcam), anti-lamin A (1:500 dilution, Abcam) and anti-flotillin (1:500 dilution; Abcam) were used as controls. After primary antibody incubation, membranes were washed and incubated with HRP-conjugated secondary antibodies. Protein bands were visualized using the enhanced chemiluminescence (ECL) system (Pierce, Rockford, IL, USA).
Cell proliferation assay
Cell proliferation was quantified using the Cell Counting Kit-8 (CCK-8, Dojindo, Kumamoto, Japan) according to the manufacturer’s instructions. Briefly, 2×10³ cells/well were seeded into 96-well plates and pre-incubated for 12 h. Then, 10 μl CCK-8 solution was added to each well and the cells were incubated for 1–5 days. Absorbance was measured at 450 nm using an Epoch Microplate Spectrophotometer (Bio Tek, Winooski, VT, USA).
Neurosphere formation assay
GSC neurosphere formation was analyzed as previously described [16]. Briefly, IDH1WT or IDH1R132H GSCs were transfected with either miR-148a inhibitor or miR-148a mimics for 72 hours. The cells were dissociated into a single cell suspension in 1mM EDTA plus 0.5% BSA and 1,000 single cells were incubated in 6- well plate for 7 days. Neurospheres containing more than 20 cells were counted.
Animals and orthotopic xenotransplantation
Nude male BALB/c mice (5 weeks old) were obtained from Shanghai Laboratory Animal Company (Shanghai, China). Ten mice were used per group. All experiments were approved and performed according to the guidelines of the Ethics Committee of Shanghai Tenth People's Hospital of China and conformed to the Principles of Laboratory Animal Care (National Society for Medical Research), and National Institutes of Health guidelines. For in vivo imaging of glioblastoma formation, 3×10⁵ IDH1R132H U87 cells stably expressing luciferase (IDH1R132H U87-luc) that expressed either pcDNA3.1-GADD45A or GADD45A-siRNA1# were injected into the right forebrains of BALB/c nude mice as previously described [37].
Bioluminescence imaging
Tumor growth was monitored by BLI using the IVIS spectrum image system (Perkin, Elmer) as previously described [44]. Bioluminescence measurements were acquired on day 0, 7, and then weekly until the end of experiment. Animals were intraperitoneally injected with 150 mg/kg/10 mL D-luciferin (D-luciferin potassium salt 1G, PerkinElmer). Thirty minutes after luciferin administration, animals were anesthetized with 3% isoflurane and imaged in the IVIS imaging box. BLI was expressed as a total radiance in photons per sec/cm2 per steradian.
Luciferase reporter assay
Luciferase reporter vectors were constructed by inserting the 3'-UTR of GADD45A downstream of the luciferase gene in the psiCHECK-2 vector (Promega, USA) at XhoI and NotI sites (TaKaRa). The 3'-UTR of GADD45A (containing the binding sites for miR-148a) was amplified from a U87 cDNA library with the following primers: forward: 5'-GCGCTCGAGGGCATCTGAATGAAAATAACTG-3', and reverse: 5'-GATGCGGCCGCCCTGCATGGTTCTTTCTAA-3'. Five nucleotides in the miR-148 binding site were mutated in the 3'-UTR of GADD45A. The primer sequences for the mutated 3'-UTR were as follows: forward: 5'-GCGCTCGAG CTGAACCAAATTCGTGAGA-3', and reverse: 5'-GATGCGGCCGC TTCCTGCATGGTTCTTTCTA-3'. HEK293 cells were co-transfected with the luciferase reporter systems and miR-148a mimics/miR-NC as indicated in the Figure legends. Luciferase activity was detected 48 h after transfection using the Dual Luciferase Reporter Assay System (Promega) following the manufacturer's instructions. Data were normalized to Renilla activity.
Cell migration and invasion assay
Transwell migration and invasion assays were performed using cell culture inserts in 24-well plates (BD Biosciences, San Jose, CA, USA). A 100 μl suspension containing 5×10⁴ cells from each subgroup in serum-free medium was added to the upper chamber. We added 0.6 ml medium containing 10% FBS to the lower chamber as a chemoattractant. For the migration assay, cells were incubated for another 20 h. For the invasion assay, we used Matrigel invasion chambers in 24-well plates (BD Biosciences). Cells were incubated for a further 42 h at 37°C in 5% CO2. Cells that had adhered to the lower well were fixed and stained with 0.1% crystal violet staining solution. The average number of stained cells was calculated from five different microscopic fields.
Immunofluorescence staining
For immunofluorescence, cells were fixed in 4% paraformaldehyde and incubated in hydrogen peroxide to inhibit endogenous peroxidase activity. Non-specific antibody binding sites were blocked with 4% bovine serum albumin for 1 h and cells were labeled overnight with anti-β-catenin antibody (1:100 dilution; Abcam). After primary antibody incubation, cells were washed and labeled with the corresponding goat anti-mouse IgG (FITC) secondary antibody (1:1000 dilution; Abcam) for 2 h at 37°C. Cells were counterstained with DAPI and observed under a confocal microscope.
Rescue experiments
To determine whether inhibiting GADD45A affected miR-148a-mediated effects, IDH1WT or IDH1R132H U87 cells were transfected with an miR-148a inhibitor and GADD45A siRNA1# or scr. After transfection, the expression of GADD45A and EMT markers were analyzed by immunoblotting. In addition, neurosphere formation was measured as described earlier [16].
Statistical analysis
All results are presented as the mean ± standard deviation (SD) from three independent experiments performed in triplicate. Statistical analyses were performed using SPSS statistical software (Version 13.0; SPSS, Inc., Chicago, IL, USA). Survival curves were generated according to the Kaplan–Meier method and statistical analysis was performed using the Log-rank test. The Pearson Chi-square test was used to analyze the relationship between GADD45A expression and pathological features. The Student’s t-test or one-way ANOVA was used to analyze data from function analysis. P<0.05 was considered statistically significant.
ACKNOWLEDGMENTS
This study was supported by the Youth Fund of the National Natural Science Foundation of China (81201979, 81201975, and 81201708) and Post-doctor Fund of China (2015M581545).
CONFLICTS OF INTEREST
The authors declare no conflicts of interest.
REFERENCES
1. Ohgaki H, Kleihues P. Genetic Pathways to Primary and Secondary Glioblastoma. The American Journal of Pathology. 2007; 170: 1445-53.
2. Louis DN, Ohgaki H, Wiestler OD, Cavenee WK, Burger PC, Jouvet A, Scheithauer BW, Kleihues P. The 2007 WHO Classification of Tumours of the Central Nervous System. Acta Neuropathologica. 2007; 114: 97-109.
3. Purow B, Schiff D. Advances in the genetics of glioblastoma: are we reaching critical mass? Nat Rev Neurol. 2009; 5: 419-26.
4. Hadjipanayis CG, Van Meir EG. Tumor initiating cells in malignant gliomas: biology and implications for therapy. Journal of Molecular Medicine. 2009; 87: 363-74.
5. Chen R, Cohen AL, Colman H. Targeted Therapeutics in Patients With High-Grade Gliomas: Past, Present, and Future. Curr Treat Options Oncol. 2016; 17: 42.
6. Yan H, Parsons DW, Jin G, McLendon R, Rasheed BA, Yuan W, Kos I, Batinic-Haberle I, Jones S, Riggins GJ, Friedman H, Friedman A, Reardon D, et al. IDH1 and IDH2 Mutations in Gliomas. New England Journal of Medicine. 2009; 360: 765-73.
7. Sonoda Y, Kumabe T, Nakamura T, Saito R, Kanamori M, Yamashita Y, Suzuki H, Tominaga T. Analysis of IDH1 and IDH2 mutations in Japanese glioma patients. Cancer Science. 2009; 100: 1996-8.
8. Parsons DW, Jones S, Zhang X, Lin JC-H, Leary RJ, Angenendt P, Mankoo P, Carter H, Siu I-M, Gallia GL, Olivi A, McLendon R, Rasheed BA, et al. An Integrated Genomic Analysis of Human Glioblastoma Multiforme. Science. 2008; 321: 1807-12.
9. Nobusawa S, Watanabe T, Kleihues P, Ohgaki H. IDH1 Mutations as Molecular Signature and Predictive Factor of Secondary Glioblastomas. American Association for Cancer Research. 2009; 15: 6002-7.
10. Cui D, Ren J, Shi J, Feng L, Wang K, Zeng T, Jin Y, Gao L. R132H mutation in IDH1 gene reduces proliferation, cell survival and invasion of human glioma by downregulating Wnt/beta-catenin signaling. Int J Biochem Cell Biol. 2016; 73: 72-81.
11. Lu J, Getz G, Miska EA, Alvarez-Saavedra E, Lamb J, Peck D, Sweet-Cordero A, Ebert BL, Mak RH, Ferrando AA, Downing JR, Jacks T, Horvitz HR, et al. MicroRNA expression profiles classify human cancers. Nature. 2005; 435: 834-8.
12. Mitchell PS, Parkin RK, Kroh EM, Fritz BR, Wyman SK, Pogosova-Agadjanyan EL, Peterson A, Noteboom J, O'Briant KC, Allen A, Lin DW, Urban N, Drescher CW, et al. Circulating microRNAs as stable blood-based markers for cancer detection. Proc Natl Acad Sci U S A. 2008; 105: 10513-8.
13. Kota J, Chivukula RR, O'Donnell KA, Wentzel EA, Montgomery CL, Hwang HW, Chang TC, Vivekanandan P, Torbenson M, Clark KR, Mendell JR, Mendell JT. Therapeutic microRNA delivery suppresses tumorigenesis in a murine liver cancer model. Cell. 2009; 137: 1005-17.
14. Bertoli G, Cava C, Castiglioni I. MicroRNAs: New Biomarkers for Diagnosis, Prognosis, Therapy Prediction and Therapeutic Tools for Breast Cancer. Theranostics. 2015; 5: 1122-43.
15. Li Y, Deng X, Zeng X, Peng X. The Role of Mir-148a in Cancer. J Cancer. 2016; 7: 1233-41.
16. Kim J, Zhang Y, Skalski M, Hayes J, Kefas B, Schiff D, Purow B, Parsons S, Lawler S, Abounader R. microRNA-148a is a prognostic oncomiR that targets MIG6 and BIM to regulate EGFR and apoptosis in glioblastoma. Cancer Res. 2014; 74: 1541-53.
17. Roth P, Wischhusen J, Happold C, Chandran PA, Hofer S, Eisele G, Weller M, Keller A. A specific miRNA signature in the peripheral blood of glioblastoma patients. J Neurochem. 2011; 118: 449-57.
18. Hua D, Mo F, Ding D, Li L, Han X, Zhao N, Foltz G, Lin B, Lan Q, Huang Q. A catalogue of glioblastoma and brain MicroRNAs identified by deep sequencing. Omics. 2012; 16: 690-9.
19. Wang H, Pan JQ, Luo L, Ning XJ, Ye ZP, Yu Z, Li WS. NF-kappaB induces miR-148a to sustain TGF-beta/Smad signaling activation in glioblastoma. Mol Cancer. 2015; 14: 2.
20. Asuthkar S, Nalla AK, Gondi CS, Dinh DH, Gujrati M, Mohanam S, Rao JS. Gadd45a sensitizes medulloblastoma cells to irradiation and suppresses MMP-9-mediated EMT. Neuro Oncol. 2011; 13: 1059-73.
21. Jin S, Antinore MJ, Lung FD, Dong X, Zhao H, Fan F, Colchagie AB, Blanck P, Roller PP, Fornace AJ, Jr., Zhan Q. The GADD45 inhibition of Cdc2 kinase correlates with GADD45-mediated growth suppression. J Biol Chem. 2000; 275: 16602-8.
22. Liebermann DA, Tront JS, Sha X, Mukherjee K, Mohamed-Hadley A, Hoffman B. Gadd45 stress sensors in malignancy and leukemia. Crit Rev Oncog. 2011; 16: 129-40.
23. Salvador JM, Brown-Clay JD, Fornace AJ, Jr. Gadd45 in stress signaling, cell cycle control, and apoptosis. Adv Exp Med Biol. 2013; 793: 1-19.
24. Wang XW, Zhan Q, Coursen JD, Khan MA, Kontny HU, Yu L, Hollander MC, O'Connor PM, Fornace AJ, Jr., Harris CC. GADD45 induction of a G2/M cell cycle checkpoint. Proc Natl Acad Sci U S A. 1999; 96: 3706-11.
25. Li S, Chou AP, Chen W, Chen R, Deng Y, Phillips HS, Selfridge J, Zurayk M, Lou JJ, Everson RG, Wu KC, Faull KF, Cloughesy T, et al. Overexpression of isocitrate dehydrogenase mutant proteins renders glioma cells more sensitive to radiation. Neuro Oncol. 2013; 15: 57-68.
26. Fu Y, Zheng S, An N, Athanasopoulos T, Popplewell L, Liang A, Li K, Hu C, Zhu Y. β-catenin as a potential key target for tumor suppression. International Journal of Cancer. 2011; 129: 1541-51.
27. Wu Y, Ginther C, Kim J, Mosher N, Chung S, Slamon D, Vadgama JV. Expression of Wnt3 Activates Wnt/β-Catenin Pathway and Promotes EMT-like Phenotype in Trastuzumab-Resistant HER2-Overexpressing Breast Cancer Cells. American Association for Cancer Research. 2012; 10: 1597-606.
28. Anson M, Crain-Denoyelle AM, Baud V, Chereau F, Gougelet A, Terris B, Yamagoe S, Colnot S, Viguier M, Perret C, Couty JP. Oncogenic β-catenin triggers an inflammatory response that determines the aggressiveness of hepatocellular carcinoma in mice. The Journal of Clinical Investigation. 2012; 122: 586-99.
29. Zhang K, Zhu S, Liu Y, Dong X, Shi Z, Zhang A, Liu C, Chen L, Wei J, Pu P, Zhang J, Jiang T, Han L, et al. ICAT inhibits glioblastoma cell proliferation by suppressing Wnt/β-catenin activity. Cancer Letters. 2015; 357: 404-11.
30. Liu X, Wang L, Zhao S, Ji X, Luo Y, Ling F. β-Catenin overexpression in malignant glioma and its role in proliferation and apoptosis in glioblastma cells. Medical Oncology. 2011; 28: 608-14.
31. Shi Z, Qian X, Li L, Zhang J, Zhu S, Zhu J, Chen L, Zhang K, Han L, Yu S, Pu P, Jiang T, Kang C. Nuclear Translocation of β-catenin is Essential for Glioma Cell Survival. Journal of Neuroimmune Pharmacology. 2012; 7: 892-903.
32. Ji J, Liu R, Tong T, Song Y, Jin S, Wu M, Zhan Q. Gadd45a regulates beta-catenin distribution and maintains cell-cell adhesion/contact. Oncogene. 2007; 26: 6396-405.
33. Yan H, Dong X, Zhong X, Ye J, Zhou Y, Yang X, Shen J, Zhang J. Inhibitions of epithelial to mesenchymal transition and cancer stem cells-like properties are involved in miR-148a-mediated anti-metastasis of hepatocellular carcinoma. Mol Carcinog. 2014; 53: 960-9.
34. Aprelikova O, Palla J, Hibler B, Yu X, Greer YE, Yi M, Stephens R, Maxwell GL, Jazaeri A, Risinger JI, Rubin JS, Niederhuber J. Silencing of miR-148a in cancer-associated fibroblasts results in WNT10B-mediated stimulation of tumor cell motility. Oncogene. 2013; 32: 3246-53.
35. Li S, Chowdhury R, Liu F, Chou AP, Li T, Mody RR, Lou JJ, Chen W, Reiss J, Soto H, Prins R, Liau LM, Mischel PS, et al. Tumor-suppressive miR148a is silenced by CpG island hypermethylation in IDH1-mutant gliomas. Clin Cancer Res. 2014; 20: 5808-22.
36. Chen H, Li X, Li W, Zheng H. miR-130a can predict response to temozolomide in patients with glioblastoma multiforme, independently of O6-methylguanine-DNA methyltransferase. J Transl Med. 2015; 13: 69.
37. Fu Y, Ong LC, Ranganath SH, Zheng L, Kee I, Zhan W, Yu S, Chow PK, Wang CH. A Dual Tracer 18F-FCH/18F-FDG PET Imaging of an Orthotopic Brain Tumor Xenograft Model. PLoS One. 2016; 11: e0148123.
38. Chen C, Ridzon DA, Broomer AJ, Zhou Z, Lee DH, Nguyen JT, Barbisin M, Xu NL, Mahuvakar VR, Andersen MR, Lao KQ, Livak KJ, Guegler KJ. Real-time quantification of microRNAs by stem-loop RT-PCR. Nucleic Acids Res. 2005; 33: e179.
39. VanGuilder HD, Vrana KE, Freeman WM. Twenty-five years of quantitative PCR for gene expression analysis. Biotechniques. 2008; 44: 619-26.
40. Lu C, Wang X, Zhu H, Feng J, Ni S, Huang J. Over-expression of ROR2 and Wnt5a cooperatively correlates with unfavorable prognosis in patients with non-small cell lung cancer. Oncotarget. 2015; 6: 24912-21. doi: 10.18632/oncotarget.4701.
41. Zhu J, Ma J, Wang X, Ma T, Zhang S, Wang W, Zhou X, Shi J. High Expression of PHGDH Predicts Poor Prognosis in Non-Small Cell Lung Cancer. Transl Oncol. 2016; 9: 592-9.
42. Sun R, Wang X, Zhu H, Mei H, Wang W, Zhang S, Huang J. Prognostic value of LAMP3 and TP53 overexpression in benign and malignant gastrointestinal tissues. Oncotarget. 2014; 5: 12398-409. doi: 10.18632/oncotarget.2643
43. Uno M, Oba-Shinjo SM, Silva R, Miura F, Clara CA, Almeida JR, Malheiros SM, Bianco AM, Brandt R, Ribas GC, Feres H, Dzik C, Rosemberg S, et al. IDH1 mutations in a Brazilian series of Glioblastoma. Clinics (Sao Paulo). 2011; 66: 163-5.
44. da Ros M, Iorio AL, Consolante D, Cardile F, Muratori M, Fantappie O, Lucchesi M, Guidi M, Pisano C, Sardi I. Morphine modulates doxorubicin uptake and improves efficacy of chemotherapy in an intracranial xenograft model of human glioblastoma. Am J Cancer Res. 2016; 6: 639-48.