
INTRODUCTION
In the United States, kidney cancer is estimated as the tenth-and seventh-highest incident cancers among women and men, respectively [1], with annual increments of 1.7 and 1.6 % in white women and white men. Renal cell carcinoma (RCC) is the most common malignancy of the kidney [2]. Globally, geographic variation in RCC demonstrates higher age standardized incidence rates in more developed areas (11.9/105). compared to developing regions (2.5/105) [3] Although smoking [4], obesity [5], hypertension [6], diabetes [7] and some medications [8] have consistently been associated with RCC risk, the exact etiology remains largely unknown.
Consumption of vegetables and fruits (VFs), which contains putative anticarcinogenic and antimutagenic substances (e.g., vitamin C, vitamin E, folate, carotenoids and flavonoids), have long been thought to protect against cancers, including RCC. The suggested mechanisms for prevention of cancer includes: induce detoxifying phase II enzymes, antioxidant activity, protection against DNA damage, modulate DNA methylation, promotion of apoptosis [9]. A large number of epidemiological studies reporting on associations between consumption of VFs and RCC risk have given inconclusive results [10–31]. According to the 2015 WCRF/AICR Continuous Update Project Report, no conclusions can be reached for the evidence of VFs consumption and RCC incidence [32]. Results from several large prospective cohort [11, 12, 19, 31] and case-control studies [21, 23, 25–27, 30] have shown no associations between VFs intake and RCC risk. In contrast, data from a pooled analysis of 13 cohort studies [15] observed that high fruit and vegetable consumption was associated with a decreased risk of RCC. Since this pool analysis was published, additional two large cohort studies [11, 12] have been available. In the current analysis, we also included case-control studies to increase statistical power, and we examined the exact shape of the dose-response relationship between consumption of VFs and RCC risk. We performed study quality assessment in detail and meta-regression and sensitivity analyses according to the study variables.
RESULTS
Search results and study characteristics
Based on the study selection criteria, we identified 1153 articles from the MEDLINE, 2071 from the EMBASE and 2401 from the web of science database. In addition, 9 more articles were identified by studying the cross-reference lists. After excluding studies that did not meet the inclusion criteria, 19 publications were included in our meta-analysis, including 14 case-control studies, a pooled analysis of 13 prospective studies and 4 cohort studies (Figure 1). We excluded five publications [14, 20, 33–35] in the primary analysis (because they were included in the aforementioned pooled analysis [15]), but included them in the subgroup analysis for genders.
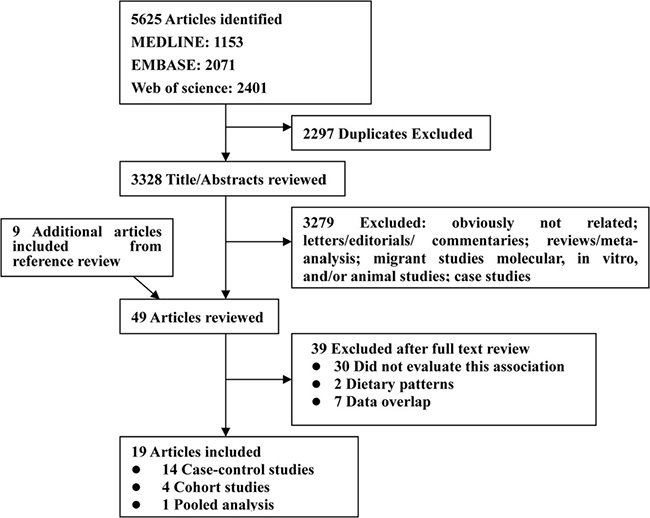
Figure 1: Flow diagram of systematic literature search on vegetables and fruit intake and the risk of renal cell carcinoma.
Table 1 and Table 2 depicted the characteristics of these 19 publications. A total of 10 215 cases and 1 394 677 controls/participants were enrolled in these studies. All these studies represented different populations: 7 studies were conducted in North America (United States and Canada), 8 in Europe, one each in Asia (China) and in South America, respectively. Two studies were multinational (Europe and USA), and 1 was pooled study. Only 4 studies [11, 12, 15, 17] adjusted for all the three main risk factors for RCC (16 studies adjusted for tobacco smoking, 15 for BMI and 4 for hypertension). The quality scores of each study are summarized in Supplementary Table 1. The quality scores ranged from 5 to 9, with the median score of 8. The majority of included studies (16/19) were of high quality (NOS score ≥ 7).
Table 1: Characteristics of case-control studies of vegetables and fruit intake and renal cell carcinoma risk
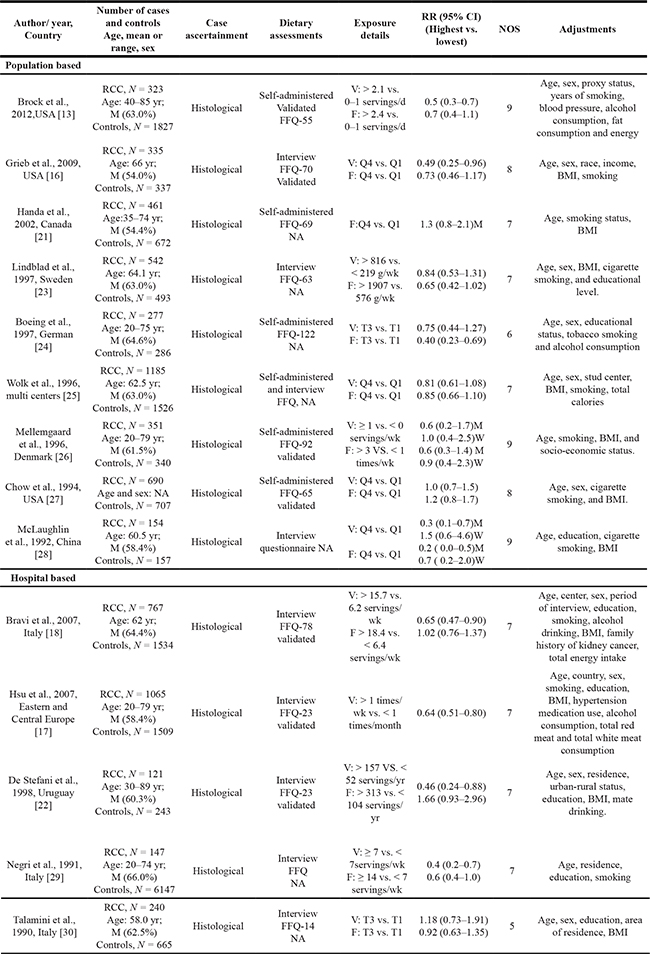
Abbreviation: BMI, body mass index; FFQ, food frequency questionnaire; NA, not available, V, vegetable; F, fruit; M, men, W, women; RCC, renal cell carcinoma; T, tertile; Q4, quartitle; M, male.
Table 2: Characteristics of prospective cohort studies of vegetables and fruit intake and renal cell carcinoma risk
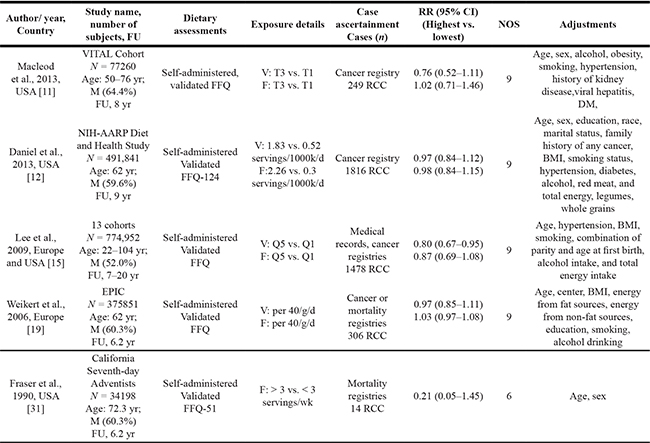
Abbreviation: VITAL, the VITamin And Lifestyle; DM, diabetes mellitus, BMI, body mass index; FFQ, food frequency questionnaire; NA, not available, V, vegetable; F, fruit; M, men, W, women; RCC, renal cell carcinoma; FU, follow-up; T, tertile; Q5, quintitle.
Total vegetables
High vs. low analysis
Sixteen studies investigated the association between the highest vs. lowest vegetables intake and RCC risk. The observed SRR was 0.73 (95% CI: 0.63–0.85), with moderate heterogeneity (Pheterogeneity = 0.004, I2 = 53.5%; Figure 2A).
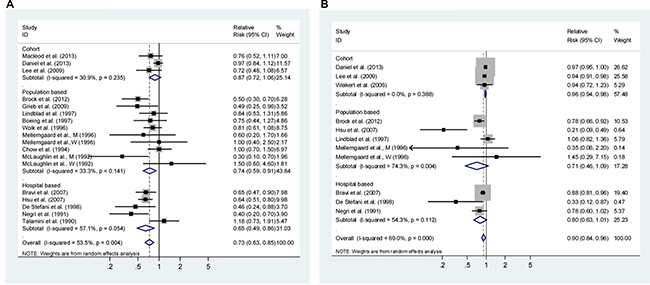
Figure 2: Analysis of vegetables intake with risk of renal cell carcinoma. (A) High vs. Low analysis; (B) Dose-response analyses for intake in increment of 1 serving/day. Studies are sub-grouped according to study design. Squares indicated study-specific risk estimates (size of square reflects the study-statistical weight, i.e. inverse of variance); horizontal lines indicate 95% confidence intervals; diamond indicates summary relative risk estimate with its corresponding 95% confidence interval.
Dose-response analysis
Dose-response analysis was done based on the data from ten studies (Figure 2B). The SRR per 1 serving/day was 0.90 (95% CI: 0.84–0.96), with evidence of moderate heterogeneity (I2 = 69.0%, Pheterogeneity < 0.001). There was evidence of a non-linear association between vegetable intake and RCC risk (P = 0.001 for non-linearity, Supplementary Figure 1A), with a significant reduction in RCC risk when increasing the intake up to about 3 servings/d intake of vegetables. Higher intake was associated with a further, but more modest decrease in risk.
Total fruit
High vs. low analysis
Eighteen studies representing the association between the highest vs. lowest fruits intake and RCC risk were used for this analysis. The SRR was 0.86 (95% CI: 0.75–0.98), and had low heterogeneity (Pheterogeneity = 0.012, I2 = 47.40%; Figure 3A).
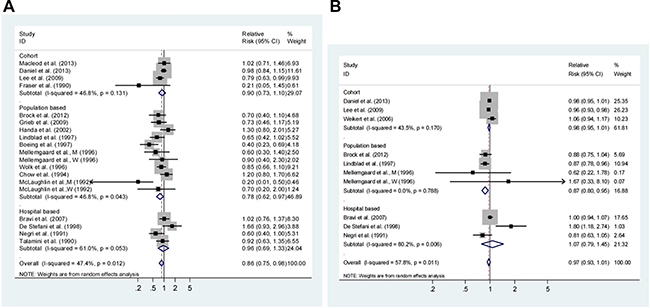
Figure 3: Analysis of fruits intake with renal cell carcinoma risk. (A) High vs. Low intake and; (B) Dose-response analyses for intake in increment of 1 serving/day. Studies are sub-grouped according to study design. Squares indicated study-specific risk estimates (size of square reflects the study-statistical weight, i.e. inverse of variance); horizontal lines indicate 95% confidence intervals; diamond indicates summary relative risk estimate with its corresponding 95% confidence interval.
Dose-response analysis
Dose-response analysis was achieved by including ten studies (Figure 3B). The SRR per 1 serving/day increment was 0.97 (95% CI: 0.93–1.01), with moderate heterogeneity (I2 = 57.8%, Pheterogeneity = 0.011). There was a linear association between fruits intake and RCC risk (P = 0.221 for non-linearity, Supplementary Figure 1B).
Subgroup, meta-regression and sensitivity analyses
Subgroup and meta-regression analyses were shown in Table 3. For high vs. low intake of vegetables, overall, there were inverse risk associations for RCC in all strata, but the associations were not statistically significant in cohort studies (SRR 0.87, 95% CI: 0.72–1.06), low study quality score (SRR 0.95, 95% CI: 0.61–1.49) and in studies using non-validated FFQ (SRR 0.76, 95% CI: 0.56–1.03). Adjustments for BMI significantly attenuated the protective role of vegetables consumption (P = 0.081). Locations, study design, study quality and confounders adjusted for smoking, alcohol use, history of hypertension and energy intake did not significantly alter the summary risk estimates (Table 3).
Table 3: Subgroup analyses of vegetables and fruit intake and renal cell carcinoma risk, high vs. low
Sub-groups |
Vegetables |
Fruit |
||||||||
|---|---|---|---|---|---|---|---|---|---|---|
Studies,n |
SRR (95% CI) |
Ph |
I2(%) |
Pd |
Studies, n |
SRR (95% CI) |
Ph |
I2(%) |
Pd |
|
All |
16 |
0.73 (0.63–0.85) |
0.04 |
53.5 |
18 |
0.86 (0.75–0.98) |
0.012 |
47.4 |
||
Design |
0.252 |
0.763 |
||||||||
Cohort |
3 |
0.87 (0.72–1.06) |
0.235 |
30.9 |
4 |
0.90 (0.73–1.10) |
0.131 |
46.8 |
||
Case-control |
13 |
0.70 (0.59–0.82) |
0.042 |
42.4 |
14 |
0.84 (0.70–0.99) |
0.014 |
50.1 |
||
Sources of control |
0.527 |
0.329 |
||||||||
Population-based |
8 |
0.74 (0.59–0.91) |
0.141 |
33.3 |
10 |
0.78 (0.63–0.97) |
0.043 |
46.8 |
||
Hospital-based |
5 |
0.65 (0.49–0.86) |
0.054 |
57.1 |
4 |
0.96 (0.69–1.33) |
0.053 |
61.0 |
||
Geographic locations |
0.839 |
0.118 |
||||||||
Europe |
7 |
0.71 (0.59–0.87) |
0.203 |
28.2 |
7 |
0.72 (0.56–0.93) |
0.061 |
50.1 |
||
North America |
6 |
0.76 (0.57–1.03) |
0.014 |
68.0 |
7 |
0.97 (0.81–1.16) |
0.171 |
33.7 |
||
South America |
1 |
0.46 (0.24–0.88) |
- |
- |
1 |
1.66 (0.93–2.96) |
- |
- |
||
Asia (China) |
1 |
0.67 (0.14–3.22) |
- |
- |
1 |
0.49 (0.16–1.48) |
- |
- |
||
Gender |
0.158 |
0.957 |
||||||||
Men |
5 |
0.59 (0.32–1.03) |
0.004 |
73.9 |
6 |
0.74 (0.51–1.07) |
0.100 |
45.9 |
||
Women |
6 |
0.98 (0.71–1.35) |
0.290 |
19.0 |
6 |
0.79 (0.59–1.06) |
0.925 |
0 |
||
Type of FFQ |
0.647 |
0.194 |
||||||||
Validated |
10 |
0.71 (0.60–0.85) |
0.008 |
58.1 |
11 |
0.93 (0.81–1.07) |
0.127 |
34.0 |
||
Not available |
6 |
0.76 (0.56–1.03) |
0.049 |
52.7 |
7 |
0.74 (0.57–0.96) |
0.032 |
54.4 |
||
Data available |
0.199 |
0.847 |
||||||||
Self-administered |
7 |
0.82 (0.70–0.97) |
0.146 |
35.4 |
10 |
0.87 (0.72–1.06) |
0.022 |
53.8 |
||
Interview |
8 |
0.65 (0.52–0.83) |
0.040 |
50.6 |
7 |
0.84 (0.65–1.07) |
0.072 |
46.2 |
||
Study quality score |
0.250 |
0.149 |
||||||||
High (NOS score > 6) |
14 |
0.71 (0.60–0.83) |
0.004 |
55.5 |
15 |
0.90 (0.79–1.01) |
0.084 |
34.8 |
||
Low (NOS score ≤ 6) |
2 |
0.95 (0.61–1.49) |
0.215 |
35.1 |
3 |
0.53 (0.25–1.14) |
0.020 |
74.6 |
||
Adjustments |
||||||||||
BMI, yes |
14 |
0.77 (0.67–0.90) |
0.020 |
48.0 |
0.081 |
0.93 (0.83–1.04) |
0.182 |
24.6 |
0.007 |
|
No |
2 |
0.54 (0.39–0.75) |
0.289 |
19.5 |
0.54 (0.39–0.75) |
0.313 |
15.7 |
|||
Smoking, yes |
14 |
0.73 (0.62–0.84) |
0.008 |
51.9 |
0.686 |
15 |
0.84 (0.73–0.96) |
0.030 |
44.1 |
0.376 |
no |
2 |
0.76 (0.30–1.90) |
0.022 |
80.8 |
3 |
0.96 (0.47–1.94) |
0.041 |
68.6 |
||
Dietary energy, yes |
5 |
0.74 (0.59–0.94) |
0.013 |
68.3 |
0.832 |
5 |
0.90 (0.81–1.01) |
0.376 |
5.5 |
0.748 |
No |
11 |
0.72 (0.59–0.88) |
0.055 |
42.0 |
13 |
0.82 (0.65–1.03) |
0.005 |
56.2 |
||
Hypertension, yes |
5 |
0.72 (0.56–0.93) |
0.004 |
74.4 |
0.957 |
4 |
0.90 (0.78–1.04) |
0.287 |
20.6 |
0.773 |
No |
11 |
0.73 (0.60–0.89) |
0.064 |
40.5 |
14 |
0.83 (0.68–1.01) |
0.001 |
53.5 |
||
Alcohol use, yes |
7 |
0.72 (0.59–0.87) |
0.008 |
65.4 |
0.795 |
6 |
0.84 ( (0.69–1.03) |
0.025 |
61.2 |
0.855 |
No |
9 |
0.74 (0.58–0.94) |
0.038 |
47.9 |
12 |
0.86 (0.71–1.05) |
0.046 |
43.6 |
||
For high vs. low intake of fruits, there were not statistically inverse associations for RCC risk in most of the strata. The association of high vs. low intake of fruits with RCC risk suggested inverse associations in the studies conducted in European countries (SRR, 0.72, 95% CI: 0.56–0.93), but not in North America (SRR, 0.97, 95% CI: 0.81–1.16). The SRR (95% CIs) estimates were 0.90 (0.73–1.10) for cohort studies, 0.78 (0.63–0.97) for population-based and 0.96 (0.69–1.33) for hospital-based case-control studies. Adjustments for BMI (P = 0.007) significantly attenuated the protective role of fruits consumption. Whereas geographic locations, study design, study quality, type of FFQ, methods of exposure available and adjustments for confounders (energy intake, alcohol use, hypertension and smoking) did not significantly modify the summary risk estimates for fruit intake (Table 3).
Meta-regression analyses showed that confounders adjusted by BMI were significant factors for the associations, which might account for 33.5% of the total between-study heterogeneity for vegetables intake and 60.7% for fruits intake. If the overall homogeneity and effect size were calculated by removing one study at a time, we confirmed the stability of the inverse association between consumption of vegetable and fruit and RCC risk (Supplementary Figure 2A–2B).
Publication bias
For high vs. low analysis, there was no evidence of publication bias for the risk association of RCC development with intake of vegetables (PBegg’s test = 0.705, Figure 4A; and PEgger’s test =0.667) and fruit (PBegg’s test = 0.142, Figure 4B; and PEgger’s test =0.633).
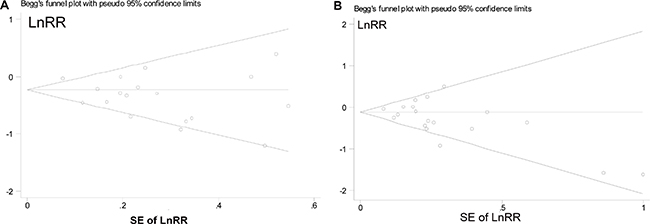
Figure 4: Begg’s funnel plots of the log relative risks (RRs) versus the SEs of the log RRs in studies that evaluated the effect of vegetables (A) and fruit (B) intakes on the risk of renal cell carcinoma.
DISCUSSION
Results of this meta-analysis indicate the hypothesis that consumption of vegetables and fruits may lower the risk of RCC development. The significant associations for vegetables and fruits were observed in case-control, but not in cohort studies. The association did not seem to differ among groups defined by geographical area, methods of dietary assessment and adjustments by smoking, history of hypertension, and total energy intake, but was significantly modified by adjustment by BMI/obesity. To our knowledge this is the first report suggesting a non-linear inverse association between consumption of vegetables and RCC risk, but the risk reductions leveled off for daily intake > 3 servings.
It has been proposed that several components rich in fruit and vegetables may lower the risk of RCC development. Carotenoids (α-carotene, β-carotene, lycopene and lutein/zeaxanthin) might inhibit oxidative damage to DNA, mutagenesis, tumor growth, malignant transformation [36]. Lycopene intake was inversely associated with RCC risk in prospective cohort studies (the highest vs. the lowest quartile of intake, HR = 0.61; 95% CI, 0.39–0.97) [37], although no association was observed by other studies [38, 39]. Dietary fiber is rich in fruit and vegetables. Some studies [12, 40], although not all [23, 25, 41], have found that high intake of fiber may lower the risk of RCC development.
Associations between intake of vegetables and fruits and RCC risk have been inconsistently reported among different observational studies. The results from most of the case-control studies showed non-significant inverse associations. Two multicenter case-control studies (each included more than 1,000 RCC cases) have shown more consistent inverse associations for consumption of fruits and vegetables. The Pooling Project analysis included data from approximately 1,500 RCC cases across 13 international cohorts, and showed that increasing fruit and vegetable consumption is associated with decreasing risk of RCC (P value, test for trend = 0.03 and 0.07, respectively) [15]. In contrast, other prospective studies [11, 12, 19] observed non-significant associations. When summarized risk estimation stratified by study design, we found a statistically significant association for consumption of fruits and vegetables among case-control studies, but a non-significant inverse association among prospective cohort studies. We assumed that this was due to several factors, e.g., potential selection and recall biases derived from a case-control design [42], the limitations of currently available dietary assessment tools, and the potential confounders for which analyses were adjusted. In addition, we found a non-significant association between intake of fruits and RCC risk among hospital-based case-control studies. This result should be treated with caution because this design is more subject to selection bias than the population-based design, and because there were only four hospital-based case-control studies for this association, which is subject to low statistical power. Likely, non-significant associations were also observed for both men and women when we combining results specifically for genders. These null associations may be due to low statistical power due to the small number of studies included.
In the present analysis, we captured the maximal number of published studies on this topic by using multiple avenues for finding articles, including several prospective studies. Additionally, a large sample size (10,215 cases and 1,394,677 controls/ participants) were recruited in our studies, and thus have a much greater possibility of reaching detecting smaller associations.
However, there are several limitations of this meta-analysis. Misclassification of VF intake may have an influence on our findings. It is very difficult for persons to accurately report their intake levels of VF. Compared with food records or food diaries, using a FFQ showed spearman’s correlation coefficients of 0.6–0.8 for fruits consumption and only 0.19–0.62 for vegetables consumption [15, 42–44]. In addition, FFQ was validated in most of the included studies, and subgroup analysis suggested that the use of a validated or non-validated FFQ did not significantly alter the risk associations. Furthermore, dietary changes after baseline collection can have an impact on the associations and repeated assessments of diet were not carried out in any of the cohort studies. However, measurement errors are generally non-differential in observational studies, which would most likely attenuate the association.
Second, the inherent problems of residual confounders stemming from observational studies are of concern, because of the inability to fully adjust for various confounders. Persons eating higher levels of VFs may be more likely to take up other healthy lifestyles, such as a lower prevalence of obesity and alcohol use, less physical inactivity and tobacco smoking [45], and a less prevalence of hypertension [46]. However, most included studies have adjusted for a wide range of potential confounders. For example, 16 studies adjusted for tobacco smoking, 15 for BMI and 4 for hypertension, however, no studies adjusted for physical activity. Stratified analyses indicated that risk associations were significantly changed by adjustment for BMI, but not by adjustment for smoking, alcohol use, total energy intake and history of hypertension. Recently, meta-analyses have indicated that increased VF consumption decreases the risk for obesity [47], and increased BMI is associated with increased risk of RCC both for men and women [5]. These results indicated that BMI may have a residual confounding effect on the association between consumption of VFs and RCC risk.
Third, there was significant heterogeneity among studies. We assessed intake of total VF intake due to the relatively large number of studies on this topic. However, total VF intake includes cruciferous vegetables (such as, broccoli, Brussels sprouts, cabbage), which are rich sources of glucosinolates. Cruciferous vegetables may inhibit carcinogen-activating enzymes, detoxify carcinogens, and thus lower the occurrence of cancer [48]. In addition, some foods are culinary vegetables but are classified botanically as fruits, such as cucumbers, peppers, squash, and tomatoes. Various studies from different regions, ethnicities and time periods might use different VFs in their classifications and types. To cover this aspect, we included studies assessing “all” or “total” fruits or vegetables, thus providing one explanation for the heterogeneity across studies. In addition, higher heterogeneity was observed in dose-risk analyses, which may be due to unit conversions. Our subgroup analyses showed that cohort studies had little variability, whereas significant heterogeneity was observed among case-control studies. Furthermore, results from meta-regression analyses found that adjustment for BMI might partially (33.5% for vegetables and 60.1% for fruits) account for the observed heterogeneity. Additionally, we should be cautious of results from the non-linear association between consumption of vegetables and RCC risk because of the significant heterogeneity and low number of studies included, especially in the high doses of consumption categories (> 4 servings/day).
Finally, we did not consider the gray articles (small studies with null results) since they tend to be unpublished. Although neither Egger’s nor Begg’s test provided evidence of such bias, certain of publication bias may exist. This bias might exaggerate the protective effects of VF intake on RCC risk, these effects thus should be treated cautiously.
Collectively, our analysis indicated that a high intake of VF may lower the risk of RCC development. Because of the measurement errors of exposure assessment, the high heterogeneity across studies, and unmeasured confounding factors, further investigation with good designs are needed.
MATERIALS AND METHODS
This meta-analysis evaluates the association between consumption of VF with RCC following the criteria set out by the Preferred reporting items for systematic reviews and meta-analysis guidelines [33]. There are no ethical issues involved in our study because our data were from published studies.
Data sources and study identification
Two investigators (J.Z.K. and Z.S.J.) independently screened the original articles published in English language in the two databases of MEDLINE (from January 1, 1966), EMBASE (from January 1, 1974) and Web of science (from January 1, 1950) up to August 31, 2016. We used the following MeSH terms and Text Words: 1) “kidney” OR “renal”; 2) “carcinoma” “cancer” or “neoplasm” OR “neoplasia”; 3) “nutrition” OR “diet” OR “lifestyle” OR “intake” OR “ consumption” OR “fruit” OR “vegetable”; and 4) “case-control” OR “cohort” OR “retrospective” OR “prospective” OR “longitudinal”. Moreover, the reference lists of the included articles and published reviews were also screened and hand-searched. We did not consider abstracts or unpublished reports.
Study selection
For this meta-analysis, we used the studies which evaluate fruit or vegetable groups classified as “all” or “total”. We did not include exposures presented as raw vegetables, green-yellow vegetables, cooked vegetables, green leaf vegetables, other vegetables, citrus fruit, or other specific types of fruits. But we included studies which reported “fresh vegetables” or “fresh fruit”, because fresh vegetables or fruit accounts for a very high proportion of the total consumption [50]. Two authors (J.Z.K. and Z.S.J.) independently reviewed all the retrieved studies to determine if they meet the inclusion criteria. Disagreements were settled through consensus with a third investigator (Y.J.J.).
The study inclusion criteria were:
● being a case-control or cohort design;
● presenting data for the association between total vegetables and/or fruits and RCC risk;
● reporting results in terms of adjusted estimates (at least for age) for the relative risk (RR) [e.g. hazard ratio, risk ratio or odds ratio (OR)] and 95% confidence interval (CI).
Non peer-reviewed articles, animal and mechanistic studies, ecologic assessments and correlation studies were not included for analysis. In case more than one articles on the association between intake of fruits and vegetables and RCC were identified, the most recent report was selected for our analysis.
Data extraction
From each study, the following information was independently extracted by two researchers (J.Z.K. and Z.S.J.): first author’s last name, study design, publication year, follow-up duration in cohort study, geographic locations where the study was carried out, number of cases, size of cohorts/number of controls, definition of controls, dietary data ascertainment (types and whether it was validated), exposure contrast, the RR estimates with their 95% CI for the highest vs. the lowest level and adjustment variables. When different types of adjusted RRs were presented, we extracted the one that controlled for the most confounders. Differences in data extraction between investigators were unusual and were resolved by consensus.
Quality assessment
For each publication, the quality score was assessed by using the Newcastle-Ottawa quality assessment Scale (NOS) [51], which assigned a score of total 9 points (9 representing the highest quality) for individual study following this criteria: 4 items for selection, 2 items for comparability, and 3 items for exposure ( case-control study)/outcome (cohort study) assessment. We decided to assign two stars in the comparability section only when a study is adjusted for at least two of three main risk factors: tobacco smoking, hypertension and BMI. A total score ≥ 7 indicates high quality study. To avoid selection bias, no study was rejected because of these quality criteria.
Statistical methods
We pooled RR estimates and 95% CIs for the comparison between the study-specific highest category of consumption versus the lowest, linear and non-linear dose-responses using the DerSimonian and Laird random-effects model, which incorporates both within- and between-study variability [52].
Heterogeneity was assessed using the Cochran Q (results were defined heterogeneous for p < 0.10) and I2 statistics (results explain the amount of total variation among studies). For the I2 statistic, heterogeneity was interpreted as absent (0%–25%), low (25.1%–50%), moderate (50.1%–75%), or high (75.1%–100%) [53]. Subgroup analyses and meta-regression analyses were carried out according to study design, geographic location, type of food frequency questionnaire (FFQ), exposure data available, study quality score, and confounders (adjustments for smoking, alcohol use, body mass index [BMI], history of hypertension and dietary energy intake). Sensitivity analysis that investigates the influences of each individual study on the summary results was performed by omitting one study at a time.
To conduct dose-response meta-analyses, published results were transformed into a common scale, which are expressed as increment of 1 serving/day of consumption. For one study which presented the intake per given unit of energy intake, we rescaled it using the mean energy intake provided [12]. For studies that reported intakes as grams, we converted an 80 g as 1 serving size according to other meta-analyses of fruit and vegetable intake and cancer risk. [50]. When results for intakes were reported as a continuous variable (e.g., for 40 g/d increase in intake), we rescaled the RR to a 1 serving per day increase in intakes [19], and included them only in the dose-response analysis. We used the methods of generalized least-squares trend estimation (GLST) analysis [54, 55], which requires that at least three categories of intake and the number of cases and person-years or non-cases per category is known. Whenever reported, the mean or median intake by category was assigned to the corresponding RR. We assigned the median in each category by calculating the average of the lower and upper bound. When the lowest and highest category was open-ended, we assumed the open-ended interval length was equal to the adjacent interval.
To examine the non-linear dose-response relationship, we carried out the best-fitting second-order fractional polynomial models [56]. The model with the lowest deviance was selected, and using a likelihood ratio test to evaluate the difference between the nonlinear and linear models [56].
Publication bias was assessed by using funnel plots and the further Begg’s adjusted rank correlation and Egger’s regression asymmetry test [57, 58]. All statistical analyses were performed using STATA (College Station, TX, USA; version 11.0) and R-package (Version 2.11.0 beta, R Development Core Team, NJ) statistical softwares. A two-tailed P value of < 0.05 represents significance.
ACKNOWLEDGMENTS
Shaojin Zhang and Jinjian Yang participated in the design of this manuscript. Shaojin Zhang, Zhankui Jia and Zechen Yan participated in abstracting the data and performing statistical analysis. All authors read and approved the final manuscript.
CONFLICTS OF INTEREST
None.
REFERENCES
1. Siegel RL, Miller KD, Jemal A. Cancer statistics, 2015. CA Cancer J Clin. 2015; 65:5–29.
2. Ljungberg B, Campbell SC, Choi HY, Jacqmin D, Lee JE, Weikert S, Kiemeney LA. The epidemiology of renal cell carcinoma. Eur Urol. 2011; 60:615–621.
3. Ferlay J S, Bray F, Forman D, Mathers C, Parkin DM. GLOBOCAN 2008 v1.2 Cancer Incidence and Mortality Worldwide: IARC CancerBase No. 10. Vol. 2012. Internation Agency for Research on Cancer; Lyon, France: 2008.
4. Hunt JD, van der Hel OL, McMillan GP, Boffetta P, Brennan P. Renal cell carcinoma in relation to cigarette smoking: meta-analysis of 24 studies. Int J Cancer. 2005; 114:101–108.
5. Wang F, Xu Y. Body mass index and risk of renal cell cancer: a dose-response meta-analysis of published cohort studies. Int J Cancer. 2014; 135:1673–1686.
6. Corrao G, Scotti L, Bagnardi V, Sega R. Hypertension, antihypertensive therapy and renal-cell cancer: a meta-analysis. Curr Drug Saf. 2007; 2:125–133.
7. Bao C, Yang X, Xu W, Luo H, Xu Z, Su C, Qi X. Diabetes mellitus and incidence and mortality of kidney cancer: a meta-analysis. J Diabetes Complications. 2013; 27:357–364.
8. Choueiri TK, Je Y, Cho E. Analgesic use and the risk of kidney cancer: a meta-analysis of epidemiologic studies. Int J Cancer. 2016; 134:384–396.
9. Khuda-Bukhsh AR, Das S, Saha SK. Molecular approaches toward targeted cancer prevention with some food plants and their products: inflammatory and other signal pathways. Nutr Cancer. 2014; 66:194–205.
10. Bradbury KE, Appleby PN, Key TJ. Fruit, vegetable, and fiber intake in relation to cancer risk: findings from the European Prospective Investigation into Cancer and Nutrition (EPIC). Am J Clin Nutr. 2014;100:394S–398S.
11. Macleod LC, Hotaling JM, Wright JL, Davenport MT, Gore JL, Harper J, White E. Risk factors for renal cell carcinoma in the VITAL study. J Urol. 2013; 190:1657–1661.
12. Daniel CR, Park Y, Chow WH, Graubard BI, Hollenbeck AR, Sinha R. Intake of fiber and fiber-rich plant foods is associated with a lower risk of renal cell carcinoma in a large US cohort. Am J Clin Nutr. 2013; 97:1036–1043.
13. Brock KE, Ke L, Gridley G, Chiu BC, Ershow AG, Lynch CF, Graubard BI, Cantor KP. Fruit, vegetables, fibre and micronutrients and risk of US renal cell carcinoma. Br J Nutr. 2012; 108:1077–1085.
14. Bertoia M, Albanes D, Mayne ST, Mannisto S, Virtamo J, Wright ME. No association between fruit, vegetables, antioxidant nutrients and risk of renal cell carcinoma. Int J Cancer. 2010; 126:1504–1512.
15. Lee JE, Mannisto S, Spiegelman D, Hunter DJ, Bernstein L, van den Brandt PA, Buring JE, Cho E, English DR, Flood A, Freudenheim JL, Giles GG, Giovannucci E, et al. Intakes of fruit, vegetables, and carotenoids and renal cell cancer risk: a pooled analysis of 13 prospective studies. Cancer Epidemiol Biomarkers Prev. 2009; 18:1730–1739.
16. Grieb SM, Theis RP, Burr D, Benardot D, Siddiqui T, Asal NR. Food groups and renal cell carcinoma: results from a case-control study. J Am Diet Assoc. 2009; 109:656–667.
17. Hsu CC, Chow WH, Boffetta P, Moore L, Zaridze D, Moukeria A, Janout V, Kollarova H, Bencko V, Navratilova M, Szeszenia-Dabrowska N, Mates D, Brennan P. Dietary risk factors for kidney cancer in Eastern and Central Europe. Am J Epidemiol. 2007; 166:62–70.
18. Bravi F, Bosetti C, Scotti L, Talamini R, Montella M, Ramazzotti V, Negri E, Franceschi S, La Vecchia C. Food groups and renal cell carcinoma: a case-control study from Italy. Int J Cancer. 2007; 120:681–685.
19. Weikert S, Boeing H, Pischon T, Olsen A, Tjonneland A, Overvad K, Becker N, Linseisen J, Lahmann PH, Arvaniti A, Kassapa C, Trichoupoulou A, Sieri S, et al. Fruits and vegetables and renal cell carcinoma: findings from the European prospective investigation into cancer and nutrition (EPIC). Int J Cancer. 2006; 118:3133–3139.
20. Lee JE, Giovannucci E, Smith-Warner SA, Spiegelman D, Willett WC, Curhan GC. Intakes of fruits, vegetables, vitamins A, C, and E, and carotenoids and risk of renal cell cancer. Cancer Epidemiol Biomarkers Prev. 2006; 15:2445–2452.
21. Handa K, Kreiger N. Diet patterns and the risk of renal cell carcinoma. Public Health Nutr. 2002; 5:757–767.
22. De Stefani E, Fierro L, Mendilaharsu M, Ronco A, Larrinaga MT, Balbi JC, Alonso S, Deneo-Pellegrini H. Meat intake, ’mate’ drinking and renal cell cancer in Uruguay: a case-control study. Br J Cancer. 1998; 78:1239–1243.
23. Lindblad P, Wolk A, Bergstrom R, Adami HO. Diet and risk of renal cell cancer: a population-based case-control study. Cancer Epidemiol Biomarkers Prev. 1997; 6:215–223.
24. Boeing H, Schlehofer B, Wahrendorf J. Diet, obesity and risk for renal cell carcinoma: results from a case control-study in Germany. Z Ernahrungswiss. 1997; 36:3–11.
25. Wolk A, Gridley G, Niwa S, Lindblad P, McCredie M, Mellemgaard A, Mandel JS, Wahrendorf J, McLaughlin JK, Adami HO. International renal cell cancer study. VII. Role of diet. Int J Cancer. 1996; 65:67–73.
26. Mellemgaard A, McLaughlin JK, Overvad K, Olsen JH. Dietary risk factors for renal cell carcinoma in Denmark. Eur J Cancer 1996;32A:673-682.
27. Chow WH, Gridley G, McLaughlin JK, Mandel JS, Wacholder S, Blot WJ, Niwa S, Fraumeni JF, Jr. Protein intake and risk of renal cell cancer. J Natl Cancer Inst. 1994; 86:1131–1139.
28. McLaughlin JK, Gao YT, Gao RN, Zheng W, Ji BT, Blot WJ, Fraumeni JF, Jr. Risk factors for renal-cell cancer in Shanghai, China. Int J Cancer. 1992; 52:562–565.
29. Negri E, La Vecchia C, Franceschi S, D’Avanzo B, Parazzini F. Vegetable and fruit consumption and cancer risk. Int J Cancer. 1991; 48:350–354.
30. Talamini R, Baron AE, Barra S, Bidoli E, La Vecchia C, Negri E, Serraino D, Franceschi S. A case-control study of risk factor for renal cell cancer in northern Italy. Cancer Causes Control. 1990; 1:125–131.
31. Fraser GE, Phillips RL, Beeson WL. Hypertension, antihypertensive medication and risk of renal carcinoma in California Seventh-Day Adventists. Int J Epidemiol. 1990; 19:832–838.
32. World Cancer Research Fund International/American Institute for Cancer Research. Continuous Update Project Report: Diet, Nutrition, Physical Activity and Kidney Cancer. 2015. Available at: wcrf.org/kidney-cancer-2015.
33. van Dijk BA, Schouten LJ, Kiemeney LA, Goldbohm RAandvan den Brandt PA. Vegetable and fruit consumption and risk of renal cell carcinoma: results from the Netherlands cohort study. Int J Cancer. 2005; 117:648–654.
34. Rashidkhani B, Lindblad P, Wolk A. Fruits, vegetables and risk of renal cell carcinoma: a prospective study of Swedish women. Int J Cancer. 2005; 113:451–455.
35. Prineas RJ, Folsom AR, Zhang ZM, Sellers TA, Potter J. Nutrition and other risk factors for renal cell carcinoma in postmenopausal women. Epidemiology. 1997; 8:31–36.
36. Janakiram NB, Mohammed A, Madka V, Kumar G, Rao CV. Prevention and treatment of cancers by immune modulating nutrients. Mol Nutr Food Res. 2016; 60:1275–1294.
37. Ho WJ, Simon MS, Yildiz VO, Shikany JM, Kato I, Beebe-Dimmer JL, Cetnar JP, Bock CH. Antioxidant micronutrients and the risk of renal cell carcinoma in the Women’s Health Initiative cohort. Cancer. 2015; 121:580–588.
38. Bosetti C, Scotti L, Maso LD, Talamini R, Montella M, Negri E, Ramazzotti V, Franceschi S, La Vecchia C. Micronutrients and the risk of renal cell cancer: a case-control study from Italy. Int J Cancer. 2007; 120:892–896.
39. Yuan JM, Gago-Dominguez M, Castelao JE, Hankin JH, Ross RK, Yu MC. Cruciferous vegetables in relation to renal cell carcinoma. Int J Cancer. 1998; 77:211–216.
40. Hu J, La Vecchia C, DesMeules M, Negri E, Mery L. Nutrient and fiber intake and risk of renal cell carcinoma. Nutr Cancer. 2008; 60:720–728.
41. Allen NE, Roddam AW, Sieri S, Boeing H, Jakobsen MU, Overvad K, Tjonneland A, Halkjaer J, Vineis P, Contiero P, Palli D, Tumino R, Mattiello A, et al. A prospective analysis of the association between macronutrient intake and renal cell carcinoma in the European Prospective Investigation into Cancer and Nutrition. Int J Cancer. 2009; 125:982–987.
42. Feskanich D, Rimm EB, Giovannucci EL, Colditz GA, Stampfer MJ, Litin LB, Willett WC. Reproducibility and validity of food intake measurements from a semiquantitative food frequency questionnaire. J Am Diet Assoc. 1993; 93:790–796.
43. Flagg EW, Coates RJ, Calle EE, Potischman N, Thun MJ. Validation of the American Cancer Society Cancer Prevention Study II Nutrition Survey Cohort Food Frequency Questionnaire. Epidemiology. 2000; 11:462–468.
44. Goldbohm RA, van den Brandt PA, Brants HA, van’t Veer P, Al M, Sturmans F, Hermus RJ. Validation of a dietary questionnaire used in a large-scale prospective cohort study on diet and cancer. Eur J Clin Nutr. 1994; 48:253–265.
45. George SM, Park Y, Leitzmann MF, Freedman ND, Dowling EC, Reedy J, Schatzkin A, Hollenbeck A, Subar AF. Fruit and vegetable intake and risk of cancer: a prospective cohort study. Am J Clin Nutr. 2009; 89:347–353.
46. Wu L, Sun D, He Y. Fruit and vegetables consumption and incident hypertension: dose-response meta-analysis of prospective cohort studies. J Hum Hypertens. 2016; 30:573–580.
47. Kaiser KA, Brown AW, Bohan Brown MM, Shikany JM, Mattes RD, Allison DB. Increased fruit and vegetable intake has no discernible effect on weight loss: a systematic review and meta-analysis. Am J Clin Nutr. 2014; 100:567–576.
48. Fujioka N, Fritz V, Upadhyaya P, Kassie F, Hecht SS. Research on cruciferous vegetables, indole-3-carbinol, and cancer prevention: A tribute to Lee W. Wattenberg. Mol Nutr Food Res. 2016; 60:1228–1238.
49. Moher D, Liberati A, Tetzlaff J, Altman DG. Preferred reporting items for systematic reviews and meta-analyses: the PRISMA statement. Bmj. 2009; 339:b2535.
50. Riboli E, Norat T. Epidemiologic evidence of the protective effect of fruit and vegetables on cancer risk. Am J Clin Nutr. 2003; 78:559S–569S.
51. Wells GA SB, O’Connell D, Peterson J, Welch V, Losos M, Tugwell P. The Newcastle-Ottawa Scale (NOS) for assessing the quality of nonrandomised studies in meta-analyses. Available at: http://www.ohri.ca/programs/clinical_epidemiology/oxford.asp. Accessed June 15, 2012.
52. DerSimonian R, Laird N. Meta-analysis in clinical trials. Control Clin Trials. 1986; 7:177–188.
53. Higgins JP, Thompson SG, Deeks JJ, Altman DG. Measuring inconsistency in meta-analyses. BMJ. 2003; 327:557–560.
54. Greenland S, Longnecker MP. Methods for trend estimation from summarized dose-response data, with applications to meta-analysis. Am J Epidemiol. 1992; 135:1301–1309.
55. Orsini N BR, Greenland S. Generalized least squares for trend estimation of summarized dose-response data. Stata J. 2006; 6:40–57.
56. Royston P. A strategy for modelling the effect of a continuous covariate in medicine and epidemiology. Stat Med. 2000; 19:1831–1847.
57. Begg CB, Mazumdar M. Operating characteristics of a rank correlation test for publication bias. Biometrics. 1994; 50:1088–1101.
58. Egger M, Davey Smith G, Schneider M, Minder C. Bias in meta-analysis detected by a simple, graphical test. Bmj. 1997; 315:629–634.