
INTRODUCTION
Breast cancer (BC) is the leading cause of cancer-related death in women aged 20 to 59 years, with an estimated 231,840 new cases of invasive BC among women in the USA during 2015 [1, 2]. BC alone is expected to account for 29% of all new cancers in women [3]. In China, the incidence of BC is growing at a rate of 3% per year, and the mortality rate increased by 38.9% in cities. Up to now, observational studies have revealed that breast cancer is a complex disease caused by environmental exposures and genetic factors such as germline mutations in a multi-step process of breast carcinogenesis. Recent numerous genomic studies reported that breast cancer consists of a complex biological process with patient-specific genetic variations [4]. The single nucleotide polymorphisms (SNPs) in many candidate genes, especially in signal transduction pathways including the phosphatase and tensin homolog deleted on chromosome10 (pTEN)/phosphatidylinositol-4,5- bisphosphate 3-kinase catalytic subunit alpha (PI3K)/AKT serine/threonine kinase 1(AKT) signaling pathway, often contribute to the origin, propagation, and treatment responses of a cancer and prognosis [5–8]. Therefore, improving the treatment efficacy and prognosis prediction requires a better understanding of the genetic risk factors that involve in the breast cancer carcinogenesis.
The PI3K signaling pathway is one of the most important kinase cascades and exerts its function through its downstream effector AKT in regulating various cell functions including cell proliferation, migration, apoptosis, and angiogenesis. Mutations and dysregulation in this pathway results from mutations or altered expression of an upstream regulator of the AKT activity [9]. Phosphatase and tensin homolog deleted on chromosome 10 (PTEN) dephosphorylates the lipid phosphatidylinositol-3,4,5-triphosphate (PIP3), which is the product of PI3K [10]. The over activation or constitutive activation of PI3K as well as the loss of PTEN function results in the accumulation of cellular PIP3 and its activated downstream effector AKT. More evidences showed that genetic variations of the genes related to this pathway facilitate carcinogenesis and affect individuals’ susceptibility and prognosis to many cancers [11–14]. One study investigated PTEN rs701848, PIK3CA rs2699887 polymorphisms in a case-control study that consisted of 780 colorectal cancer patients and 764 cancer-free controls, and observed that PTEN rs701848 variants were associated with colorectal cancer risk and prognosis of CRC patients treated with FOLFOX regimen [12]. In another study of gastric cancer, Wang et al. evaluated five selected SNPs located in the AKT promoter region and found that the rs2494752 AG/GG variant genotypes were associated with increased gastric cancer risk, and consequentially the luciferase activity was increased in the patients carrying rs2494752 G allele [13]. Zhu et al. investigated seven SNPs in the PI3K/PTEN/AKT/mTOR signaling pathway in 199 advanced non-small cell lung cancer patients, and observed significant associations between platinum-based chemotherapy response and AKT1 rs2494752 AG genotype [14].
Previous studies have investigated associations between genetic variations in PTEN/PI3K/AKT signaling pathway and cancer risk [15–18], however, the association between PTEN rs701848, PIK3CA rs2699887, and AKT1 rs2494752 polymorphisms and sporadic BC in Chinese population has not been investigated yet. In light of the critical role of the PTEN/PI3K/AKT pathway in maintaining proper cellular function, it is possible that some candidate functional SNPs of genes which located in the 5’-untranslated regions (5’UTR) and 3' UTRs of this pathway may have an effect on susceptibility and response to chemotherapy and prognosis of breast cancer. Therefore, we conducted a hospital-based case-control study of 920 BC patients and 908 cancer-free controls to evaluate associations between SNPs rs701848 located in the 3’UTR of PTEN, PIK3CA rs2699887, and rs2494752 located in the 5’UTR of AKT1 and breast cancer risk and response to CE(A)F regimen and clinical outcomes in a Chinese Population.
RESULTS
Characteristics of study population
The baseline characteristics and clinical variables of breast cancer patients and cancer-free controls are summarized in Supplementary Table 2. The study included 920 patients with pathologically confirmed breast cancer and a group of 908 age- and gender- matched cancer-free healthy controls. The age was matched between breast cancer patients (range: 24-75 years; median: 52 years) and controls (range: 22-79 years; median: 52 years). There were no significant differences in the distributions of age and menopausal status between cases and controls (P=0.676 and P=0.682, respectively). Among the cases, 89.4% of CRC patients were invasive ductal cancer (IDC) of breast origin, and in the clinical stage I or II (63.7%). In this cohort, 204 cases underwent preoperative NCT (CE(A)F regimen), and 67.5% of the patients received postoperative anthracycline-based chemotherapy. The clinical variables of age, menopausal status, and first-degree family history of cancer were adjusted for any residual confounding effects in later logistic regression analyses.
Genotypes in BC cases and controls
Table 1 summarized thefrequencies of allelic and genotype distribution for PTEN rs701848, PIK3CA rs2699887, and AKT1 rs2494752 in both 920 cases and 908 controls. The observed genotype frequencies of these three SNPs in the control group all conformed well to Hardy-Weinberg equilibrium (P>0.05). As shown in Table 2, there was a significant difference in the genotype distribution of the PTEN rs701848 and AKT1 rs2494752 polymorphisms between the breast cancer patients and the non-cancer controls. For PTEN rs701848, the allele and genotype distributions were statistically different between BC cases and controls (TC vs. TT: adjusted OR= 1.254, 95% CI=1.006-1.562, P=0.043; CC vs. TT: adjusted OR=1.535, 95% CI=1.167-2.018, P= 0.002). Furthermore, a significant increased BC risk was observed in the dominant model (TC/CC vs. TT: adjusted OR=1.326, 95% CI=1.075-1.634, P=0.008), meanwhile decreased risk in the recessive model (TC/TT vs. CC: adjusted OR=0.757, 95% CI=0.600-0.954, P=0.018). Moreover, the individual carrying C allele had a significant increased risk of developing BC compared with those carrying T allele (C vs. T: adjusted OR=1.224, 95% CI=1.073-1.396, P=0.003). For AKT rs2494752, a higher frequency of AG genotype were detected among cases in comparison to the controls (53.4% vs. 49.7%, adjusted OR=1.236, 95% CI=1.005-1.519, P=0.045). Based on the dominant model, we further observed that individuals harboring AG/AA genotype had a vital increased susceptibility to BC compared with those carrying GG genotype (adjusted OR=1.231, 95% CI=1.010-1.499, P=0.039). However, no significant difference in the frequencies of rs2699887 in the PIK3CA gene were observed between the BC cases and controls.
Table 1: Frequency distribution of PTEN/PI3K/AKT pathway genotypes and their associations with the risk for developing BC
Genotypes |
No. of cases |
% |
No. of controls† |
% |
p‡ |
OR |
95% CI |
|---|---|---|---|---|---|---|---|
PTEN rs701848 |
|||||||
TT |
215 |
24.4 |
273 |
30.0 |
|
1 |
|
TC |
468 |
53.2 |
474 |
52.1 |
0.043 |
1.254 |
1.006-1.562 |
CC |
197 |
22.4 |
163 |
17.9 |
0.002 |
1.535 |
1.167-2.018 |
Dominant model |
|||||||
TT |
215 |
24.4 |
273 |
30.0 |
|
1 |
|
TC/CC |
665 |
77.6 |
637 |
70.0 |
0.008 |
1.326 |
1.075-1.634 |
Recessive model |
|||||||
CC |
197 |
22.4 |
163 |
17.9 |
|
1 |
|
TC/TT |
683 |
77.6 |
747 |
82.1 |
0.018 |
0.757 |
0.600-0.954 |
Allele frequency |
|||||||
T allele |
898 |
51.0 |
1020 |
56.0 |
|
1 |
|
C allele |
862 |
49.0 |
800 |
44.0 |
0.003 |
1.224 |
1.073-1.396 |
PIK3CA rs2699887 |
|||||||
GG |
671 |
76.3 |
689 |
75.7 |
|
1 |
|
GA |
197 |
22.4 |
201 |
22.1 |
0.955 |
1.006 |
0.805-1.258 |
AA |
12 |
1.4 |
20 |
2.2 |
0.185 |
0.616 |
0.299-1.270 |
Dominant model |
|||||||
GG |
671 |
76.3 |
689 |
75.7 |
|
1 |
|
GA/AA |
209 |
23.7 |
221 |
24.3 |
0.791 |
0.971 |
0.782-1.206 |
Recessive model |
|||||||
AA |
12 |
1.4 |
20 |
2.2 |
|
1 |
|
GA/GG |
868 |
98.6 |
890 |
97.8 |
0.183 |
1.625 |
0.790-3.345 |
Allele frequency |
|||||||
G allele |
1539 |
87.4 |
1579 |
86.8 |
|
1 |
|
A allele |
221 |
12.6 |
241 |
13.2 |
0.541 |
0.941 |
0.774-1.144 |
AKT1 rs2494752 |
|||||||
AA |
271 |
30.8 |
322 |
35.4 |
|
1 |
|
AG |
470 |
53.4 |
452 |
49.7 |
0.045 |
1.236 |
1.005-1.519 |
GG |
139 |
15.8 |
136 |
14.9 |
0.183 |
1.214 |
0.912-1.617 |
Dominant model |
|||||||
GG |
139 |
15.8 |
136 |
14.9 |
|
1 |
|
AG/AA |
741 |
84.2 |
774 |
85.1 |
0.039 |
1.231 |
1.010-1.499 |
Recessive model |
|||||||
AA |
271 |
30.8 |
322 |
35.4 |
|
1 |
|
AG/GG |
609 |
69.2 |
588 |
64.6 |
0.618 |
0.937 |
0.724-1.211 |
Allele frequency |
|||||||
A allele |
1012 |
57.5 |
1096 |
60.2 |
|
1 |
|
G allele |
748 |
42.5 |
724 |
39.8 |
0.098 |
1.119 |
0.979-1.278 |
Combined genotypes |
|||||||
1 |
68 |
7.7 |
273 |
30.0 |
|
1 |
|
2 |
770 |
87.5 |
501 |
55.1 |
<0.001 |
6.170 |
4.624-8.234 |
3 |
42 |
4.8 |
136 |
14.9 |
0.334 |
1.240 |
0.802-1.918 |
2+3 |
812 |
92.3 |
637 |
70.0 |
<0.001 |
5.118 |
3.848-6.806 |
Abbreviations: OR, odds ratio; CI, confidence interval.
†The observed genotype frequency among individuals in the control group was in agreement with Hardy-Weinberg equilibrium (p2+2pq+q2=1: p=0.092 for PTEN rs701848; p=0.299 for AKT1 rs2494752; p=0.243 for PIK3CA rs2699887).
‡p were calculated from 2-sided chi-square tests for either genotype distribution or allele frequency.
Combined genotype: 1:rs701848TT and rs2494752AA; 2: rs701848TC and rs2494752GA, rs701848TC and rs2494752AA, rs701848CC and rs2494752GA; 3: rs701848CC and rs2494752GG.
Thereafter, we further investigated the effect of the combined genotypes of PTEN rs701848 and AKT1 rs2494752 on the BC risk. The combined effect were group according to the rs701848TT and rs2494752AA considered as references. The combined effect status 2 or 2+3 were significantly associated with an increased risk of BC observed (adjusted OR (95%CI)=6.170(4.624-8.234), P<0.001; adjusted OR (95%CI) =5.118(3.848-6.806), P<0.001, respectively) (Table 1).
Association of PTEN/PI3K/AKT pathway polymorphisms and progression of BC
In the case-only analysis, we further performed stratification analysis to explore the association between polymorphisms of the PTEN/PI3K/AKT pathway genes and various clinicopathological characteristics of breast cancer, as shown in Supplementary Table 3 and Figure 1. We found that the frequency (86.8%) of the AKT1 rs2494752 GA/AA genotypes in BC patients with older ages (≥52 years old) was significantly higher than that those with younger ages (<52 years old) (P=0.046, Figure 1A). Furthermore, the frequencies of patients with the AKT1 rs2494752 GG genotypes in the Lymph node metastasis status (Node-positive, 18.9%) were much higher than in the Lymph node metastasis status (Node-negative, 13.2%) (P=0.020, Figure 1B). However, there was no significant association detected between the other two SNPs in PTEN/PI3K genes and progression of BC (Supplementary Table 3).
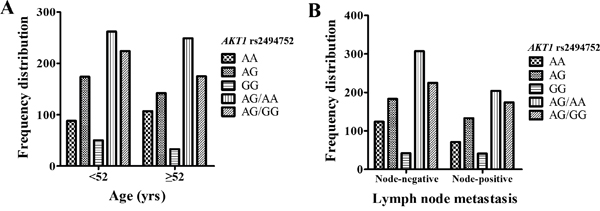
Figure 1: Hstogram and box plots illustrating the frequency distribution of AKT1 rs2494752 polymorphism and stratified clinicopathological features. Frequency distribution of AKT1 rs2494752 genotypes classified by age of onset (<52 years, ≥52 years) A. and Lymph node metastasis (Node-negative, Node-positive) B.
Effects of PTEN/PI3K/AKT pathway polymorphisms on response to NCT and the survival of BC
Of the 920 BC patients, 220 patients received neoadjuvant CE(A)F chemotherapy. Among the 220 patients, 164 patients were responders and 56 were nonresponders to CE(A)F NCT (Supplementary Table 4). Among the responders, the percentages of AKT1 rs2494752 AA, AG, GG genotypes were 65.2%,76.1% and 86.8%, respectively (Table 2). GG genotype had significantly rates of response to NCT chemotherapy when compared to the AA genotype (adjusted OR=0.325, 95% CI=0.107-0.992, P= 0.048). However, there was no significant association observed between the PTEN rs701848 and PIK3CA rs2699887 genetic polymorphismsand the response to neoadjuvant CE(A)F chemotherapy (Table 2).
Table 2: Association of PTEN/PI3K/AKT pathway genetic polymorphisms with therapeutic response to neoadjuvant CE(A)F chemotherapy
Variables |
CR and PR |
SD and PD |
p |
OR |
95%CI |
||
|---|---|---|---|---|---|---|---|
No. |
% |
No. |
% |
||||
PTEN rs701848 |
|||||||
TT |
40 |
70.2 |
17 |
29.8 |
|
1 |
|
TC |
84 |
75.7 |
27 |
24.3 |
0.953 |
0.976 |
0.431-2.207 |
CC |
40 |
76.9 |
12 |
23.1 |
0.254 |
0.582 |
0.230-1.475 |
Dominant model |
|||||||
TT |
40 |
70.2 |
17 |
29.8 |
|
1 |
|
TC/CC |
124 |
76.1 |
39 |
23.9 |
0.162 |
0.592 |
0.284-1.234 |
Recessive model |
|||||||
CC |
40 |
76.9 |
12 |
23.1 |
|
1 |
|
TC/TT |
124 |
73.8 |
44 |
26.2 |
0.631 |
1.208 |
0.558-2.613 |
PIK3CA rs2699887 |
|||||||
GG |
124 |
75.2 |
41 |
24.8 |
|
1 |
|
GA |
37 |
72.5 |
14 |
27.5 |
0.658 |
1.847 |
0.129-26.358 |
AA |
3 |
75.0 |
1 |
25.0 |
0.651 |
1.843 |
0.123-27.701 |
Dominant model |
|||||||
GG |
124 |
75.2 |
41 |
24.8 |
|
1 |
|
GA/AA |
40 |
72.7 |
15 |
27.3 |
0.926 |
1.035 |
0.499-2.146 |
Recessive model |
|||||||
AA |
3 |
75.0 |
1 |
25.0 |
|
1 |
|
GA/GG |
161 |
74.5 |
55 |
25.5 |
0.651 |
0.542 |
0.038-7.682 |
AKT1 rs2494752 |
|||||||
AA |
45 |
65.2 |
24 |
34.8 |
|
1 |
|
AG |
86 |
76.1 |
27 |
23.9 |
0.241 |
0.528 |
0.182-1.534 |
GG |
33 |
86.8 |
5 |
13.2 |
0.048 |
0.325 |
0.107-0.992 |
Dominant model |
|||||||
GG |
33 |
86.8 |
5 |
13.2 |
|
1 |
|
AG/AA |
131 |
72.0 |
51 |
28.0 |
0.119 |
2.270 |
0.811-6.355 |
Recessive model |
|||||||
AA |
45 |
65.2 |
24 |
34.8 |
|
1 |
|
AG/GG |
119 |
78.8 |
32 |
21.2 |
0.077 |
0.543 |
0.276-1.068 |
Abbreviations: CR, complete response; PR, partial response; PD, progressive disease; SD, stable disease.
†p, OR and 95% CIs were calculated by unconditional logistic regression adjusted for age, menopausal status, family history of BC, tumor size, clinical stages, lymph node metastasis.
To further confirm the predictive effect of the SNPs on prognosis, multivariate Cox regression analysis and Kaplan-Meier analysis were performed to evaluate the correlations between genetic polymorphisms of PTEN rs701848, PIK3CA rs2699887, and AKT1 rs2494752 and the prognosis of BC patients after treated with CE(A)F regimen chemotherapy (n=594). We observed that rs2699887 genotypes in the PIK3CA gene were significantly associated with the DFS and OS of BC patients in the recessive model (log-rank test: P=0.017 and P=0.003, respectively). In the recessive model, BC patients carrying PIK3CA rs2699887 GA/AA genotypes had a significantly longer DFS (median survival time, MST=89 months, 95% CI=73-106 months) and OS time (MST=106 months, 95% CI=80-132 months) in comparison to the carriers who had AA genotype (DFS:MST=40 months, 95% CI=30-51 months, OS: MST=52 months, 95% CI=42-62 months), as shown in Figure 2A, 2B. Multivariate Cox regression analysis further found that PIK3CA rs2699887 GA/AA genotypes acted as protective prognostic factors (DFS: adjusted HR=0.384, 95% CI=0.170-0.867, P=0.021;OS: adjusted HR=0.192, 95% CI=0.059-0.619, P=0.006) adjusted by age, menopausal status, family history of BC, tumor size, clinical stages, lymph node metastasis, outlined in Table 3. Furthermore, Kaplan-Meier analysis revealed that AKT1 rs2494752 polymorphism was significantly associated with the DFS or OS of BC patients. AKT1 rs2494752 AG genotype carriers showed significantly shorter DFS time (MST=71 months, 95% CI=58-84 months; Figure 2C) when compared with AA genotype, and verified in multivariate Cox regression model analysis (adjusted HR=0.618, 95% CI=0.417-0.917, P=0.017) (Table 3). Moreover, carrying AKT1 rs2494752 GG genotype had significantly shorter DFS and OS time (DFS: MST=40 months, 95% CI=30-51 months; OS: MST= 53 months, 95% CI=43-62 months; Figure 2D, 2E). Multivariate Cox regression model analysis also evaluated AKT1 rs2494752 GG genotype as the independent prognostic factor for BC (DFS: adjusted HR=1.523, 95% CI=1.012-2.293, P=0.044; OS: adjusted HR=2.321, 95% CI=1.281-4.204, P=0.005)(Table 3). However, in this study we did not found significant association between the PTEN rs701848 polymorphisms and clinical outcomes in BC patients treated with CE(A)F regimen treatment.
Table 3: Multivariate COX regression analysis of PTEN/PI3K/AKT pathway polymorphisms and clininopathological features in association with DFS and OS in BC patients with CE(A)F chemotherapy
Variables |
DFS |
OS |
||||
|---|---|---|---|---|---|---|
HR |
95% CI |
p |
HR |
95% CI |
p |
|
PTEN rs701848 |
||||||
TT |
1 |
|
|
1 |
|
|
TC |
1.127 |
0.785-1.620 |
0.517 |
1.048 |
0.508-2.164 |
0.899 |
CC |
0.998 |
0.801-1.244 |
0.988 |
1.176 |
0.791-1.749 |
0.423 |
Dominant model |
||||||
TT |
1 |
|
|
1 |
|
|
TC/CC |
1.092 |
0.773-1.545 |
0.617 |
1.152 |
0.587-2.263 |
0.681 |
Recessive model |
||||||
CC |
1 |
|
|
1 |
|
|
TC/TT |
1.068 |
0.748-1.524 |
0.719 |
0.702 |
0.380-1.297 |
0.259 |
PIK3CA rs2699887 |
||||||
GG |
1 |
|
|
1 |
|
|
GA |
1.033 |
0.745-1.433 |
0.846 |
1.351 |
0.684-2.668 |
0.387 |
AA |
1.028 |
0.813-1.300 |
0.818 |
1.340 |
0.870-2.064 |
0.185 |
Dominant model |
||||||
GG |
1 |
|
|
1 |
|
|
GA/AA |
0.704 |
0.488-1.016 |
0.061 |
1.525 |
0.829-2.804 |
0.175 |
Recessive model |
||||||
AA |
1 |
|
|
1 |
|
|
GA/GG |
0.384 |
0.170-0.867 |
0.021 |
0.192 |
0.059-0.619 |
0.006 |
AKT1 rs2494752 |
||||||
AA |
1 |
|
|
1 |
|
|
AG |
0.618 |
0.417-0.917 |
0.017 |
1.305 |
0.679-2.509 |
0.425 |
GG |
1.523 |
1.012-2.293 |
0.044 |
2.321 |
1.281-4.204 |
0.005 |
Dominant model |
||||||
GG |
1 |
|
|
1 |
|
|
AG/AA |
0.948 |
0.621-1.447 |
0.804 |
0.633 |
0.305-1.315 |
0.220 |
Recessive model |
||||||
AA |
1 |
|
|
1 |
|
|
AG/GG |
1.042 |
0.761-1.427 |
0.798 |
1.463 |
0.761-2.811 |
0.254 |
Age, yrs |
||||||
<52 |
1 |
|
|
1 |
|
|
≥52 |
1.379 |
0.846-2.249 |
0.198 |
1.131 |
0.408-3.137 |
0.813 |
Menopausal status |
||||||
Premenopausal |
1 |
|
|
1 |
|
|
Postmenopausal |
0.653 |
0.402-1.060 |
0.085 |
0.946 |
0.346-2.588 |
0.915 |
Family history of BC |
||||||
No |
1 |
|
|
1 |
|
|
Yes |
0.510 |
0.259-1.005 |
0.052 |
1.037 |
0.404-2.660 |
0.940 |
Tumor size (cm) |
||||||
≤ 2.0 |
1 |
|
|
1 |
|
|
>2.0 |
2.018 |
1.298-3.137 |
0.002 |
2.175 |
0.892-5.305 |
0.087 |
Clinical stages |
||||||
I or II |
1 |
|
|
1 |
|
|
III or IV |
2.050 |
1.466-2.867 |
0.001 |
3.056 |
1.571-5.945 |
0.001 |
Lymph node metastasis |
||||||
Node-negative |
1 |
|
|
|
|
|
Node-positive |
0.819 |
0.595-1.129 |
0.223 |
0.937 |
0.526-1.670 |
0.888 |
†p, HR(95%CI) were assessed using multivariate Cox regression analysis adjusted by age, menopausal status, family history of BC, tumor size, clinical stages, lymph node metastasis.
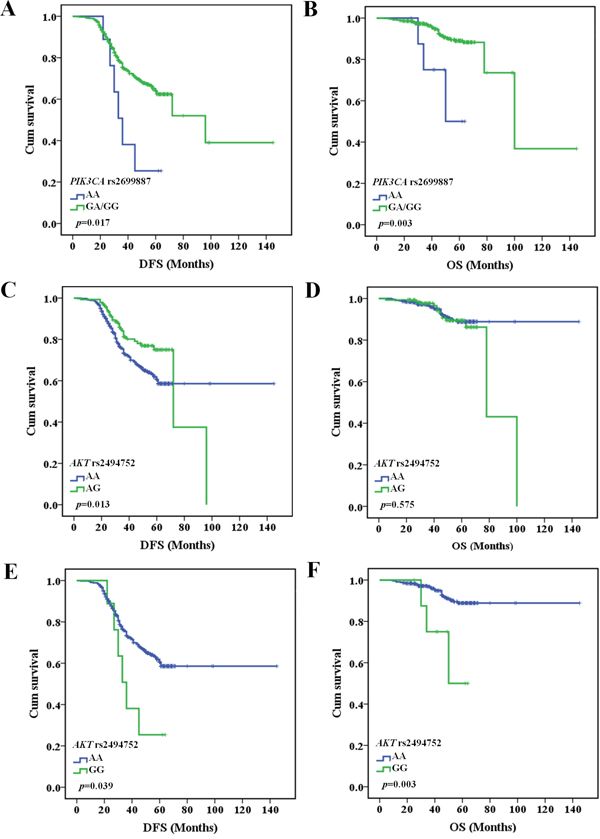
Figure 2: The relationship between the AKT1 rs2494752 polymorphism and BC prognosis according to Kaplan-Meier analysis. PIK3CA rs2699887 GA/GG genotype had longer DFS A. and OS B. in BC patients with CE(A)F regimen chemotherapy. AKT1 rs2494752 AG genotype had shorter DFS C., but no correlation with OS D. in BC patients after CE(A)F regimen chemotherapy. AKT1 rs2494752 GG genotype had shorter DFS E. and OS F. in BC patients after CE(A)F regimen chemotherapy.
Multiple dimension reduction (MDR) analysis
To further evaluate the existence of possible gene, clinical parameters interaction in association with the clinical outcomes, high-order interactions assessed by using the MDR analysis was performed with inclusion of the 3 selected SNPs (i.e., PTEN rs701848, PIK3CA rs2699887, and AKT1 rs2494752) and 7 known risk factors (i.e., age at diagnosis, menopausal status, family history, tumor size, clinical stages, lymph node metastasis, histology. In this MDR analysis, 4 risk factors combination were the best model with the highest cross-validation consistency (CVC) and the lowest prediction error in comparison to the one factor model among all 4 risk factors. Moreover, the 10-factor model had a maximum CVC and a minimum prediction error, with the prediction error being statistically significant (Table 4) both in DFS and OS. Taken together, the 10-factor model showed a better prediction prognosis than the 5-factor model and represented the best model to predict BC prognosis for this study.
Table 4: MDR analysis for the prediction of prognosis with and without 3 SNPs genotypes
Best interaction models |
DFS |
OS |
||||
|---|---|---|---|---|---|---|
Cross-validation Consistency |
P† |
Training Odds Ratio |
Cross-validation Consistency |
P† |
Training Odds Ratio |
|
1 |
100/100 |
<0.0001 |
3.25(2.37-4.45) |
90/100 |
<0.0001 |
8.69(4.97-15.18) |
1,2 |
100/100 |
<0.0001 |
3.37(2.46-4.64) |
100/100 |
<0.0001 |
7.92(4.58-13.69) |
1,2,3 |
100/100 |
<0.0001 |
3.48(2.53-4.78) |
100/100 |
<0.0001 |
8.07(4.67-13.96) |
1,2,3,4 |
100/100 |
<0.0001 |
3.40(2.48-4.66) |
100/100 |
<0.0001 |
8.52(4.93-14.74) |
1,2,3,4,5 |
100/100 |
<0.0001 |
3.46(2.53-4.75) |
100/100 |
<0.0001 |
8.09(4.82-13.59) |
1,2,3,4,5,6 |
100/100 |
<0.0001 |
3.53(2.58-4.85) |
100/100 |
<0.0001 |
7.97(4.61-13.78) |
1,2,3,4,5,6,7 |
100/100 |
<0.0001 |
3.32(2.43-4.55) |
100/100 |
<0.0001 |
7.97(4.75-13.38) |
1,2,3,4,5,6,7,8 |
100/100 |
<0.0001 |
3.23(2.34-4.41) |
100/100 |
<0.0001 |
8.56(5.06-14.46) |
1,2,3,4,5,6,7,8,9 |
100/100 |
<0.0001 |
3.55(2.59-4.87) |
100/100 |
<0.0001 |
8.24(4.76-14.25) |
1,2,3,4,5,6,7,8,9,10 |
100/100 |
<0.0001 |
3.83(2.71-5.41) |
100/100 |
<0.0001 |
9.34(5.48-15.92) |
Abbreviations: MDR, multifactor dimensionality reduction.
P† value for 1000-fold permutation test.
The best model with maximum cross-validation consistency and minimum prediction error rate was in bold.
labels: 1, age at diagnosis; 2, menopausal status; 3, family history; 4, tumor size; 5, clinical stages; 6, lymph node metastasis;7, histology;8, PTEN rs701848; 9, PIK3CA rs2699887;10, AKT1 rs2494752.
Effect of the rs2494752 polymorphism on AKT1 transcriptional activity
We generated reporter gene constructs containing either rs2494752 A or G allele for assess the biological functional effect of rs2494752 SNP on the AKT1 transcription. The reporter plasmids were transfected into 293T and MCF7 cell lines with. The plasmid containing the rs2494752 G allele showed a significantly higher luc activity expression, in comparison to the A allele, as shown in Figure 3. The results indicated that the SNP rs2494752 G allele in the promoter region had an increased transcriptional activity of the AKT1 gene.
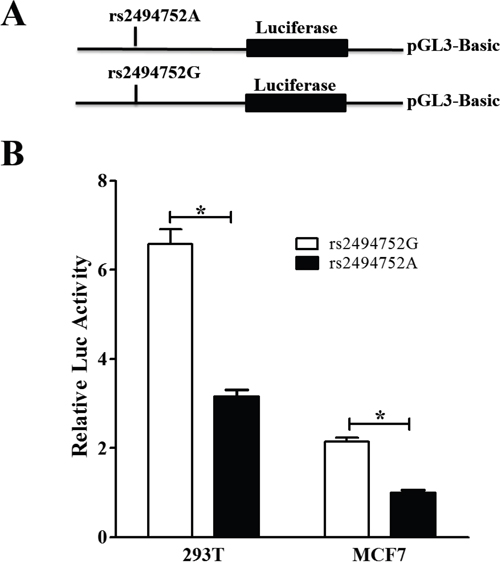
Figure 3: Effect of the rs2494752 polymorphism on the AKT1 promoter activity. Schematic representation of reporter plasmids containing the AKT1 rs2494752 A or G allele A., and the two constructs were transiently transfected into the 293T and MCF7 cells B. Data were measured as mean ± standard deviation (SD) from 3 separate experiments that were each performed in triplicate (*P<0.05).
DISCUSSION
The PI3K/PTEN/AKT pathway play a critical role in balancing cell growth and death. Mutations or dysregulation of genes involved in this pathway has been associated with invasion, metastasis, and prognosis of a variety of cancers, including BC [19]. Studies confirmed that PIK3CA mutations have been observed as a common occurrence in BC, and the mutations occur at a frequency of 27% to 36% [20]. Additional PI3K pathway alterations in BC include Akt and PTEN mutations, or loss of PTEN protein [21]. Beyond identifying PI3K/PTEN/AKT pathway mutations for understanding breast cancer biology, there are important considerations when this information is used for patient cancer risk prediction and treatment selection. The specific PI3K/PTEN/AKT genetic variations may both impact the treatment response and prognosis. Therefore, in the present study we for the first time performed a case-control study to explore systematically the correlation of PI3K/PTEN/AKT pathway genetic variations with the susceptibility, clinicopathological features, and response to treatment and clinical outcomes of BC patients after CE(A)F regimen.
The present study firstly evaluated the effect of three selected potentially functional SNPs of PI3K/PTEN/AKT pathway on risk of BC. The major finding was a significant association of PTEN rs701848 TC/CC genotypes and C allele and AKT rs2494752 AG/AA genotype with an increased BC risk under a dominant model in a relatively large cohort (n=920). Our finding that PTEN rs701848 polymorphism predicted the individual susceptibility to the development of BC is similar to the results from the studies reported in other tumors such as colorectal cancer, esophageal squamous cell carcinoma (ESCC)[8, 12, 22]. PTEN rs701848 SNP is located at 3’-UTR region, which can be targeted by microRNAs, and might alter the strength of microRNAs binding site near the SNP rs701848, thus influencing gene regulation and protein expression. Lin’ study on colorectal cancer (CRC) [12] reported that patients with rs701848 TC/CC genotype in the dominant model and C allele were more likely to be increased CRC risk than carrying CC genotype patients. Xu et al. [8] revealed that the carriers of homozygous mutant of rs701848 polymorphism increased ESCC risk than those with wild-type homozygotes. It is worthy to note that in another 2 case-control studies, one observed that the distribution of genotypes or alleles at PTEN rs701848 T/C possessing notably higher proportion in ESCC cases (n=304) than in the controls (n=413) [6], however, the other study did not found any significant differences of the genotype in PTEN rs701848 in ESCC patients (n=226) [18]. Although above studies investigated the cancer patients, the different kind of cancer and populations could differ in genetic variations, which can contribute to the discrepancies in these results. Thus, the function of the SNP still needs to be further investigated in future studies. For AKT rs2494752 polymorphism, Wang et al [4] found a significantly elevated gastric cancer risk in the patients with the rs2494752 AG/GG variant genotypes. Thereafter, we further investigated the effect of the combined genotypes of PTEN rs701848 and AKT1 rs2494752 on the BC risk, and found 6.170-fold increased risk in rs701848CC and rs2494752GG genotypes. Our results suggested that the PTEN rs701848 and AKT1 rs2494752 polymorphisms may be employed as biomarkers for the prediction of susceptibility of BC. In addition, we analyzed the association between PI3K/PTEN/AKT pathway polymorphisms and clinicopathological features of BC patients. We observed that AKT1 rs2494752 polymorphism was significantly associated with the age of onset, lymph node metastasis status, suggesting that rs2494752 genotype may be involved in the development and be used as potential biomarker for early screening of the age of onset and the lymph node metastasis status of BC patients.
CE(A)F regimen chemotherapy has been the mainstay of NCT therapy for BC patients, however, the majority of patients will develop resistant, and ultimately recurrence [23, 24]. It is our hope that this study will add to the body of literature for prediction the PI3K/PTEN/AKT pathway genetic polymorphisms lead to individual variation in response to CE(A)F regimen and prognosis. In the present study, we found that the response rate to CE(A)F regimen NCT was higher in the AKT1 rs2494752 GG genotype carriers when compared to the rs2494752 AA genotype. Thereafter, we further investigated the association of PI3K/PTEN/AKT pathway polymorphisms with the survival time of BC patients treated with CE(A)F regimen. It is worth to note that PIK3CA rs2699887 GA/AA genotypes were related to a significantly longer DFS and OS in the recessive model, and multivariate COX and MDR analysis confirmed an independent favorable prognostic value of rs2699887 polymorphism in BC patients. Furthermore, carrying AKT1 rs2494752 AG or GG genotype showed significantly shorter DFS time when compared with AA genotype, and verified in multivariate Cox and MDR analysis. The rs2494752 SNP is located at the 5’near region of AKT1 gene, a region predicted to be the potential promoter region of AKT1 based on sequence alignments, which may disrupt a potential cis-regulatory module affecting gene transcription and translation, and luciferase assay showed that the SNP rs2494752 G allele in the promoter region had an increased transcriptional activity of the AKT1 gene. Therefore, our results suggested that the polymorphisms in the AKT1 gene may represent an important potential therapeutic and prognosis for the individual precise treatment in BC patients.
To the best of our knowledge, the present study firstly provide evidence that PI3K/PTEN/AKT pathway polymorphism is associated with susceptibility, clinicopathological features and clinical outcome in BC patients treated with CE(A)F regimen in a large and well characterized samples. This data suggest that PTEN rs701848 and AKT1 rs2494752 polymorphisms had a main effect on increasing risk of developing BC, and may be a vital response and prognostic indicator for BC, and employed as candidate biomarker for the prediction of susceptibility and potential chemotherapy in BC patients with CE(A)F regimen in the future.
MATERIALS AND METHODS
Study population
This study included 880 patients with breast cancer and 910 age- and gender- matched healthy controls. The patients were recruited at Department of breast cancer, Cancer Hospital of China Medical University, Liaoning Cancer Hospital & Insititute, Liaoning Province, China between July 2009 and December 2015. This cohort was newly diagnosed, histopathologically confirmed and without prior history of other cancers or previous chemotherapy or radiotherapy. Before recruitment, the study was approved by the Research Ethics Committee of China Medical University. The informed consent was obtained from each subject, and detailed personal information on demographic characteristics, smoking and family history of caner were collected by face-to-face interview. Each subject donated 5 mL of venous blood after providing a written informed consent.
The regimens of anthracycline-based chemotherapy contain: CEF (Cyclophosphamide, Epirubicin and 5-Fluorouracil) and CAF (Cyclophosphamide, Adriamycin and 5-Fluorouracil). Patients’ response to anthracycline-based regimen was assessed after the first two or three cycles neoadjuvant chemotherapy (NCT) and determined by the Response Evaluation Criteria in Solid Tumors (RECIST) criteria. All responses were re-evaluated at least 4 weeks after initial assessment. For data analysis, complete responses (CR), partial response (PR) were combined as responders, stable disease (SD) and progressive disease (PD) were grouped as non-responders. Follow-up was performed per two months from the time of enrollment till death or the latest follow-up. Disease–free survival (DFS) was defined as the time between the first day of treatment and an occurrence of recurrence, metastases, death or last follow–up. Overall survival (OS) was calculated as the time between the first day of treatment and death or the last known follow-up.
DNA extraction and polymorphism genotyping
Genomic DNA was extracted from the peripheral blood (5 mL) by Genomic DNA Extraction Kit Ver.5.0 (Takara Biotechnology (Dalian) Co.LTD, Dalian, China). Three SNPs (MAF≥0.05) located in the 5' and 3' UTRs of the PTEN/PI3K/AKT pathway genes was selected and genotyped using predesigned TaqMan SNP Genotyping Assays on the ABI 7500 Fast Real-Time PCR platform (Applied Biosystems, Life Technologies Corporation, Foster City, CA, USA). The detailed information of the selected 3 SNPs in PTEN/PI3K/AKT pathway were outlined in Supplementary Table 1. The information about assay conditions, primers, and probes is available upon request. The reaction mixture of 10 mL contained 25 ng genomic DNA, 3.5 mL of TaqMan Genotyping Master Mix, 0.25 mL of the primers and probes mix and 6.25 mL of double distilled water. The amplification was performed under the following conditions: 50°C for 2 min, 95°C for 10 min followed by 45 cycles of 95°C for 15 sec, 60°C for 60 sec. The genotyping rates of these SNPs were all above 95%. For quality control, 5 negative controls were included in each plate and 10% of the samples were randomly selected for repeated genotyping for confirmation; and the results were 100% concordant. All samples were run in duplicates with call rates of >95%, and all output spectra were visually inspected.
Promoter-reporter plasmids construction and cell lines
To construct the AKT1 promoter-reporter plasmids, we synthesized the DNA fragment containing either the rs2494752G allele or A allele by the primers of previous publication described by Wang et al [4]. Then, the PCR products were digested with KpnI and XhoI and subsequently cloned into the pGL3-basic vector (Promega, Madison, WI, USA) containing the firefly luciferase gene as a reporter. The constructs were all confirmed by DNA sequencing.
The breast cancer cell line (MCF7), Human 293 cell line (293T) were selected to use for the luciferase reporter assay. All these four cell lines were obtained from Chinese academy of sciences (Beijing, China). Cell lines were grown in RPMI-1640 medium supplemented with 10% Fetal Bovine Serum (FBS).
Luciferase assays
293T and MCF7 cells were cultured in a 24-well culture plates. After 24 h, each well was transfected with 0.8 μg of each AKT1-reporter plasmid with the allele A or G using Lipofectamine 2000 (Invitrogen, CA, USA). The pGL3-Basic vector without an insert was used as a negative control. As an internal standard, all plasmids were transfected with 8 ng pRL-SV40 plasmids per well. It contained the Renilla luciferase gene as an internal control for correcting transfection efficiency. After transfections 48 h, cells were lysed with the passive lysis buffer (Promega) and assayed for luciferase expression activity by using the Dual-Luciferase Reporter Assay System (Promega). Three independent transfection experiments were carried out, and each was performed in triplicate.
Statistical analysis
Data analysis was performed with SPSS software package (Statistical Package for the Social Sciences, version 16.0, SPSS Inc. Chicago, Illinois, USA). All tests were two-sided and statistical significance was set at P<0.05. Associations between genetic polymorphisms and breast cancer susceptibility, and clinical variables were analyzed by odds rations (OR) and 95% confidence intervals (CI) using unconditional logistic regression models. The OR and 95%CI were assessed for per-allele, dominant and recessive models. Discrepancies between the expected and observed genotype and allele frequencies were detected by the Hardy-Weinberg equilibrium test (HWE) using a goodness-of-fit chi-square test (p2+2pq+q2=1). The Kaplan–Meier method and Log-rank test were used to estimate the associations of the DFS and OS with demographic characteristics, and SNPs. Multivariate Cox proportional hazards regression models were applied to obtain the adjusted hazard ratio (HR) and 95% CI for evaluating the effects of genotypes, clinical variables on DFS and OS in breast cancer patients.
Abbreviations
PTEN=phosphatase and tensin homologue deleted on chromosome 10, PI3K=the phosphatidylinositol 3-kinase, AKT=Serine/threonine Kinase, SNPs=single-nucleotide polymorphisms, BC=breast cancer, IDC=invasive Ductal carcinoma, ILC=invasive Lobular carcinoma, HWE=Hardy–Weinberg equilibrium, CEF=Cyclophosphamide, Epirubicin and 5-Fluorouracil, CAF=Cyclophosphamide, Adriamycin and 5-Fluorouracil, NCT=neoadjuvant chemotherapy, RECIST=Response Evaluation Criteria in Solid Tumors criteria, CR=complete responses, PR=partial response, SD=stable disease, PD=progressive disease, MST=median survival time, DFS=Disease-free survival, OS=Overall survival, OR=odds ratio, CI=confidence interval, HR=Hazard Ratio.
ACKNOWLEDGMENTS
The authors gratefully acknowledge the efforts and contributions of doctors, nurses and technical staff at the Cancer Hospital of China Medical University, Liaoning Cancer Hospital & Insititute.
CONFLICTS OF INTEREST
None of the authors have any financial or other interests that could be construed as a conflicts of interest with regard to the submitted manuscript.
REFERENCES
1. Siegel RL, Miller KD, Jemal A. Cancer Statistics, 2017. CA Cancer J Clin. 2017; 67:7-30. doi:10.3322/caac.21387.
2. DeSantis C, Siegel R, Bandi P, Jemal A. Breast cancer statistics, 2011. CA Cancer J Clin. 2011; 61:409-18. doi:10.3322/caac.20134.
3. American Cancer Society. Cancer Facts & Figures 2015. Atlanta: American Cancer Society; 2015.
4. Wang MY, He J, Zhu ML, Teng XY, Li QX, Sun MH, Wang XF, Yang YJ, Wang JC, Jin L, Wang YN, Wei QY. A Functional Polymorphism (rs2494752) in the AKT1 Promoter Region and Gastric Adenocarcinoma Risk in an Eastern Chinese Population. Sci Rep. 2016; 28: 6:20008. doi:10.1038/srep20008
5. Xu JL, Wang ZW, Hu LM, Yin ZQ, Huang MD, Hu ZB, Shen HB, Shu YQ. Genetic variants in the PI3K/PTEN/AKT/mTOR pathway predict platinum-based chemotherapy response of advanced non-small cell lung cancers in a Chinese population. Asian Pac J Cancer Prev. 2012; 13:2157-62.
6. Jang Y, Lu SA, Chen ZP, Ma J, Xu CQ, Zhang CZ, Wang JJ. Genetic polymorphisms of CCND1 and PTEN in progression of esophageal squamous carcinoma. Genet Mol Res. 2013; 12: 6685-91. doi:10.4238/2013.December.13.2.
7. Pu X, Hildebrandt MA, Lu C, Lin J, Stewart DJ, Ye Y, Gu J, Spitz MR, Wu X. PI3K/PTEN/AKT/mTOR pathway genetic variation predicts toxicity and distant progression in lung cancer patients receiving platinum-based chemotherapy. Lung Cancer. 2011; 71:82-8. doi:10.1016/j.lungcan.2010.04.008.
8. Xu X, Chen G, Wu L, Liu L. Association of genetic polymorphisms in PTEN and additional gene-gene interaction with risk of esophageal squamous cell carcinoma in Chinese Han population. Dis Esophagus. 2016; 29:944-9. doi: 10.1111/dote.12428.
9. Stemke-Hale K, Gonzalez-Angulo AM, Lluch A, Neve RM, Kuo WL, Davies M, Carey M, Hu Z, Guan Y, Sahin A, Symmans WF, Pusztai L, Nolden LK, et al. An integrative genomic and proteomic analysis of PIK3CA, PTEN, and AKT mutations in breast cancer. Cancer Res. 2008; 68: 6084-91. doi:10.1158/0008-5472.CAN-07-6854.
10. Nagata Y, Lan KH, Zhou X, Tan M, Esteva FJ, Sahin AA, Klos KS, Li P, Monia BP, Nguyen NT, Hortobagyi GN, Hung MC, Yu D. PTEN activation contributes to tumor inhibition by trastuzumab, and loss of PTEN predicts trastuzumab resistance in patients. Cancer Cell. 2004; 6:117-27. doi:10.1016/j.ccr.2004.06.022.
11. Li Q, Yang J, Yu Q, Wu H, Liu B, Xiong H, Hu G, Zhao J, Yuan X, Liao Z. Associations between single-nucleotide polymorphisms in the PI3K-PTEN-AKT-mTOR pathway and increased risk of brain metastasis in patients with non-small cell lung cancer. Clin Cancer Res. 2013; 19:6252-60.doi:10.1158/1078-0432.CCR-13-1093.
12. Lin L, Zhang Z, Zhang W, Wang L, Wang J. Roles of genetic variants in the PI3K/PTEN pathways in susceptibility to colorectal carcinoma and clinical outcomes treated with FOLFOX regimen. Int J Clin Exp Pathol. 2015; 8:13314-22.
13. Wang X, Lin Y, Lan F, Yu Y, Ouyang X, Wang X, Huang Q, Wang L, Tan J, Zheng F. A GG allele of 3'-side AKT1 SNP is associated with decreased AKT1 activation and better prognosis of gastric cancer. J Cancer Res Clin Oncol. 2014;140:1399-411. doi:10.1007/s00432-014-1663-x.
14. Zhu J, Wang M, He J, Zhu M, Wang JC, Jin L, Wang XF, Yang YJ, Xiang JQ, Wei Q. Polymorphisms in the AKT1 and AKT2 genes and oesophageal squamous cell carcinoma risk in an Eastern Chinese population. J Cell Mol Med. 2016; 20:666-77. doi:10.1111/jcmm.12750.
15. Ding J, Gao Y, Liu R, Xu F, Liu H. Association of PTEN polymorphisms with susceptibility to hepatocellular carcinoma in a Han Chinese population. DNA Cell Biol. 2011; 30: 229-34. doi:10.1089/dna.2010.1126.
16. Yang Y, Xu W, Liu D, Ding X, Su B, Sun Y, Gao W. PTEN polymorphisms contribute to clinical outcomes of advanced lung adenocarcinoma patients treated with platinum-based chemotherapy. Tumour Biol. 2016; 37:7785-96. doi:10.1007/s13 277-015-4651-0.
17. Cao Q, Ju X, Li P, Meng X, Shao P, Cai H, Wang M, Zhang Z, Qin C, Yin C. A functional variant in the mTOR promoter modulates its expression and is associated with renal cell cancer risk. PLoS One. 2012; 7:e50302.doi:10.1371/journal.pone. 0050302.
18. Ma J, Zhang J, Ning T, Chen Z, Xu C. Association of genetic polymorphisms in MDM2, PTEN and P53 with risk of esophageal squamous cell carcinoma. J Hum Genet. 2012; 57:261-4. doi: 10.1038/jhg.2012.15.
19. Burris HA 3rd. Overcoming acquired resistance to anticancer therapy: focus on the PI3K/AKT/mTOR pathway. Cancer Chemother Pharmacol. 2013; 71: 829-42. doi: 10.1007/s00280-012-2043-3.
20. Board RE, Thelwell NJ, Ravetto PF, Little S, Ranson M, Dive C, Hughes A, Whitcombe D. Multiplexed assays for detection of mutations in PIK3CA. Clin Chem. 2008; 54:757-60. doi: 10.1373/clinchem.2007.098376.
21. Chalhoub N, Baker SJ. PTEN and the PI3-kinase pathway in cancer. Annu Rev Pathol. 2009; 4: 127-50. doi: 10.1146/annurev.pathol.4.110807.092311.
22. Wan X, Li X, Yang J, Lv W, Wang Q, Chen Y, Li Y. Genetic association between PIK3CA gene and oral squamous cell carcinoma: a case control study conducted in Chongqing, China. Int J Clin Exp Pathol. 2015; 8:13360-6.
23. Petrelli F, Coinu A, Lonati V, Cabiddu M, Ghilardi M, Borgonovo K, Barni S. Neoadjuvant dose-dense chemotherapy for locally advanced breast cancer: a meta-analysis of published studies. Anticancer Drugs. 2016; 27: 702-8. doi: 10.1097/CAD. 0000000000000369.
24. Kim SH, Jung KH, Kim TY, Im SA, Choi IS, Chae YS, Baek SK, Kang SY, Park S, Park IH, Lee KS, Choi YJ, Lee S, et al. Prognostic Value of Axillary Nodal Ratio After Neoadjuvant Chemotherapy of Doxorubicin/Cyclophosphamide(AC) Followed by Docetaxel (DOC): A Multicenter Retrospective Cohort Study. Cancer Res Treat. 2016; 48:1373-81. doi:10.4143/crt.2015.475.