
INTRODUCTION
Breast cancer is one of the most common malignancies that threatens women’s health and is now the number one malignant tumor among women. Studies have shown that [1] malignant tumors are caused by a variety of genes that are involved in multistage synergistic results. Over the past two decades, several studies have been conducted on the early diagnosis of breast cancer. Our study was focused on the tertiary prevention of cancer to determine the best adjuvant therapy to prevent post-surgery recurrence and metastasis [2–3]. Multidisciplinary scientists have collaborated to promote breast cancer treatment and have made great progress in mortality reduction with the use of endocrine therapy. However, further studies are needed to identify effective biomarkers, particularly among patients (estimated to account for 30-40% of general breast cancer population) who are insensitive to endocrine therapy [3–5]. Therefore, identifying useful biomarkers is essential for precision treatment of breast cancer.
The serine protease super family of chymotrypsin is expressed in intestinal digestion of food proteins in mammals [6]. These key enzymes are involved in digestion, fibrinolysis, reproduction, blood clotting, immune response, and signal transduction from the extracellular environment to the cell; however, there are many characteristics and functions that are not yet clear.
Serine proteases share a common chemical mechanism of having the same reactive serine residue catalytic site, but they differ greatly in degrees of native properties and substrate selectivity [7]. Chemokines, growth factors, growth factor receptors, and other signaling receptors are activated and transmitted through an extensive array of membranes and secreted serine proteases, and then enhance the transduction of signals for tumorigenesis, tumor proliferation, and metastasis [8–10].
Serine protease 3 (PRSS3) is one of the isoforms of trypsinogen, which plays an important role in the development and progression of many types of malignant tumors [17]. In 2010, Hockla et al. [7]. created an HMT-3522 breast cancer–growth model under 3-dimentional organ culture conditions and found that the expression of PRSS3 in breast cancer cell line T4-2 was enhanced. In our study, real-time quantitative polymerase chain reaction (qPCR) and tissue microarray immunohistochemistry analysis (TMA-IHC) were used to determine the mRNA and PRSS3 expression, respectively, in invasive ductal carcinoma of the breast from tissue samples. We sought to determine both the mRNA and protein expression of PRSS3 in invasive ductal carcinoma of the breast (IDC) tissue samples and correlate this with the patient’s clinical characteristics and 5.0-year survival rate.
RESULTS
PRSS3 mRNA level was significantly higher in IDC tissues than in adjacent normal tissues
To determine the PRSS3 mRNA level in IDC patients, total RNA was isolated from the cancerous tissue of 40 IDC patients. Concurrently, 40 tissue samples of matched adjacent normal breast were collected to determine mRNA levels in noncancerous tissues. Real-time qPCR revealed that PRSS3 mRNA expression was upregulated in IDC samples compared with that in corresponding adjacent normal breast tissue samples. The expression of PRSS3 mRNA in IDC tissue samples (7.04 ± 2.04) was significantly higher than that in noncancerous tissues (2.39 ± 0.50) (P < 0.001) (Figure 1).
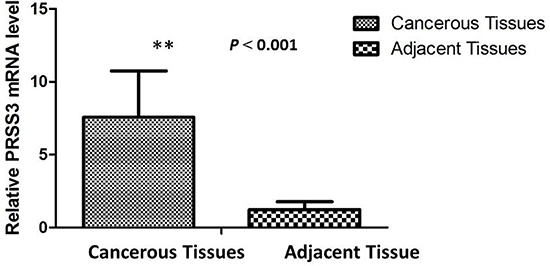
Figure 1: The relative mRNA expression of PRSS3 was significantly up-regulated in IDC tissues (n = 40) compared to matched adjacent non-cancerous tissues (n = 40) assessed by qPCR (P < 0.001).
PRSS3 expression was significantly higher in IDC than surrounding normal and benign tissues
The overexpression of PRSS3 and its cellular distribution in IDC or surrounding tissues were analyzed by TMA-IHC using rabbit polyclonal antihuman PRSS3 antibodies (Figure 2). We determined PRSS3 protein expression in 386 archived breast tissue blocks comprising 286 IDC tissues and 100 normal breast tissues. Positive PRSS3 staining, identified as brown particles, was distributed in the cytosol and cell nuclei of the tissue samples. The incidence of PRSS3 expression in IDC tissue (66.43%, 190 of 286) was significantly higher than that in normal breast tissue (22%, 22 of 100) (χ2 = 14.773, P < 0.001). The frequency of positive PRSS3 expression in IDC tissue and in normal tissue is shown in Table 1.
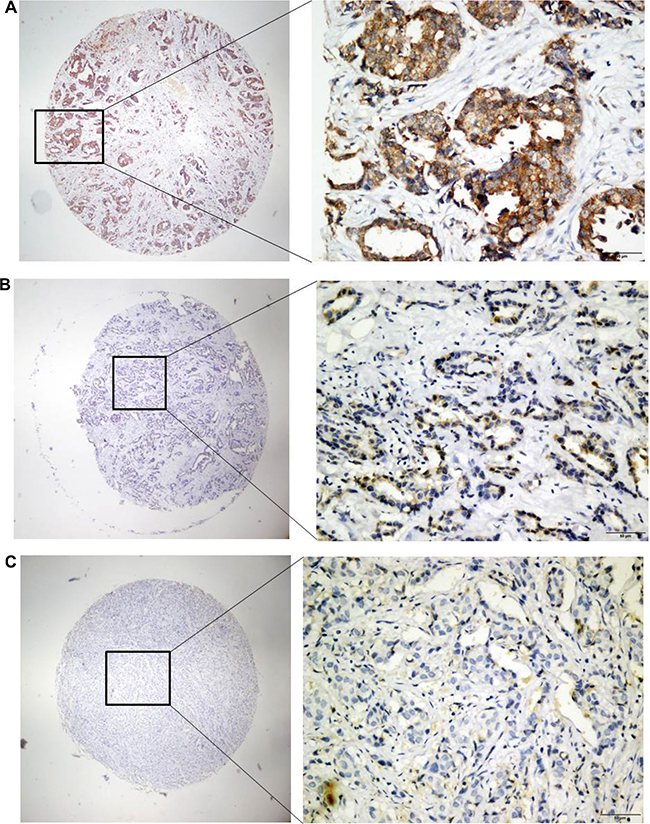
Figure 2: Analysis of PRSS3 expression and its cellular distribution by immunohistochemistry. The expression of PRSS3 was analyzed on tissue microarrays by immunohistochemistry with the primary rabbit anti-human PRSS3 antibody. The positive PRSS3 expression with brown staining particles was distributed in the cytosol and cell nuclei, a1-a2) Strong straining of PRSS3 in IDC tissues; b1-b2) Mild straining of PRSS3 in IDC tissues; c1-c2) Light and Negative straining of PRSS3 in IDC tissues. a1, b1 and c1 are ×40 magnification (bar = 500 μm), a2, b2 and c2 are ×400 magnification (bar = 500 μm).
Table 1: Incidence of PRSS3 expression in IDC tissues and normal breast tissues
Tissue sample |
Case No. |
PRSS3 expression level |
P value |
|
|---|---|---|---|---|
Negative (n, %) |
Positive (n, %) |
|||
Normal breast tissue |
100 |
78 (78.00) |
22 (22.00) |
< 0.001* |
IDC |
286 |
96 (33.57) |
190 (66.43) |
|
Association of PRSS3 expression with IDC clinical characteristics
We next investigated the relationship between PRSS3 protein levels and the clinical pathologic parameters of the patient (Table 2).
Table 2: Clinicopathological characteristics of high PRSS3 expression in 286 IDC patients
Groups |
Patients, n |
% of total |
PRSS3 high expression, n |
% of total |
χ2 |
P value |
|---|---|---|---|---|---|---|
Age (yr) |
8.407 |
0.015 |
||||
< 55 |
154 |
53.85 |
62 |
40.26 |
||
≥ 55 |
132 |
46.15 |
34 |
25.76 |
||
Pathology typing |
15.718 |
0.003 |
||||
I |
36 |
12.59 |
12 |
33.33 |
||
II |
150 |
52.45 |
44 |
29.33 |
||
III |
100 |
34.97 |
40 |
40.00 |
||
Tumor size (cm) |
4.608 |
0.100 |
||||
< 2 |
66 |
23.08 |
16 |
24.24 |
||
≥ 2 |
220 |
76.92 |
80 |
36.36 |
||
Axillary lymph node |
0.637 |
0.727 |
||||
N0 |
180 |
62.94 |
60 |
33.33 |
||
NX |
106 |
37.06 |
36 |
33.96 |
||
ER expression |
1.496 |
0.473 |
||||
Negative |
118 |
41.26 |
42 |
35.59 |
||
Positive |
168 |
58.74 |
54 |
32.14 |
||
PR expression |
3.708 |
0.157 |
||||
Negative |
124 |
43.36 |
42 |
33.87 |
||
Positive |
162 |
56.64 |
54 |
33.33 |
||
Her-2 expression |
7.899 |
0.019 |
||||
Negative |
110 |
38.46 |
36 |
32.73 |
||
Positive |
176 |
61.54 |
60 |
34.09 |
||
Ki-67 expression |
6.122 |
0.047 |
||||
Low |
112 |
39.16 |
47 |
41.96 |
||
High |
174 |
60.84 |
49 |
28.16 |
||
Molecular typing |
9.679 |
0.139 |
||||
Luminal A |
95 |
33.22 |
38 |
40.00 |
||
Luminal B |
105 |
36.71 |
32 |
30.48 |
||
Her-2 positive |
46 |
16.08 |
10 |
21.74 |
||
Basal-like |
40 |
13.99 |
16 |
40.00 |
||
Five-year survival |
11.165 |
0.004 |
||||
Yes |
238 |
83.22 |
70 |
29.41 |
||
No |
48 |
16.78 |
26 |
54.17 |
High PRSS3 protein expression was significantly associated with patients’ age (P = 0.015), pathology typing (P = 0.003), Her-2 expression (P = 0.019), Ki-67 expression (P = 0.047), and the 5.0-year survival rate (P = 0.004).
Among the 286 IDC patients, we got 26 cases of triple-negative breast cancer (TNBC) patients; we correlated PRSS3 protein expression with TNBC patents’ clinical characteristics (Table 3). There were no significant associations between high PRSS3 protein expression and the clinicopathological features.
Table 3: Clinicopathological characteristics of high PRSS3 expression in 26 triple-negative breast cancer (TNBC) patients
Groups |
Patients, n |
% of total |
PRSS3 high expression, n |
% of total |
χ2 |
P value |
|---|---|---|---|---|---|---|
Age (yr) |
0.650 |
0.723 |
||||
< 55 |
18 |
69.23 |
6 |
33.33 |
||
≥ 55 |
8 |
30.77 |
4 |
50.00 |
||
Pathology typing |
7.800 |
0.099 |
||||
I |
2 |
7.69 |
0 |
0.00 |
||
II |
6 |
23.08 |
4 |
66.67 |
||
III |
18 |
69.23 |
6 |
33.33 |
||
Axillary lymph node |
5.720 |
0.057 |
||||
N0 |
20 |
76.92 |
8 |
40.00 |
||
NX |
6 |
23.08 |
2 |
33.33 |
||
Ki-67 expression |
4.030 |
0.133 |
||||
Low |
6 |
23.08 |
4 |
66.67 |
||
High |
20 |
76.92 |
6 |
30.00 |
||
Five-year survival |
0.087 |
0.958 |
||||
Yes |
20 |
76.92 |
8 |
40.00 |
||
No |
6 |
23.08 |
2 |
33.33 |
High PRSS3 protein expression predicts poor 5-year survival in IDC patients
We analyzed the association between PRSS3 expression and the survival status of 286 patients using both univariate and multivariate analysis (Table 4). In univariate analysis, the overexpression of PRSS3 showed a significant relationship with a poor 5.0-year survival rate of 286 IDC patients (P = 0.007). Meanwhile, specific IDC clinical prognostic factors, such as Her-2 expression level (HR, 2.805, 95% confidence interval [CI]: 1.337–5.885; P = 0.006), ki-67 expression level (HR, 0.455, 95% CI: 0.240-0.859; P = 0.015), and molecular typing (HR, 1.725, 95% CI: 1.096–2.714; P = 0.019), also showed a statistically significant correlation with the 5.0-year survival rate based on the univariate Cox regression univariate analysis. All of these factors were enrolled in a multivariable analysis. Higher PRSS3 expression (HR, 0.372, 95% CI: 0.178–0.781; P = 0.009), Her-2 expression level (HR, 2.588, 95% CI: 1.277–5.246; P = 0.008), and ki-67 expression level (HR, 0.492, 95% CI: 0.269–0.901; P = 0.022) remained significantly associated with a poor 5.0-year survival rate, so they were classified as independent predictive factors for poor IDC outcome. The Kaplan-Meier Survival Curves demonstrated that IDC patients with high PRSS3 expression had a significantly poorer 5.0-year survival rate compared to those with low or no PRSS3 expression (Figure 3).
Table 4: Univariate and multivariable analysis of prognostic factors in IDC patients for 5-year survival
Variable |
Univariate analysis |
Multivariable analysis |
||||
|---|---|---|---|---|---|---|
HR |
P > |z| |
95% CI |
HR |
P > |z| |
95% CI |
|
Age (yr) |
||||||
< 55 vs. ≥ 55 |
1.371 |
0.320 |
0.736–2.553 |
|||
Pathology typing |
||||||
I vs. II –III |
0.829 |
0.692 |
0.327–2.102 |
|||
Tumor size (cm) |
||||||
< 2 vs. ≥ 2 |
1.224 |
0.614 |
0.559–2.678 |
|||
Axillary lymph node |
||||||
N0 vs. NX |
1.060 |
0.858 |
0.561–2.001 |
|||
ER expression |
||||||
Positive vs. Negative |
1.480 |
0.448 |
0.538–4.069 |
|||
PR expression |
||||||
Positive vs. Negative |
1.571 |
0.361 |
0.596–4.142 |
|||
Her-2 expression |
||||||
Positive vs. Negative |
2.805 |
0.006 |
1.337–5.885 |
2.588 |
0.008 |
1.277–5.246 |
Ki-67 expression |
||||||
High vs. Low |
0.455 |
0.015 |
0.240–0.859 |
0.492 |
0.022 |
0.269–0.901 |
Molecular typing |
||||||
Luminal A vs. Luminal B vs. Her-2 positive vs. Basal-like |
1.725 |
0.019 |
1.096–2.714 |
1.314 |
0.052 |
0.998–1.730 |
PRSS3 expression |
||||||
High vs. Low |
0.346 |
0.007 |
0.159–0.752 |
0.372 |
0.009 |
0.178–0.781 |
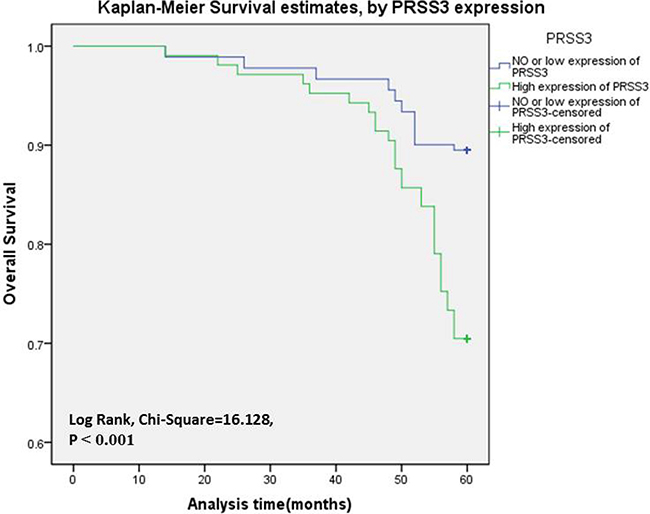
Figure 3: The PRSS3 expression curves were calculated by Kaplan-Meier method. Survival curves of 286 IDC patients were made according to cancerous tissues expressing a low or high level of PRSS3 (log-rank test, P < 0.001). The green line is the high PRSS3 group; the blue line is the low and without PRSS3 group.
Besides, in univariate analysis, there were no significant correlations between the overexpression of PRSS3 and the 5-year survival of the 26 triple-negative breast cancer patients (P = 0.390).
DISCUSSION
In the current study, we determined the levels of both PRSS3 mRNA and PRSS3 protein expression in both IDC tissues and adjacent normal tissues. The PRSS3 mRNA levels were significantly higher in IDC tissues than in adjacent tissues. Similarly, the PRSS3 protein levels were significantly higher in IDC tissues than in adjacent normal tissues. High PRSS3 protein levels were associated with patients’ age, Her-2 expression levels, ki-67 expression levels, and pathology typing. Finally, high PRSS3 protein expression is an independent prognostic marker for a poor 5.0-year survival rate in IDC patients.
PRSS3, one of the three major isoforms of trypsinogen, is a serine protease that is synthesized mainly in pancreatic acinar cells. It can be secreted into the small intestine to promote digestion [15–16, 47]. As a member of the serine protease family, PRSS3 is highly homologous to trypsinogen I and II (PRSS1 and PRSS2) at both the gene and protein levels [17]; however, unlike PRSS1 and PRSS2, a small portion of pancreatic exocrine secretions is composed of PRSS3, which accounts for 3.0–10% of the trypsinogen content in normal pancreatic juice [18]. The tumor specificity of trypsinogen has been elucidated in many types of tumors and it is thought to be involved in the development and progression of malignancies [9, 11, 19–26]. PRSS3 is expressed in the airway epithelium and its active trypsin is detected in the lung bronchial epithelium, which might be related to its ability to activate various proteases in relation to coagulation, fibrinolysis, and/or inflammation [27]. In non-small–cell lung cancer (NSCLC), the expression of PRSS3 is closely associated with metastasis and with a low prognosis for NSCLC patients. In addition, overexpression of PRSS3 in lung-cancer tissue results in increased migration across endothelial cells, thereby highlighting the potential role of trypsin in tumor metastasis [28].
Promoter methylation of the PRSS3 gene suggests silencing of its expression, which is at ~53% in NSCLC; however, some researchers believe that methylation in NSCLC is a random event [17]. While a study of esophageal squamous cell carcinoma found that promoter methylation can silence the expression of PRSS3, [29] some other studies reported that methylation of the PRSS3 promoter in bladder cancer, lung cancer, esophageal cancer, and gastric cancer also silence its expression [17, 29–30]. Some tissue microarray analyses have been conducted to confirm that PRSS3 is overexpressed in metastatic lung cancer [28]. Methylated PRSS3 might be a suitable gene for the detection of malignancies, although more studies are needed to elucidate the specificity of this gene for the detection of serum PRSS3 in cancer patients [17].
PRSS3 was expressed in both ovarian epithelial cancer and benign ovarian tumors, but its expression was significantly higher in ovarian epithelial cancer [31–32]. Hockla et al. [33–36]. demonstrated using nude mouse models that PRSS3 is highly expressed in prostate cancer and is a key factor in lung metastasis of prostate cancer. By reducing the expression of PRSS3, lung metastasis of prostate cancer would be significantly inhibited [35]. In addition, the researchers also found that PRSS3 is also expressed in the ovarian stroma, suggesting that the expression of PRSS3 might also be associated with the tumor’s microenvironment [37–38]. In in vitro experiments using a cell model, Jiang et al. [36]. found that overexpression of PRSS3 increased the invasive ability of pancreatic cancer cells, but that when PRSS3 expression was knocked down, the invasion of pancreatic cancer cells significantly decreased; however, the expression of PRSS3 had no significant effect on the ability of cells to migrate. PRSS3 is expressed in the acinar cells of the pancreas but not in the normal ductal epithelium, and PRSS3 expression was significantly enhanced in cancer tissues with vascular and lymphatic metastasis. In pancreatic cancer, the research data showed that the expression of PRSS3 and lymph node metastasis, as well as distant metastasis, were closely related [36]. Our data suggest that PRSS3 acts as oncogenes in IDC.
Studies have shown that trypsin can activate protease-activated receptors in epithelial cells [39], thereby triggering the development of breast cancer through the signaling pathway [40–43] ; however, another study questioned this claim [44]. In colorectal cancer, trypsin suppresses the proliferation of cancer cells by blocking downstream gene proliferation-1 (BOP-1) [45]. Hockla et al. [7] found a series of trypsin-regulated genes using microarray analysis and real time q-PCR. Among them, EGFR, ITHAV, and CD109 were upregulated by trypsin expression, whereas BOP-1 and CD74 were downregulated. EGFR and its EGF-responsive family members were found to play a central role in the progression of breast and other tumors [46].
Our current study indicated that PRSS3 is an independent prognostic factor in the development and progression of IDC. In subsequent work, in vivo and vitro mechanisms will be necessary to further confirm and expand these conclusions. We look forward to a more comprehensive understanding of the development process of IDC so as to provide new findings that will help prevent and treat the disease.
Study limitations
Our study had several limitations. First, our research samples were limited to the female Chinese population. We have not collected tissues from male patients, which might result in sample bias; therefore, our results cannot be extended to other countries or to males, and we do not have international research collaborations with larger and more diverse populations. Secondly, our study examined only IDC in breast cancer. As we know, a tumor is a heterogeneous disease and different types of tumors will have different prognoses; therefore, we do not know whether our findings can be generalized to all types of invasive breast cancer. Finally, we have not provided the mechanism by which PRSS3 occurs in IDC. In the next phase of the study, we intend to further validate the expression of PRSS3 using a cell model and a nude mouse model, which can aid in exploring its molecular mechanism of action in regulating the growth of IDC tumor cells.
MATERIALS AND METHODS
Human tissue specimens and patient clinical information
Human breast cancer and surrounding tissues in the study were obtained from 286 IDC patients, who underwent operations between January 2010 and August 2011 at the Affiliated Hospital of Nantong University, Jiangsu Province, China. The patient cohort inclusion and exclusion criteria included: (1) accurate pathologic diagnosis of primary IDC; (2) complete clinic pathologic and follow-up date; and (3) previously untreated, with surgery as the first treatment (Table 5). Thus, analysis of the data would reflect the actual impact of tumor biology on the clinical outcome. This study was approved by the Ethics Committee permission of the Affiliated Hospital of Nantong University, and all patients signed informed consent. The related important clinical information of each patient was collected from their medical records.
Table 5: Clinical characteristics of IDC patients
Parameter |
n |
|---|---|
Age (yr) |
|
Media (range) |
55 (20–83) |
Pathology typing |
|
I |
36 |
II |
150 |
III |
100 |
Tumor size (cm) |
|
< 2 |
66 |
≥ 2 |
220 |
Axillary lymph node |
|
N0 |
180 |
NX |
106 |
ER expression |
|
Negative |
118 |
Positive |
168 |
PR expression |
|
Negative |
124 |
Positive |
162 |
Her-2 expression |
|
Negative |
110 |
Positive |
176 |
Ki-67 expression |
|
Low |
112 |
High |
174 |
Molecular typing |
|
Luminal A |
95 |
Luminal B |
105 |
Her-2 positive |
46 |
Basal-like |
40 |
Five-year survival |
|
Yes |
238 |
No |
48 |
PRSS3 expression and statistical analysis
PRSS3 mRNA level was determined by real-time quantitative PCR (qPCR). The primers sequences are as follows: PRSS3 forward primer (5'- TGCGCCATTGGTTTTCCATC-3') and PRSS3 reverse primer (5'- ATACCACCCACTGTTCGCTG-3'), PRSS3 protein expression in tissue blocks was determined using tissue microarray immunohistochemistry (TMA IHC). Rabbit polyclonal anti-human PRSS3 antibody was used (dilution 1:50, ab170361, Abcam, USA). The PRSS3 protein level was quantified using a two-level grading system: the percentages for PRSS3 -positive cells were scored as follows: 0 (< 10%), 1 (10%–25%), 2 (26%–50%), and 3 (≥ 50%). Staining intensity was stratified into four categories: 0 (negative), 1 (weakly), 2 (moderate), and 3 (strongly). The sum of the percentage and intensity score was defined as the IHC staining score. According to above criterion, IDC tissues with PRSS3 expression were divided into two groups: 0–3 scores (low expression) and 4–9 scores (high expression). χ2 tests were performed to determine the correlation between PRSS3 expression and clinicopathologic parameters. Univariate and multivariate Cox regression models were used to identify prognostic factors. Kaplan-Meier method was used to calculate survival curves. For all analyses, a P-value < 0.05 was regarded as statistically significant. Data were analyzed using SPSS 19 statistics software (SPSS Inc., Chicago, IL, USA).
CONFLICTS OF INTEREST
The authors declare no competing financial interests.
REFERENCES
1. International Agency for Research on C. Breast Cancer. Estimated incidence, mortality and prevalence worldwide in 2012. World Health Organization [updated 2012]. Available from: http://www.globocan.iarc.fr/Pages/fact_sheets_cancer.aspx (accessed 8 January 2015).
2. Cuzick J. Treatment of DCIS—results from clinical trials. Surg Oncol. 2003; 12:213–219.
3. Senn HJ, Morant R. Chemoprevention of breast and prostate cancers: where do we stand? Ann Oncol. 2008; 19:vii234–vii237.
4. Jatoi I, Chen BE, Anderson WF, Rosenberg PS. Breast cancer mortality trends in the United States according to estrogen receptor status and age at diagnosis. J Clin Oncol. 2007; 25:1683–1690.
5. Li Y, Meeran SM, Patel SN, Chen H, Hardy TM, Tollefsbol TO. Epigenetic reactivation of estrogen receptor-alpha (ERalpha) by genistein enhances hormonal therapy sensitivity in ERalpha-negative breast cancer. Mol Cancer. 2013; 12:9.
6. (MEROPS data base; http://merops.sanger.ac.uk/) Rawlings ND, Barrett AJ, Finn R. Twenty years of the MEROPS database of proteolytic enzymes, their substrates and inhibitors. Nucleic Acids Res. 2016; 44:D343–D350.
7. Hockla A, Radisky DC, Radisky ES. Mesotrypsin promotes malignant growth of breast cancer cells through shedding of CD109. Breast cancer research and treatment. 2010; 124:27–38.
8. Borgono CA, Diamandis EP. The emerging roles of human tissue kallikreins in cancer. Nat Rev Cancer. 2004; 4:876–890.
9. Duffy MJ. The urokinase plasminogen activator system:role in malignancy. Curr Pharm Des. 2004; 10:39–49.
10. Nyberg P, Ylipalosaari M, Sorsa T, Salo T. Trypsins and their role in carcinoma growth. Exp Cell Res. 2006; 312:1219–1228.
11. Sun Z, Yang P. Role of imbalance between neutrophil elastase and alpha 1-antitrypsin in cancer development and pro-gression. Lancet Oncol. 2004; 5:182–190.
12. Bhatt AS, Welm A, Farady CJ, Vasquez M, Wilson K, Craik CS. Coordinate expression and functional profiling identify an extracellular proteolytic signaling pathway. Proc Natl Acad Sci USA. 2007; 104:5771–5776.
13. Hansen KK, Oikonomopoulou K, Baruch A, Ramachandran R, Beck P, Diamandis EP, Hollenberg MD. Proteinases as hormones: targets and mechanisms for proteolytic signaling. Biol Chem. 2008; 389:971–982.
14. Wilson TJ, Nannuru KC, Futakuchi M, Sadanandam A, Singh RK. Cathepsin G enhances mammary tumor-induced osteoly-sis by generating soluble receptor activator of nuclear factor-kappaB ligand. Cancer Res. 2008; 68:5803–5811.
15. Tani T, Kawashima I, Mita K, Takiguchi Y. Nucleotide sequence of the human pancreatic trypsinogen III cDNA. Nucleic Acids Res. 1990; 18:1631.
16. Radisky ES, Radisky DC. Matrix metalloproteinase-induced epithelial–mesenchymal transition in breast cancer. J Mammary Gland Biol Neoplasia. 2010; 15:201–12.
17. Marsit CJ, Okpukpara C, Danaee H, Kelsey KT. Epigenetic silencing of the PRSS3 putative tumor suppressor gene in non-small cell lung cancer. Molecular carcinogenesis. 2005; 44:146–50.
18. Rinderknecht H, Renner IG, Abramson SB, Carmack C. Mesotrypsin: a new inhibitor-resistant protease from a zymogen in human pancreatic tissue and fluid. Gastroenterology. 1984; 86:681e92.
19. Williams SJ, Gotley DC, Antalis TM. Human trypsinogen in colorectal cancer. Int J Cancer. 2001; 93:67–73.
20. Oyama K, Ohta T, Nishimura GI, Elnemr A, Yasui T, Fujimura T, Fushida S, Kitagawa H, Kayahara M, Terada T. Trypsinogen expression in colorectal cancers. Int J Mol Med. 2000; 6:543–548.
21. Ohta T, Terada T, Nagakawa T, Tajima H, Itoh H, Fonseca L, Miyazaki I. Pancreatic trypsinogen and cathepsin B in human pancreatic carcinomas and asso-ciated metastatic lesions. Br J Cancer. 1994; 69:152–156.
22. Miyata S, Koshikawa N, Higashi S, Miyagi Y, Nagashima Y, Yanoma S, Kato Y, Yasumitsu H, Miyazaki K. Expression of trypsin in human cancer cell lines and cancer tissues and its tight binding to soluble form of Alzheimer amyloid precursor protein in culture. J Biochem (Tokyo). 1999; 125:1067–1076.
23. Hirahara F, Miyagi Y, Miyagi E, Miyagi Y, Yasumitsu H, Koshikawa N, Nagashima Y, Kitamura H, Minaguchi H, Umeda M. Trypsinogen expression in human ovarian carcinomas. Int J Cancer. 1995; 63:176–181.
24. Borgono CA, Diamandis EP. The emerging roles of human tissue kallikreins in cancer. Nat Rev Cancer. 2004; 4:876–890.
25. Netzel-Arnett S, Hooper JD, Szabo R, Madison EL, Quigley JP, Bugge TH, Antalis TM. Membrane anchored serine pro-teases: a rapidly expanding group of cell surface proteolytic enzymes with potential roles in cancer. Cancer Metastasis Rev. 2003; 22:237–258.
26. Nyberg P, Ylipalosaari M, Sorsa T, Salo T. Trypsins and their role in carcinoma growth. Exp Cell Res. 2006; 312:1219–1228.
27. Koshikawa N, Hasegawa S, Nagashima Y, Mitsuhashi K, Tsubota Y, Miyata S, Miyagi Y, Yasumitsu H, Miyazaki K. Expression of trypsin by epithelial cells of various tissues, leukocytes, and neurons in human and mouse. Am J Pathol. 1998; 153:937–944.
28. Diederichs S, Bulk E, Steffen B, Ji P, Tickenbrock L, Lang K, Zänker KS, Metzger R, Schneider PM, Gerke V, Thomas M, Berdel WE, Serve H, et al. S100 family members and trypsinogens are predictors of distant metastasis and survival in early-stage non-small cell lung cancer. Cancer Res. 2004; 64:5564–5569.
29. Yamashita K, Mimori K, Inoue H, Mori M, Sidransky D. A tumor-suppressive role for trypsin in human cancer progression. Cancer Res. 2003; 63:6575–6578.
30. Marsit CJ, Karagas MR, Danaee H, Liu M, Andrew A, Schned A, Nelson HH, Kelsey KT. Carcinogen exposure and gene promoter hypermethylation in bladder cancer. Carcinogenesis. 2006; 27:112–6.
31. Azizmohammadi S, Safari A, Seifoleslami M, Rabati RG, Mohammadi M, Yahaghi H, Azizmohammadi S. Clinical significance and expression of the PRSS3 and Wiskott-Aldrich syndrome protein family verprolin-homologous protein 1 for the early detection of epithelial ovarian cancer. Tumour biology. 2016; 37:6769–73.
32. Ma R, Ye X, Cheng H, Ma Y, Cui H, Chang X. PRSS3 expression is associated with tumor progression and poor prognosis in epithelial ovarian cancer. Gynecologic oncology. 2015; 137:546–52.
33. Ghilardi C, Anastasia A, Avigni R, Lupi M, Giavazzi R, Bani MR. PO-44 - Tissue factor pathway inhibitor-2 (TFPI-2) is cleaved by PRSS3: implication for tumor endothelial cells migration. Thrombosis research. 2016; 140:S192–3.
34. Radisky ES. PRSS3/mesotrypsin in prostate cancer progression: implications for translational medicine. Asian journal of andrology. 2013; 15:439–40.
35. Hockla A, Miller E, Salameh MA, Copland JA, Radisky DC, Radisky ES. PRSS3/mesotrypsin is a therapeutic target for metastatic prostate cancer. Molecular Cancer Research. 2012; 10:1555–66.
36. Jiang G, Cao F, Ren G, Gao D, Bhakta V, Zhang Y, Cao H, Dong Z, Zang W, Zhang S, Wong HH, Hiley C, Crnogorac-Jurcevic T. PRSS3 promotes tumour growth and metastasis of human pancreatic cancer. Gut. 2010; 59:1535–44.
37. Nyaruhucha CN, Kito M, Fukuoka SI. Identification and expression of the cDNAencoding human mesotrypsin (ogen), an isoform of trypsin with inhibitor resistance. J Biol Chem. 1997; 272:10573–8.
38. Katona G, Berglund GI, Hajdu J, Gráf L, Szilágyi L. Crystal structure reveals basis for the inhibitor resistance of human brain trypsin. J Mol Biol. 2002; 315:1209–18.
39. Cottrell GS, Amadesi S, Grady EF, Bunnett NW. TrypsinIV, a novel agonist of protease-activated receptors 2 and 4. J Biol Chem. 2004; 279:13532–13539.
40. Jiang X, Guo YL, Bromberg ME. Formation of tissue factor-factor VIIa-factor Xa complex prevents apoptosis in human breast cancer cells. Thromb Haemost. 2006; 96:196–201.
41. Jiang X, Zhu S, Panetti TS, Bromberg ME. Formation of tissue factor-factor VIIa-factor Xa complex induces activation of the mTOR pathway which regulates migration of human breast cancer cells. Thromb Haemost. 2008; 100:127–133.
42. Versteeg HH, Schaffner F, Kerver M, Ellies LG, Andrade-Gor-don P, Mueller BM, Ruf W. Protease-activated receptor(PAR) 2, but not PAR1, signaling promotes the development of mammary adenocarcinoma in polyoma middle T mice. Cancer Res. 2008; 68:7219–7227.
43. Arora P, Cuevas BD, Russo A, Johnson GL, Trejo J. Persistent transactivation of EGFR and ErbB2/HER2 by protease-activated receptor-1 promotes breast carcinoma cell invasion. Oncogene. 2008; 27:4434–4445.
44. Grishina Z, Ostrowska E, Halangk W, Sahin-Toth M, Reiser G. Activity of recombinant trypsin isoforms on human pro-teinase-activated receptors (PAR): mesotrypsin cannot activate epithelial PAR-1, -2, but weakly activates brain PAR-1. Br J Pharmacol. 2005; 146:990–999.
45. Killian A, Sarafan-Vasseur N, Sesboue R, Le Pessot F, Blanchard F, Lamy A, Laurent M, Flaman JM, Frebourg T. Contri-bution of the BOP1 gene, located on 8q24, to colorectal tumor-igenesis. Genes Chromosomes Cancer. 2006; 45:874–881.
46. Normanno N, De Luca A, Bianco C, Strizzi L, Mancino M, Maiello MR, Carotenuto A, De Feo G, Caponigro F, Salomon DS. Epidermal growth factor receptor (EGFR) signaling in cancer. Gene. 2006; 366:2–16.
47. Szabo A, Ludwig M, Hegyi E, Szepeova R, Witt H, Sahin-Toth M. Mesotrypsin Signature Mutation in a Chymotrypsin C (CTRC) Variant Associated with Chronic Pancreatitis. The Journal of biological chemistry. 2015; 290:17282–92.