
INTRODUCTION
Ground-glass opacity (GGO) is defined as an area of hazy increased attenuation that does not obscure underlying bronchial structures or vascular markings on high-resolution computed tomography (HRCT) [1]. Patients with stage IA lung adenocarcinoma (i.e., peripheral lung cancers ≤ 3 cm in diameter without nodal and distant metastasis), usually present as a solitary ground-glass opacity nodule (GGN) on HRCT [2–5], and have a 5-year disease-free survival rate approaching 88% [6]. On the other hand, within the stage IA lung adenocarcinoma patients, those with adenocarcinoma in situ or minimally invasive adenocarcinoma (AIS-MIA) have an excellent 5-year postoperative overall survival rate (100% or nearly 100%) [7, 8].
With recent advancement of technology in multi-detector row CT (MDCT), it is possible to increasingly detect small GGN and to analyze its anatomic, morphologic, and quantitative information [9–17]. Based on the presence or absence of solid components, GGN is classified into mixed GGN and pure GGN on HRCT. Although many studies have compared the morphologic appearances of different types of malignant GGNs [2, 12, 17–20], there is substantial overlap between benign GGNs and malignant GGNs [21]. Quantitative CT thus was established to evaluate GGN [9, 21, 22]. A percentage of 0.5 or less of the solid component of a GGN can identify early lung adenocarcinoma with clinical T1bN0M0 patients [13] and can be a useful independent preoperative prognostic indicator [23]. Among various strategies over morphologic evaluation, contrast-enhanced and dynamic MDCT have been applied to assess malignant GGNs with limited additional information [12]. Although perfusion MDCT shows us promising for lung cancer [24], the increased radiation dose restricts its clinical application.
Fluorin-18 fluorodeoxyglucose Positron Emission Tomography and CT (PET/CT) is increasingly used to diagnose many cancers. Higher 18F-FDG uptake can generally differentiate malignant tumors from benign lesions and normal tissue [25]. CT adds high spatial resolution value to the PET in early lung adenocarcinoma with GGN [14, 26–28]. The maximum standard uptake value (SUVmax) of most pure GGNs and some of mixed GGNs is usually very low [29, 30]. Hence, HRCT was employed to provide additional anatomic information to PET/CT in the diagnosis of GGNs. Recently, Uehara et al. [26] reported that both SUVmax ≤ 2.9 and the percentage of the solid component ≤ 0.25 as well as each alone are good predictors of prognosis in patients with clinical stage IA lung adenocarcinoma. For patients with stage IA lung adenocarcinoma undergoing their first PET/CT exams, they badly need to know if they should have a limited resection or follow-up. When invasive adenocarcinoma (IAC) is suspected, no matter how many percentage of the solid component of GGNs presents, a wait-and-see CT surveillance should be terminated. The patients may achieve more benefit from a less invasive lobectomy such as robotic surgery, instead of a limited resection or other alternative treatments in patients with AIS-MIA [6, 31].
To date, the optimal performance of PET/CT with HRCT to predict IAC remains unknown. At the present study, we hypothesized that combination of consolidation/tumor ratio (CTR) and other CT features with SUVmax on 18F-FDG PET/CT has a good capability to differentiate IAC from AIS-MIA in malignant GGNs of stage IA lung adenocarcinoma, and it would be useful for guiding preoperative decision making in surgical resection.
RESULTS
Readers agreement demonstrated almost perfect consistency in measurements (ICC = 0.955 for DGGN, ICC =0.966 for DSolid, and ICC = 0.996 for SUVmax).
Comparisons of different pathologic diagnoses among HRCT features are displayed in Table 1. AIS-MIA cases preferentially manifested as pure GGN (p < 0.01) when compared to the IAC (Figure 1), while cystic appearance was more common in IAC GGNs (p < 0.05) (Figure 2 and Figure 3). Significant differences were also found in the DGGN, Dsolid, and CTR between the two groups (12.6 mm vs 20.0 mm, 2.3 mm vs 11.5 mm, 16.2% vs 54.5%, respectively).
Table 1: Morphologic features and CT measurements of solitary GGNs with stage IA lung cancer on HRCT
Features |
Type |
AIS-MIA (n = 15) |
IAC (n = 43) |
p Value |
|---|---|---|---|---|
Nodule Type |
pure GGN |
8 (53.3) |
2 (4.7) |
0.000* |
mixed GGN |
7 (46.7) |
41 (95.3) |
||
Position |
subpleural/ |
12 (80.0) |
40 (83.0) |
0.350* |
parenchymal |
3 (20.0) |
3 (7.0) |
||
Shape |
oval/round |
11 (73.3) |
26 (60.5) |
0.372* |
irregular/ |
4 (26.7) |
17 (39.5) |
||
Margin |
smooth |
7 (46.7) |
21 (48.8) |
0.885* |
lobulated/ |
8 (53.3) |
22 (51.2) |
||
Bronchus sign |
natural |
12 (80.0) |
25 (58.1) |
0.129* |
dilated/ |
0 (0) |
6 (14.0) |
0.300* |
|
cut-off |
0 (0) |
1 (2.3) |
1.000** |
|
Cystic appearance |
presence |
0 (0) |
12 (27.9) |
0.016* |
Pleural indentation |
presence |
6 (40.0) |
38 (88.4) |
0.054* |
Vascular convergence |
presence |
12 (80.0) |
37 (86.0) |
1.000* |
Diameter of GGN (mm) |
12.6 ± 3.3 (8.4~20.3) |
20.0 ± 5.6 (10.5~29.8) |
0.000† |
|
Diameter of solid component (mm) |
2.3 ± 2.8 (0~8.5) |
11.5 ± 6.8 (0~24.3) |
0.000† |
|
Consolidation/tumor ratio (%) |
16.2 ± 19.3 (0~51.2) |
54.5 ± 26.3 (0~94.8) |
0.000‡ |
|
CT value of GGO component (HU) |
–562.4 ± 120.0 |
–501.9 ± 115.1 |
0.089‡ |
|
ΔCTGGO-LP (HU) |
312.1 ± 132.5 (23.5~595.7) |
370.0 ± 109.2 (171.6~575.9) |
0.100‡ |
Note.— Data of morphologic features are expressed as number of cases with the percentages in parentheses. Data of CT measurements are expressed as mean ± standard deviation with the ranges in parentheses. GGN: ground-glass opacity nodule; HRCT: high-resolution computed tomography; AIS: adenocarcinoma in situ; MIA: minimally invasive adenocarcinoma; IAC: invasive adenocarcinoma; ΔCTGGO-LP: difference of CT value between GGO component and adjacent lung.
*Chi-square test; **Fisher`s Exact test; †Mann-Whitney U test; ‡Student t test.
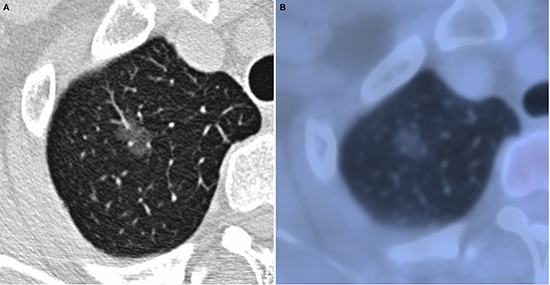
Figure 1: Adenocarcinoma in situ in 52-year-old woman. (A) transverse lung-window HRCT scan demonstrates an oval, smooth, well-defined subpleural pure GGN in the apical segment of right upper lobe. (B) PET/CT fusion image shows a 12.2-mm pure GGN with no solid component and 0.67 of SUVmax.
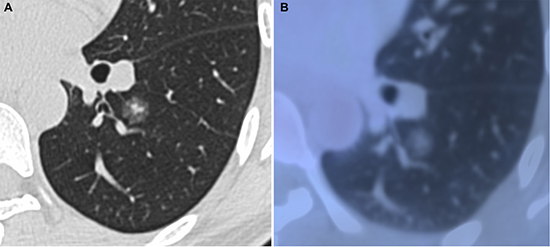
Figure 2: Minimally invasive adenocarcinoma in 40-year-old woman. (A) transverse lung-window HRCT scan demonstrates a round, spiculated, well-defined parenchymal mixed GGN with pleural indentation in the apical segment of the left lower lobe. (B) PET/CT fusion image with perfusion mode shows a 11.9-mm mixed GGN with 0.25 of CTR and 0.81 of SUVmax.
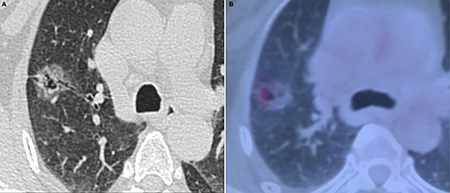
Figure 3: Invasive adenocarcinoma in 58-year-old woman. (A) transverse lung-window HRCT scan demonstrates a round, lobulated, well-defined subpleural mixed GGN with natural bronchus sign, cystic appearance, and pleural indentation in the apical segment of right upper lobe. (B) is caudal to (A): PET/CT fusion image with perfusion mode shows a 22.5-mm oval mixed GGN with 0.68 of CTR and 3.32 of SUVmax.
The results of ROC analyses to compare the capability of SUVmax and CTR for differentiating IAC from AIS-MIA in solitary GGNs are displayed in Figure 4. Feasible preliminary threshold values for CTR and SUVmax were 0.39 and 0.95, respectively. While areas under the ROC curve were 0.868 for CTR (p < 0.01) and 0.798 for SUVmax (p < 0.01). According to the two cutoff values, CTR and SUVmax were performed respectively into binary data, which were used to control confounders of other HRCT features with statistically significant difference by binary logistic regression analysis. DGGN and Dsolid were respectively correlated with both SUVmax and CTR (all p < 0.05), whereas cystic appearance was reverse correlated with both SUVmax and CTR (regression coefficient = –1.609~–1.012). Hence, nodule type was the only independent HRCT characteristic parameter of no statistical significance with regression coefficient > 0, which didn’t interfere with both CTR and SUVmax.
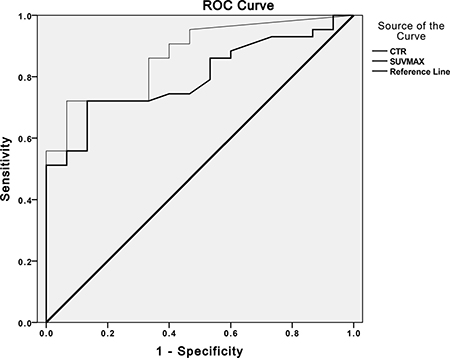
Figure 4: The receiver operating characteristic (ROC) curve analyses to compare the capability of SUVmax and CTR. Graph illustrates results of ROC analyses of CTR > 0.39 (thin line) at HRCT and SUVmax > 0.95 (thick line) at PET/CT as reference for discriminating IAC from AIS-MIA in solitary pulmonary GGNs. Areas under ROC curve for CTR > 0.39 (0.868, p < 0.05) was slightly greater than that for SUVmax > 0.95 (0.798, p < 0.05). AIS: adenocarcinoma in situ; CTR: consolidation/tumor ratio; IAC: invasive adenocarcinoma; MIA: minimally invasive adenocarcinoma; SUVmax: maximum standard uptake value.
In the present study, AIS-MIA and IAC were regarded as dependent variables, and CTR, SUVmax, and nodule type were indicators for IAC diagnosis of solitary GGNs with stage IA lung adenocarcinoma. The corresponding multivariate logistic regression equation was as follows:
ln(p/1-p) = –3.157 + 0.984 × SUVmax + 0.032 × CTR + 1.108 × Nodule Type
where p is the probability of IAC GGN. When the p value was greater than or equal to 0.05, the malignant GGN was predicted to be more invasive, whereas less than 0.05 was expected to be AIS-MIA.
In terms of IAC diagnosis, the odds ratio of SUVmax, CTR, and Nodule Type were 2.675, 1.033, and 3.027, respectively.
The exact probability values of 58 cases were calculated by backtesting the above-mentioned multivariate logistic regression equation with the specific evaluations of the SUVmax, CTR, and Nodule Type. Afterwards, the 58 exact probability values were analyzed by ROC analyses and Youden index to determine the ultimate combined optimal cutoff values of CTR > 0.38, SUVmax > 1.46, and mixed GGN of Nodule Type. The capability of SUVmax > 0.95 alone, CTR > 0.39 alone, and the combination of CTR > 0.38, SUVmax > 1.46, and mixed GGN for differentiation between AIS-MIA and IAC in solitary GGNs of stage IA lung adenocarcinoma was shown in Table 2. In terms of all the performances, the ultimate combined optimal cutoff values of CTR > 0.38, SUVmax > 1.46, and mixed GGN demonstrated a higher sensitivity, a favourable negative predictive value and accuracy, but a balanced specificity and positive predictive value. The sensitivity of the combined CTR > 0.38, SUVmax > 1.46 with mixed GGN was higher than that of SUVmax > 0.95 alone or CTR > 0.39 alone via the McNemar test (both p < 0.05).
Table 2: Performance values of different indexes for differentiation between AIS-MIA and IAC in solitary GGNs with stage IA lung cancer on PET/CT
Index |
Threshold value |
Sensitivity |
Specificity |
PPV |
NPV |
Accuracy |
|---|---|---|---|---|---|---|
SUVmax |
> 0.95 |
72.1 (31/43) |
86.7 (13/15) |
93.9 (31/33) |
52.0 (13/25) |
75.9 (44/58) |
CTR |
> 0.39 |
72.1 (31/43) |
86.7 (13/15) |
93.9 (31/33) |
52.0 (13/25) |
75.9 (44/58) |
CTR + SUVmax + Nodule type† |
> 0.38/> 1.46/mGGN |
95.3 (41/43)* |
60.0 (9/15) |
87.2 (41/47) |
81.8 (9/11) |
86.2 (50/58) |
Note.— Data are expressed as are percentages, with the numbers of solitary GGNs used to calculate the percentages in parentheses. GGN: ground-glass opacity nodule; SUVmax: maximum standard uptake value; PPV: positive predictive value; NPV: negative predictive value; CTR: consolidation/tumor ratio.
*Significant difference (p < 0.05) between sensitivity of the parameter and those of SUVmax > 0.95 and CTR > 0.39.
†Combination value means that either of three parameters is positive, then the diagnosis is positive.
DISCUSSION
According to the new adenocarcinoma classification [32], AIS and MIA are defined as small (≤ 3 cm) solitary lung adenocarcinoma with a pure or predominantly lepidic growth pattern, which means that alveolar epithelial cells are replaced by cancer cells. This growth pattern mainly manifests as a solitary GGN on HRCT and a lower FDG uptake on PET/CT [26]. Our major finding is that the combination of CTR > 0.38, SUVmax > 1.46, and mixed GGN was a better indicator for differentiating IAC from AIS-MIA in solitary GGNs of stage IA pulmonary adenocarcinoma.
The solid component of GGN can be central fibrosis in alveolar space, invasive component, or collapsed parenchyma [14], whereas the GGO component of GGN is formed by a lepidic growth pattern on HRCT [16]. The tendency of GGNs from non-invasive lesions, MIAs, to IACs might be corresponding to increased CTR [33]. To some extent, CTR reflected the percentage of mostly invasive solid component within GGN on HRCT. In terms of GGN with very low SUVmax [29, 30], the widely used threshold value of SUVmax > 2.5 to predict malignant tumor in clinical practice is not powerful any more. This is because that higher SUVmax values may predict more highly invasive tumors on PET/CT [33]. In this investigation, we combined CTR with SUVmax and HRCT features to determine an optimal threshold to differentiate IAC from AIS-MIA. Our result revealed that the combination of CTR > 0.38, SUVmax > 1.46, and mixed GGN yielded a higher sensitivity (95.3%) and accuracy (86.2%) than the SUVmax > 0.95 (72.1% and 75.9%) to predict IAC. Our result was consistent with the previously published report [14, 33, 34]. None of the patients with pre-invasive AIS showed that both SUVmax ≤ 1.0 and CTR ≤ 0.40 had lymphatic vessel invasion [14]. According to some CT-based reports, CTR > 0.53 is helpful for predicting IAC among peripheral lung adenocarcinomas within 3 cm in diameter [33], while CTR > 0.62 might predict invasiveness of stage IA lung cancer from AIS-MIA [34]. Furthermore, the previous studies showed that peripheral or clinical T1b lung adenocarcinomas with CTR ≤ 0.5 were nonaggressive adenocarcinomas with better outcomes [4, 13]. Therefore, our study could provide more precise clue preoperatively to stop a further CT surveillance, employ a standard or less invasive lobectomy, or even prepare an alternative treatment for patients with incomplete tumor resection by predicting IACs. On the other hand, those patients predicting as non-IAC would furtherly differentiate MIA from AIS, and they may plan carefully to have a limited resection or a follow-up CT scan.
CT features of GGNs may reflect their potential malignant nature. In our study, binary logistic regression analyses showed that only nodule type did not interfere with both CTR and SUVmax. Our data were consistent with previous reports [16, 17], that mixed GGN was more common within IAC GGN. Recently, Kakinuma et al. [35] found that at least a small portion (approximately 1%) of solitary pure GGNs within 5 mm will develop into IACs or MIAs appearing as solitary mixed GGNs. Thereby, increased SUVmax and CTR with mixed GGN may predict solitary GGNs developing into more invasive. There was significant difference of DGGN and Dsolid between IAC and AIS-MIA, which is consistent with previous study [17]. There was also markedly statistical significance of cystic appearance between IAC and AIS-MIA, it may be the reason that lung cancer has an association with cystic appearance [36] and especially there was significant difference in cystic appearance between pure GGN and mixed GGN [37]. However, these excluded HRCT features interfered with both SUVmax and CTR via binary logistic regression analyses. Furthermore, there was no statistic difference of position, shape, margin, bronchus sign, pleural indentation, vascular convergence, CTGGO, and ΔCTGGO-LP between IAC and AIS-MIA groups. These findings are consistent with the previous studies [16, 17, 38].
There are several limitations in our present study. First, selection bias may occur because some stage IA lung adenocarcinoma patients with a solitary GGN were excluded due to the lack of PET/CT examination before operation. Second, this study has a small sample size, a further prospective investigation with a large number of cases is needed to verify the present predicative mode.
MATERIALS AND METHODS
Patients
This study was approved by the institutional review board of our hospital. We retrospectively reviewed all stage IA lung adenocarcinoma patients in our hospital between June 2010 and May 2016. All patients must meet the following inclusion criteria: (i) adenocarcinoma or its precursor; (ii) a solitary pulmonary nodule (SPN) with ground glass opacity; (iii) 3 cm or smaller of the lesion size; (iv) preoperative PET/CT; (v) preoperative focal continuous HRCT examination; (vi) surgical resection; and (vii) within one month interval of all PET/CT, HRCT, and GGN resection. This investigation excluded these kind of subjects: (i) the diameter of a solitary GGN ≥ 3 cm; (ii) multiple nodules; (iii) poor image quality due to motion artifact; (iv) with any anti-tumoral therapies; (v) adenocarcinoma exceeding stage IA; and (vi) direct evidence of synchronous primary or prior malignancy in the past 5 years.
Consecutive fifty-eight patients with a mean age of 60.2 years ± 9.5 (range 39~81 years; M: F = 18: 40) were included our study. The interval between final PET/CT with HRCT and surgery ranged from 1 to 25 days (4.4 days ± 4.0). Of the 58 GGNs, mixed GGN was seen in 48 cases, and pure GGN in 10 cases.
According to the new IASLC/ATS/ERS adenocarcinoma classification [31], pathologic diagnoses included AIS in 3 cases, MIA in 12 cases, and IAC in the rest 43 cases (acinar predominant in 32 cases, lepidic predominant in 6 cases, papillary predominant in 4 cases, and invasive mucinous in one case). The cases were divided into two groups based on clinical implication of treatment: AIS-MIA group and IAC group.
18F-FDG PET/CT examination and image analysis
All patients fasted for at least 6 hours prior to PET/CT study. Insulin was discontinued at least 6 hours before examination, and a serum blood glucose level was verified to be below 10 mmol/L. All patients received FDG intravenously from 333 to 481 MBq, and then rested quietly around 60 minutes.
The following two dedicated diagnostic PET/CT devices were employed: Discovery VCT unit (GE Medical Systems, Waukesha, USA) and uMI S-96R unit (United Imaging, Shanghai, China) with a 64/16-MDCT scanner. Low-dose registration CT and a whole-body PET were acquired from head to mid-thigh. All PET/CT scans were displayed via a uWS-MI R001 workstation (United Imaging, Shanghai, China) and lung (window width, 1000 HU; window level, -700 HU) and mediastinal (window width, 300 HU; window level: 45 HU) window settings.
Two nuclear medicine physicians (1 year and 10 years of experience) who were blind to all of the clinical data and pathologic diagnosis, evaluated the PET/CT images by joint review. For a semi-quantitative analysis of FDG uptake, a large oval volume of interest (VOI) was used. The SUVmax of a GGN was measured in an original size or a fit size with standard lung window and PET perfusion mode, and the GGN was fully encased. All measurements were performed with 2 times zoom. When misregistration was found between PET and CT images, manual correct of the PET/CT was made. All measurements were performed 3 times and averaged.
High-resolution CT scanning and image analysis
All patients underwent a breath-hold HRCT scan immediately after routine PET/CT scanning at our hospital. The scope of continuous HRCT scans was obtained only for pulmonary nodules region with the patients in a supine position. Two aforementioned MDCT scanners were used with the following settings: GE/UI scanners [120 kVp; 500 mA/200 mAs; tube rotation time, 0.4~1 s per rotation; pitch, 0.937~1.375; slice thickness, 0.5~0.625 mm; reconstruction algorithm, Bone/B_VSHARP_C; and matrix, 512×512]. All HRCT scans were displayed via a uWS-MI R001 workstation and lung (window width, 1500 HU; window level, -450 HU) and mediastinal (window width, 300 HU; window level: 45 HU) window settings.
Two radiologists (with 6 years and 12 years of experience in chest CT image analysis) who were unaware of all the clinical data and pathologic diagnosis, assessed the CT feature of GGN in position (subpleural/perifissural and parenchymal), type (pure GGN and mixed GGN), shape (round/oval and polygonal/irregular), margin (smooth and lobulated/spiculated), internal characteristics (bronchus sign and cystic appearance), and adjacent structures (pleural indentation and vascular convergence). Bronchus sign was classified into natural, dilated and distorted, and cut-off [39]. Cystic appearance was defined as an oval, round, or large area of low attenuation within GGNs [40]. In cases of discrepancies between the two radiologists, a consensus was reached by joint review.
The diameter of GGN (DGGN) was as the longest diameter on the transverse standard lung window image. For a mixed GGN, the diameter of the solid component (DSolid) was also measured in the longest diameter as the DGGN on the transverse standard lung window image. The attenuation value of the GGO component (CTGGO) and normal lung parenchyma adjacent to GGO (CTLP) were measured using an oval region of interest covering the identical objects. Vessels, bronchi, and air-containing space within GGO were spared as far as possible, and lung markings were away from measurement of normal lung parenchyma adjacent to GGO.
All of the measurements were carried out independently by two radiologists using electronic calliper with 3~8 times zoom, whereas vascular convergence was evaluated with original or fit size. Then, the measurements were averaged. The ratio of the maximum diameter of solid component to the maximum tumor diameter (consolidation/tumor ratio, CTR) was calculated as previously reported [14]. According to HRCT feature, CTR of a pure GGN = 0, whereas CTR of a mixed GGN < 1.0 but > 0. The difference of CTGGO and CTLP (ΔCTGGO–LP) was calculated as follows: CTGGO –CTLP.
Statistical analysis
All numerical values are reported as mean ± standard deviation (mean ± SD). Statistical analyses were performed by using software (IBM SPSS version 22.0 for Mac OS, IBM, USA). All variables with a value of p < 0.05 were considered to indicate statistically significant differences.
Intraclass correlation coefficient (ICC) [41] was used to estimate consistency of measurements made by two nuclear medicine physicians and radiologists.
To determine the differences of HRCT features of the GGNs between AIS-MIA and IAC, we performed the Chi-square test or Fisher`s exact test for qualitative data and the student t test or Mann-Whitney U test for quantitative data.
We also used ROC analysis and Youden index to identify the feasible preliminary threshold values of SUVmax at PET/CT and CTR at HRCT for distinguishing invasive adenocarcinoma from pre-invasive or minimally invasive adenocarcinoma in stage IA patients with solitary GGNs. Subsequently, binary logistic regression analysis was employed to exclude potential confounders of other HRCT features with statistical significant difference or regression coefficient < 0 on the basis of binary SUVmax and CTR data, respectively.
Then, a logistic regression equation including SUVmax, CTR, and other HRCT features was formed by multivariate logistic regression analysis. The three included parameters with their specific evaluations or measurements of the 58 patients were backtested by the newly formed logistic regression equation to compute 58 exact probability values, which were used to determine an optimal probability value by ROC analysis and Youden index. According to the optimal probability value, the ultimate combined optimal cutoff values of the SUVmax, CTR, and other HRCT features were identified to predict invasion of stage IA lung adenocarcinoma with GGO component. The positive diagnosis (i.e., invasive adenocarcinoma) was established by either of any positive combined optimal cutoff values. Finally, the sensitivity, specificity, positive predictive value, negative predictive value, and accuracy among the preliminary threshold values of SUVmax or CTR, and the ultimate combined optimal cutoff values of the SUVmax, CTR, and other HRCT features were compared via the McNemar test to differentiate IAC from AIS-MIA in stage IA lung adenocarcinoma patients with solitary GGNs.
CONCLUSIONS
In conclusion, a mixed GGN with the combination of CTR > 0.38 and SUVmax > 1.46 may be more reliably to predict IAC from AIS-MIA in stage IA lung adenocarcinoma patients with solitary GGNs.
ACKNOWLEDGMENTS
We appreciate Dr. Yingjie Zheng for his assistance in statistical analysis, Dr. Gang Chen for pathological evaluation, and Dr. Wengen Chen for the English editing of the manuscript.
CONFLICTS OF INTEREST
The authors have reported to Oncotarget that no potential conflict of interests exists to influence the results and discussion reported in this paper.
FUNDING
None.
REFERENCES
1. Austin JH, Muller NL, Friedman PJ, Hansell DM, Naidich DP, Remy-Jardin M, Webb WR, Zerhouni EA. Glossary of terms for CT of the lungs: recommendations of the Nomenclature Committee of the Fleischner Society. Radiology. 1996; 200:327–331.
2. Kuriyama K, Seto M, Kasugai T, Higashiyama M, Kido S, Sawai Y, Kodama K, Kuroda C. Ground-glass opacity on thin-section CT: value in differentiating subtypes of adenocarcinoma of the lung. Am J Roentgenol. 1999; 173:465–469.
3. Henschke CI, Yankelevitz DF, Mirtcheva R, McGuinness G, McCauley D, Miettinen OS, Group E. CT screening for lung cancer: frequency and significance of part-solid and nonsolid nodules. Am J Roentgenol. 2002; 178:1053–1057.
4. Aoki T, Hanamiya M, Uramoto H, Hisaoka M, Yamashita Y, Korogi Y. Adenocarcinomas with predominant ground-glass opacity: correlation of morphology and molecular biomarkers. Radiology. 2012; 264:590–596.
5. Lee SM, Goo JM, Lee KH, Chung DH, Koh J, Park CM. CT findings of minimally invasive adenocarcinoma (MIA) of the lung and comparison of solid portion measurement methods at CT in 52 patients. Eur Radiol. 2015; 25:2318–2325.
6. Yoshizawa A, Motoi N, Riely GJ, Sima CS, Gerald WL, Kris MG, Park BJ, Rusch VW, Travis WD. Impact of proposed IASLC/ATS/ERS classification of lung adenocarcinoma: prognostic subgroups and implications for further revision of staging based on analysis of 514 stage I cases. Mod Pathol. 2011; 24:653–664.
7. Tsuta K, Kawago M, Inoue E, Yoshida A, Takahashi F, Sakurai H, Watanabe S, Takeuchi M, Furuta K, Asamura H, Tsuda H. The utility of the proposed IASLC/ATS/ERS lung adenocarcinoma subtypes for disease prognosis and correlation of driver gene alterations. Lung Cancer. 2013; 81:371–376.
8. Wilshire CL, Louie BE, Manning KA, Horton MP, Castiglioni M, Gorden JA, Aye RW, Farivar AS, Vallieres E. Radiologic Evaluation of Small Lepidic Adenocarcinomas to Guide Decision Making in Surgical Resection. Ann Thorac Surg. 2015; 100:979–988.
9. Lee KW, Im JG, Kim TJ, Dae CM. A new method of measuring the amount of soft tissue in pulmonary ground-glass opacity nodules: a phantom study. Korean J Radiol. 2008; 9:219–225.
10. Lee HY, Lee KS, Han J, Kim BT, Cho YS, Shim YM, Kim J. Mucinous versus nonmucinous solitary pulmonary nodular bronchioloalveolar carcinoma: CT and FDG PET findings and pathologic comparisons. Lung Cancer. 2009; 65:170–175.
11. Yanagawa M, Kuriyama K, Kunitomi Y, Tomiyama N, Honda O, Sumikawa H, Inoue A, Mihara N, Yoshida S, Johkoh T, Nakamura H. One-dimensional quantitative evaluation of peripheral lung adenocarcinoma with or without ground-glass opacity on thin-section CT images using profile curves. Br J Radiol. 2009; 82:532–540.
12. Fan L, Liu SY, Li QC, Yu H, Xiao XS. Multidetector CT features of pulmonary focal ground-glass opacity: differences between benign and malignant. Br J Radiol. 2012; 85:897–904.
13. Aokage K, Yoshida J, Ishii G, Matsumura Y, Haruki T, Hishida T, Nagai K. Identification of early t1b lung adenocarcinoma based on thin-section computed tomography findings. J Thorac Oncol. 2013; 8:1289–1294.
14. Hattori A, Suzuki K, Matsunaga T, Fukui M, Tsushima Y, Takamochi K, Oh S. Tumour standardized uptake value on positron emission tomography is a novel predictor of adenocarcinoma in situ for c-Stage IA lung cancer patients with a part-solid nodule on thin-section computed tomography scan. Interact Cardiovasc Thorac Surg. 2014; 18:329–334.
15. Tamura M, Shimizu Y, Yamamoto T, Yoshikawa J, Hashizume Y. Predictive value of one-dimensional mean computed tomography value of ground-glass opacity on high-resolution images for the possibility of future change. J Thorac Oncol. 2014; 9:469–472.
16. Zhang Y, Qiang JW, Ye JD, Ye XD, Zhang J. High resolution CT in differentiating minimally invasive component in early lung adenocarcinoma. Lung Cancer. 2014; 84:236–241.
17. Zhang Y, Shen Y, Qiang JW, Ye JD, Zhang J, Zhao RY. HRCT features distinguishing pre-invasive from invasive pulmonary adenocarcinomas appearing as ground-glass nodules. Eur Radiol. 2015; 26:2921–2928.
18. Jang HJ, Lee KS, Kwon OJ, Rhee CH, Shim YM, Han J. Bronchioloalveolar carcinoma: focal area of ground-glass attenuation at thin-section CT as an early sign. Radiology. 1996; 199:485–488.
19. Mirtcheva RM, Vazquez M, Yankelevitz DF, Henschke CI. Bronchioloalveolar carcinoma and adenocarcinoma with bronchioloalveolar features presenting as ground-glass opacities on CT. Clin Imaging. 2002; 26:95–100.
20. Liu LH, Liu M, Wei R, Jin EH, Liu YH, Xu L, Li WW, Huang Y. CT findings of persistent pure ground glass opacity: can we predict the invasiveness? Asian Pac J Cancer Prev. 2015; 16:1925–1928.
21. Kim HY, Shim YM, Lee KS, Han J, Yi CA, Kim YK. Persistent pulmonary nodular ground-glass opacity at thin-section CT: histopathologic comparisons. Radiology. 2007; 245:267–275.
22. Sumikawa H, Johkoh T, Nagareda T, Sekiguchi J, Matsuo K, Fujita Y, Natsag J, Inoue A, Mihara N, Honda O, Tomiyama N, Minami M, Okumura M, et al. Pulmonary adenocarcinomas with ground-glass attenuation on thin-section CT: quantification by three-dimensional image analyzing method. Eur J Radiol. 2008; 65:104–111.
23. Kodama K, Higashiyama M, Yokouchi H, Takami K, Kuriyama K, Mano M, Nakayama T. Prognostic value of ground-glass opacity found in small lung adenocarcinoma on high-resolution CT scanning. Lung Cancer. 2001; 33:17–25.
24. Ohno Y, Koyama H, Matsumoto K, Onishi Y, Takenaka D, Fujisawa Y, Yoshikawa T, Konishi M, Maniwa Y, Nishimura Y, Ito T, Sugimura K. Differentiation of malignant and benign pulmonary nodules with quantitative first-pass 320-detector row perfusion CT versus FDG PET/CT. Radiology. 2011; 258:599–609.
25. Chun EJ, Lee HJ, Kang WJ, Kim KG, Goo JM, Park CM, Lee CH. Differentiation between malignancy and inflammation in pulmonary ground-glass nodules: The feasibility of integrated (18)F-FDG PET/CT. Lung Cancer. 2009; 65:180–186.
26. Uehara H, Tsutani Y, Okumura S, Nakayama H, Adachi S, Yoshimura M, Miyata Y, Okada M. Prognostic role of positron emission tomography and high-resolution computed tomography in clinical stage IA lung adenocarcinoma. Ann Thorac Surg. 2013; 96:1958–1965.
27. Shiono S, Yanagawa N, Abiko M, Sato T. Detection of non-aggressive stage IA lung cancer using chest computed tomography and positron emission tomography/computed tomography. Interact Cardiovasc Thorac Surg. 2014; 19:637–643.
28. Tsutani Y, Miyata Y, Nakayama H, Okumura S, Adachi S, Yoshimura M, Okada M. Segmentectomy for clinical stage IA lung adenocarcinoma showing solid dominance on radiology. Eur J Cardiothorac Surg. 2014; 46:637–642.
29. Heyneman LE, Patz EF. PET imaging in patients with bronchioloalveolar cell carcinoma. Lung Cancer. 2002; 38:261–266.
30. Aquino SL, Halpern EF, Kuester LB, Fischman AJ. FDG-PET and CT features of non-small cell lung cancer based on tumor type. Int J Mol Med. 2007; 19:495–499.
31. Van Schil PE, Asamura H, Rusch VW, Mitsudomi T, Tsuboi M, Brambilla E, Travis WD. Surgical implications of the new IASLC/ATS/ERS adenocarcinoma classification. Eur Respir J. 2012; 39:478–486.
32. Van Schil PE, Sihoe AD, Travis WD. Pathologic classification of adenocarcinoma of lung. J Surg Oncol. 2013; 108:320–326.
33. Iwano S, Kishimoto M, Ito S, Kato K, Ito R, Naganawa S. Prediction of pathologic prognostic factors in patients with lung adenocarcinomas: comparison of thin-section computed tomography and positron emission tomography/computed tomography. Cancer Imaging. 2014; 14: 3.
34. Yu WS, Hong SR, Lee JG, Lee JS, Jung HS, Kim DJ, Chung KY, Lee CY. Three-Dimensional Ground Glass Opacity Ratio in CT Images Can Predict Tumor Invasiveness of Stage IA Lung Cancer. Yonsei Med J. 2016; 57:1131–1138.
35. Kakinuma R, Muramatsu Y, Kusumoto M, Tsuchida T, Tsuta K, Maeshima AM, Asamura H, Moriyama N. Solitary Pure Ground-Glass Nodules 5 mm or Smaller: Frequency of Growth. Radiology. 2015; 276:873–882.
36. Mascalchi M, Attina D, Bertelli E, Falchini M, Vella A, Pegna AL, Ambrosini V, Zompatori M. Lung cancer associated with cystic airspaces. J Comput Assist Tomogr. 2015; 39:102–108.
37. Xing Y, Li Z, Jiang S, Xiang W, Sun X. Analysis of pre-invasive lung adenocarcinoma lesions on thin-section computerized tomography. Clin Respir J. 2015; 9:289–296.
38. Cohen JG, Reymond E, Lederlin M, Medici M, Lantuejoul S, Laurent F, Arbib F, Jankowski A, Moreau-Gaudry A, Ferretti GR. Differentiating pre- and minimally invasive from invasive adenocarcinoma using CT-features in persistent pulmonary part-solid nodules in Caucasian patients. Eur J Radiol. 2015; 84:738–744.
39. Gaeta M, Pandolfo I, Volta S, Russi EG, Bartiromo G, Girone G, La Spada F, Barone M, Casablanca G, Minutoli A. Bronchus sign on CT in peripheral carcinoma of the lung: value in predicting results of transbronchial biopsy. Am J Roentgenol. 1991; 157:1181–1185.
40. Hansell DM, Bankier AA, MacMahon H, McLoud TC, Muller NL, Remy J. Fleischner Society: glossary of terms for thoracic imaging. Radiology. 2008; 246:697–722.
41. Pitzalis MV, Mastropasqua F, Massari F, Forleo C, Di Maggio M, Passantino A, Colombo R, Di Biase M, Rizzon P. Short- and long-term reproducibility of time and frequency domain heart rate variability measurements in normal subjects. Cardiovasc Res. 1996; 32:226–233.