
Introduction
The incidence of adenocarcinoma of esophagogastric junction (AEG) has been dramatically increasing in Western countries during the past few decades [1, 2]. Recently, this trend has also occurred in Asia [3]. In China, due to the lack of routine preoperative screening, AEG is often diagnosed at an advanced stage with lymph node metastasis and hematogenous dissemination, resulting in a poor prognosis [3]. In both Western and Eastern countries, AEG-caused mortality is high. According to the location of tumor epicenter, Siewert [4] classified AEG into 3 subgroups. In Western countries, type I AEG (adenocarcinoma of the distal esophagus) is the most prevalent type, and is generally treated as esophageal cancer [5]. In Asia, types II (adenocarcinoma of the cardiac) and III AEG (subcardial adenocarcinoma that infiltrates the esophagogastric junction) are commoner than type I and are mostly treated as gastric cancer [6]. Despite multiple systemic treatment options against AEG, the outcome remains unoptimistic.
There is intense interest in the discovery of prognostic biomarkers that will improve clinical outcomes through risk classification, but most of them have not yet come into routine clinical practice, due to high costs or non-standardization. Although tumor-associated inflammation has not been explicitly elucidated, emerging evidence has revealed that it plays an important role in cancer progression and indicates prognosis [7]. Peripheral blood cells might reflect the inflammatory status of patients. The tumor-related leukocytes, especially monocytes, neutrophils and lymphocytes, which are key regulators of tumor immunity, have essential roles in systemic inflammatory response to malignancies. A series of pretreatment inflammatory biomarkers, including monocyte-lymphocyte ratio (MLR), neutrophil-lymphocyte ratio (NLR) and platelet-lymphocyte ratio (PLR), have been investigated with the hope to predict prognosis in various cancers (e.g., esophageal squamous cell carcinoma [8], colorectal cancer [9], and breast cancer [10]). They might be good reflection of hosts’ immune status and tumor burden [11].
However, few studies concerning these inflammatory biomarkers in AEG exist, with the clinical significances and prognostic values remaining obscure. The aim of this study was to investigate the clinical significances and the prognostic values of preoperative MLR, NLR, and PLR for patients with non-metastatic Siewert type II/III AEG.
Materials and Methods
Patient enrollment and treatment
A total of 641 patients with histologically/cytologically and imaging-diagnostically confirmed non-metastatic Siewert type II/III AEG who required surgical resection were initially consecutively included in this prospective study (the AMONP cohort). All patients were treated at Department of Gastrointestinal Surgery in The First Affiliated Hospital of Anhui Medical University from February 2006 to February 2011. They were in relatively good overall conditions (e.g., Hb > 90 g/L, albumin > 30 g/L, good liver and renal function, and ECOG score 0-2), without severe dysfunction of important organs or systematic unfit like dyscrasia, autoimmune or immunodeficiency diseases, infection, or severe mental disorders. They had not received any interventional therapy, cytotoxical treatment, peripheral blood stimulating regimen, or major abdominal surgery before. Patients undergoing multivisceral resection or having other gastrointestinal diseases or malignancies were excluded from this study. Those who had received neoadjuvant therapy or who received blood product transfusion within 1 month before resection were also excluded to avoid the possible influences of such treatments on preoperative laboratory profiles. Inconsistency in diagnosis, pathology, and lesion position before and after resection also excluded the patient from investigation.
All enrolled patients underwent radical surgery. For type II adenocarcinomas invading distal esophagus, transhiatal total gastrectomy (TG) combined with mediastinal lymphadenectomy was conducted. Thoracoabdominal incision might be performed for subtotal esophagectomy to guarantee curability, if the frozen section of proximal esophageal cutting edge was positive even after repeating resection of the distal esophagus. For type III tumors, transabdominal TG was performed. D2 lymphadenectomy was routinely performed. Inferior mediastinal or extended lymph node dissection was performed for patients with esophageal involvement. Intraoperative frozen section was a routine procedure aiming to secure the resection margins free from tumor cells. All operations were conducted by the surgeons who routinely operated on more than 50 cases per year and who had surgical practice of 5 or more consecutive years. After radical surgery, all patients received 4-6 cycles of first-line adjuvant combination chemotherapy with oxaliplatin plus 5-fluorouracil/leucovorin (FOLFOX) or a prodrug of 5-fluorouracil (capecitabine; CapeOX). Patients were excluded if they died of postoperative complications or had positive resection margins.
This study was approved by the Ethics Committee of The First Affiliated Hospital of Anhui Medical University. Written informed consent was obtained from each patient. The study complied was performed in accordance with the guidelines of Declaration of Helsinki [12] and Good Clinical Practice [13].
Measurement and definition
Preoperatively, gastroscopy, barium meal, computed tomography (CT) and magnetic resonance imaging (MRI) examinations were routinely conducted, forming the basis of AEG Siewert classification and clinical staging [6]. Tumor length, nerve invasion, and vessel involvement were obtained from pathological and surgical reports, providing information for pathological staging. Before analysis, all patients’ tumor stages were (re)assessed according to the 7th version of the TNM staging system by AJCC/UICC [14]. In the current study, cancer-specific survival (CSS) was applied, and was defined as the interval between surgery and AEG-related death/end of follow-up.
Laboratory test
As part of pretreatment evaluation, all patients’ peripheral blood samples were collected into tubes containing dipotassium ethylenedinitrotetra-acetic acid (EDTA) 3 days before surgery, and all measurements including blood routine tests were performed within 30 minutes after blood collection. MLR, NLR, and PLR were calculated as the ratios of the absolute counts of monocyte, neutrophil, and platelet to lymphocyte, respectively.
Follow-up
Enrolled patients were prospectively followed-up until April 2016. Follow-up was performed in regular intervals (every 3 months for the first 2 years after treatment, every 6 months in years 3-5, and every 12 months after 5 years). Patients’ evaluations included clinical examination, laboratory tests, and radiological assessment.
Statistical analysis
The cut-off levels of the 3 ratios were set as the respective medians. Descriptive statistics were applied for the overall patients and those with low- and high-level ratios. The association between clinicopathological features and the 3 ratios in overall patients and those with stages II and III AEG was quantified using the multivariate Logistic regression model with gender, age group (≤ and > 63 years (median)), tumor position, stage, nerve invasion, and vessel involvement adjusted, and with the risk ratio (RR) estimates and the corresponding 95% confidence intervals (CIs) shown. The association of the 3 ratios with CSS was first assessed using both the Cox regression model-based univariate and multivariate analyses applying the continuous ratios, and then in various stratifications of overall patients and the Siewert type-specific subgroups the correlation of high versus low level of each ratio in relation to survival was quantified, adjusting gender, age, tumor position, stage, and vessel invasion, with the corresponding survival curves generated. The hazard ratio (HR) estimates with the corresponding 95% CIs were reported. The 3-, 6-, 12-, 24-, 36-, and 60-month survival rate estimates together with the 95% CI for the low- and high-level group of each ratio was obtained using the Kaplan-Meier method. All statistical analyses were performed using R (v. 3.3.1, Vienna, Austria). A two-sided P value of < 0.05 was considered statistically significant.
Results
Patients’ characteristics
A total of 641 patients were initially enrolled, and 611 cases (390 Siewert type II and 221 type III) were included in final analysis based on the eligibility criteria. Based on the medians, the cut-off values of MLR, NLR, and PLR were set as 0.223, 2.22, and 124.4, respectively, and patients were divided into low- and high-level groups for further analysis. The clinicopathological characteristics of the overall and ratio-specific patient groups are presented in Table 1. The median follow-up month was 72 (interquartile, 35-98).
Table 1: Patients’ characteristics
Parameter |
Overall |
MLR ≤ 0.223 |
MLR > 0.223 |
NLR ≤ 2.22 |
NLR > 2.22 |
PLR ≤ 124.4 |
PLR > 124.4 |
n |
611 |
305 |
306 |
305 |
306 |
306 |
305 |
Gender |
|||||||
Female |
123 (20) |
72 (24) |
51 (17) |
65 (21) |
58 (19) |
53 (17) |
70 (23) |
Male |
488 (80) |
233 (76) |
255 (83) |
240 (79) |
248 (81) |
253 (83) |
235 (77) |
Age (years) |
62 ± 10; 63 (30-89) |
62 ± 9; 62 (30-80) |
63 ± 10; 64 (30-89) |
62 ± 9; 63 (30-80) |
62 ± 10; 63 (30-89) |
63 ± 9; 63 (30-80) |
62 ± 10; 63 (33-89) |
Age group |
|||||||
≤ 63 years |
321 (53) |
172 (56) |
149 (49) |
163 (53) |
158 (52) |
162 (53) |
159 (52) |
> 63 years |
290 (47) |
133 (44) |
157 (51) |
142 (47) |
148 (48) |
144 (47) |
146 (48) |
Siewert classification |
|||||||
Type II |
390 (64) |
196 (64) |
194 (63) |
202 (66) |
188 (61) |
209 (68) |
181 (59) |
Type III |
221 (36) |
109 (36) |
112 (37) |
103 (34) |
118 (39) |
97 (32) |
124 (41) |
Tumor length (cm) |
5 ± 3; 5 (1-25) |
5 ± 3; 5 (1-25) |
6 ± 3; 5 (1-20) |
5 ± 3; 5 (1-25) |
6 ± 3; 5 (1-20) |
5 ± 3; 4 (1-17) |
6 ± 3; 5 (1-25) |
Tumor length group |
|||||||
≤ 5 cm |
360 (59) |
198 (65) |
162 (53) |
195 (64) |
165 (54) |
207 (68) |
153 (50) |
> 5 cm |
251 (41) |
107 (35) |
144 (47) |
110 (36) |
141 (46) |
99 (32) |
152 (50) |
Nerve invasion |
|||||||
No |
590 (97) |
296 (97) |
294 (96) |
294 (96) |
296 (97) |
296 (97) |
294 (96) |
Yes |
21 (3) |
9 (3) |
12 (4) |
11 (4) |
10 (3) |
10 (3) |
11 (4) |
Vessel invasion |
|||||||
No |
506 (83) |
258 (85) |
248 (81) |
247 (81) |
259 (85) |
255 (83) |
251 (82) |
Yes |
107 (17) |
47 (15) |
58 (19) |
58 (19) |
47 (15) |
51 (17) |
54 (18) |
pT stage |
|||||||
1a |
27 (4) |
12 (4) |
14 (5) |
12 (4) |
15 (5) |
14 (5) |
13 (4) |
1b |
37 (6) |
25 (8) |
12 (4) |
22 (7) |
15 (5) |
25 (8) |
12 (4) |
2 |
60 (10) |
28 (9) |
32 (10) |
28 (9) |
32 (10) |
32 (10) |
28 (9) |
3 |
4 (1) |
1 (0) |
3 (1) |
2 (1) |
2 (1) |
2 (1) |
2 (1) |
4a |
361 (59) |
189 (62) |
172 (56) |
191 (63) |
170 (56) |
182 (59) |
179 (59) |
4b |
122 (20) |
49 (16) |
73 (24) |
50 (16) |
72 (24) |
51 (17) |
71 (23) |
pN stage |
|||||||
0 |
214 (35) |
114 (37) |
100 (33) |
114 (37) |
100 (33) |
118 (39) |
96 (31) |
1 |
37 (6) |
17 (6) |
20 (7) |
8 (3) |
29 (9) |
11 (4) |
26 (9) |
2 |
147 (24) |
75 (25) |
72 (24) |
84 (28) |
63 (21) |
79 (26) |
68 (22) |
3 |
213 (35) |
99 (32) |
114 (37) |
99 (32) |
114 (37) |
98 (32) |
115 (38) |
pTNM stage |
|||||||
IA |
59 (10) |
33 (11) |
26 (9) |
31 (10) |
28 (9) |
35 (11) |
24 (8) |
IB |
39 (6) |
17 (6) |
22 (7) |
18 (6) |
21 (7) |
19 (6) |
20 (7) |
IIA |
9 (1) |
7 (2) |
2 (1) |
5 (2) |
4 (1) |
5 (2) |
4 (1) |
IIB |
104 (17) |
60 (20) |
44 (14) |
59 (19) |
45 (15) |
63 (21) |
41 (13) |
IIIA |
33 (5) |
14 (5) |
19 (6) |
10 (3) |
23 (8) |
15 (5) |
18 (6) |
IIIB |
140 (23) |
68 (22) |
72 (24) |
77 (25) |
63 (21) |
65 (21) |
71 (25) |
IIIC |
227 (37) |
106 (35) |
121 (40) |
105 (34) |
122 (40) |
104 (34) |
123 (40) |
Total leucocyte count (× 109/L) |
5.8 ± 1.9; 5.5 (1.3-19.0) |
5.7 ± 1.6; 5.6 (2.6-14.4) |
6.0 ± 2.2; 5.6 (1.3-19.0) |
5.3 ± 1.4; 5.2 (1.3-9.5) |
6.4 ± 2.2; 6.0 (2.1-19.0) |
6.0 ± 1.8; 5.8 (2.0-15.5) |
5.6 ± 2.1; 5.3 (1.3-19.0) |
Lymphocyte count (× 109/L) |
1.6 ± 0.5; 1.5 (0.4-3.9) |
1.8 ± 0.5; 1.8 (0.8-3.9) |
1.3 ± 0.4; 1.3 (0.4-2.8) |
1.8 ± 0.5; 1.8 (0.4-3.9) |
1.3 ± 0.4; 1.3 (0.4-3.0) |
1.9 ± 0.5; 1.8 (0.6-3.9) |
1.3 ± 0.4; 1.3 (0.4-2.6) |
Monocyte count (× 109/L) |
0.4 ± 0.1; 0.3 (0.1-1.0) |
0.3 ± 0.1; 0.3 (0.1-0.6) |
0.4 ± 0.1; 0.4 (0.1-1.0) |
0.3 ± 0.1; 0.3 (0.1-1.0) |
0.4 ± 0.1; 0.4 (0.1-0.9) |
0.4 ± 0.1; 0.4 (0.1-0.9) |
0.3 ± 0.1; 0.3 (0.1-1.0) |
Neutrophil count (× 109/L) |
3.7 ± 1.8; 3.4 (0.7-17.6) |
3.3 ± 1.2; 3.2 (0.8-10.4) |
4.1 ± 2.1; 3.6 (0.7-17.6) |
2.9 ± 0.9; 2.9 (0.7-5.3) |
4.5 ± 2.0; 4.1 (1.3-17.6) |
3.6 ± 1.5; 3.4 (0.8-13.8) |
3.8 ± 2.0; 3.4 (0.7-17.6) |
Platelet count (× 109/L) |
197 ± 73; 187 (32-761) |
196 ± 71; 186 (65-670) |
198 ± 76; 187 (32-761) |
196 ± 65; 187 (32-405) |
199 ± 81; 187 (64-761) |
163 ± 52; 161 (32-326) |
231 ± 76; 222 (91-761) |
MLR |
0.25 ± 0.13; 0.22 (0.07-1.30) |
0.17 ± 0.03; 0.17 (0.07-0.22) |
0.33 ± 0.13; 0.30 (0.22-1.30) |
0.20 ± 0.07; 0.18 (0.07-0.72) |
0.31 ± 0.14; 0.28 (0.07-1.30) |
0.21 ± 0.09; 0.19 (0.07-0.72) |
0.29 ± 0.15; 0.26 (0.10-1.30) |
NLR |
2.2 ± 2.7; 2.5 (0.4-28.6) |
1.9 ± 0.7; 1.7 (0.4-4.7) |
3.5 ± 3.3; 2.8 (0.7-28.6) |
1.6 ± 0.4; 1.7 (0.4-2.2) |
3.8 ± 3.2; 3.0 (2.2-28.6) |
2.1 ± 1.1; 1.9 (0.4-15.7) |
3.4 ± 3.3; 2.7 (0.7-28.6) |
PLR |
124 ± 139; 88 (35-1585) |
113 ± 47; 104 (35-328) |
165 ± 109; 151 (44-1585) |
114 ± 49; 105 (35-398) |
165 ± 108; 149 (43-1585) |
90 ± 21; 92 (35-124) |
189 ± 100; 171 (125-1585) |
Enumeration data are shown as n (percentage [%]), and measurement data as mean ± standard deviation; median (range).
Abbreviations: MLR, monocyte-lymphcyte ratio; NLR, neutrophil-lymphocyte ratio; PLR, platelet-lymphocyte ratio.
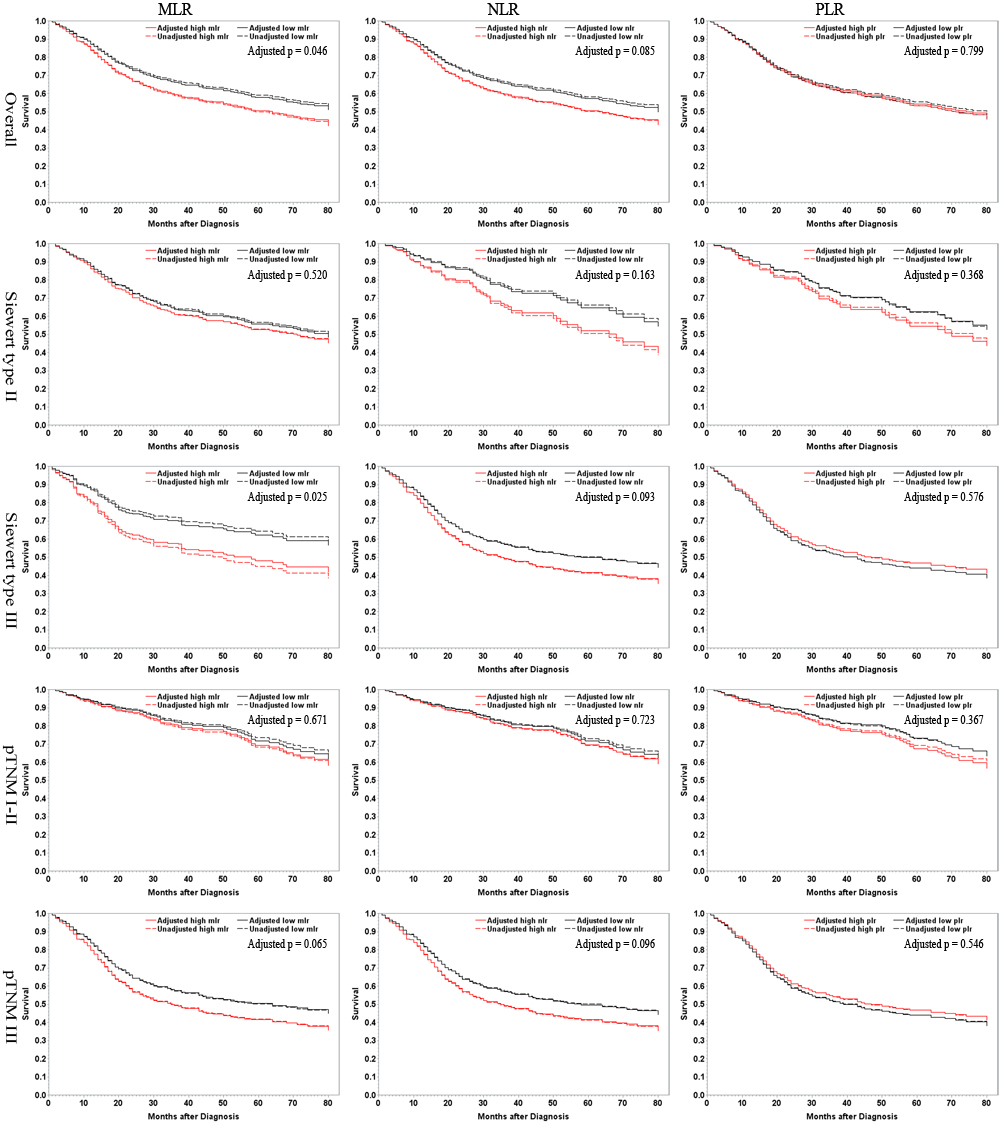
Figure 1: High- versus low-level MLR, NLR and PLR in relation to AEG-specific survival among overall patients and in tumor position- and stage-specific subgroups. Dashed lines are for unadjusted results, and solid lines represent adjusted outcomes. Factors for adjustment include gender, age, tumor position, stage, and vessel invasion. MLR, monocyte-lymphocyte ratio; NLR, neutrophil-lymphocyte ratio; PLR, platelet-lymphocyte ratio.
MLR, NLR and PLR in relation to clinicopathological features
The association is shown in Table 2. In overall patients, MLR was significantly higher in male patients and those older than 63 years; NLR was insignificantly higher in those with type III tumors; and PLR was significantly elevated in people with type III tumors. In patients with type II tumors, MLR was insignificantly higher in those > 63 years, while no significant observations were observed for NLR and PLR.
Table 2: Association of preoperative monocyte-lymphocyte, neutrophil-lymphocyte and platelet-lymphocyte ratios with clinicopathological parameters in overall patients and those with Siewert types II and III adenocarcinoma of esophagogastric junction
Parameter |
MLRa |
NLRb |
PLRc |
|||||||
Overall |
Siewert type II |
Siewert type III |
Overall |
Siewert type II |
Siewert type III |
Overall |
Siewert type II |
Siewert type III |
||
Gender |
Female |
1 (reference) |
1 (reference) |
1 (reference) |
1 (reference) |
1 (reference) |
1 (reference) |
1 (reference) |
1 (reference) |
1 (reference) |
Male |
1.51 (1.00-2.27) |
1.38 (0.80-2.38) |
1.69 (0.89-3.22) |
1.16 (0.77-1.73) |
1.23 (0.71-2.11) |
1.10 (0.58-2.09) |
0.70 (0.46-1.05) |
0.66 (0.38-1.14) |
0.72 (0.38-1.37) |
|
Age group |
≤ 63 years |
1 (reference) |
1 (reference) |
1 (reference) |
1 (reference) |
1 (reference) |
1 (reference) |
1 (reference) |
1 (reference) |
1 (reference) |
> 63 years |
1.38 (1.00-1.91) |
1.36 (0.91-2.04) |
1.45 (0.83-2.53) |
1.13 (0.82-1.57) |
1.14 (0.76-1.71) |
1.16 (0.66-2.02) |
1.09 (0.79-1.52) |
1.07 (0.71-1.60) |
1.15 (0.66-2.00) |
|
Siewert classification |
Type II |
1 (reference) |
NA |
NA |
1 (reference) |
NA |
NA |
1 (reference) |
NA |
NA |
Type III |
1.12 (0.79-1.57) |
NA |
NA |
1.28 (0.92-1.80) |
NA |
NA |
1.48 (1.06-2.09) |
NA |
NA |
|
Nerve invasion |
No |
1 (reference) |
1 (reference) |
1 (reference) |
1 (reference) |
1 (reference) |
1 (reference) |
1 (reference) |
1 (reference) |
1 (reference) |
Yes |
1.30 (0.53-3.22) |
2.21 (0.55-8.89) |
0.93 (0.26-3.33) |
1.01 (0.41-2.48) |
1.87 (0.51-6.90) |
0.53 (0.14-1.93) |
1.10 (0.45-2.71) |
1.25 (0.35-4.50) |
0.98 (0.28-3.52) |
|
Vessel invasion |
No |
1 (reference) |
1 (reference) |
1 (reference) |
1 (reference) |
1 (reference) |
1 (reference) |
1 (reference) |
1 (reference) |
1 (reference) |
Yes |
1.15 (0.74-1.78) |
1.38 (0.79-2.42) |
0.83 (0.40-1.74) |
0.71 (0.46-1.11) |
0.64 (0.36-1.12) |
0.85 (0.40-1.78) |
0.94 (0.60-1.46) |
0.91 (0.52-1.59) |
0.98 (0.47-2.03) |
|
pTNM stage |
I |
1 (reference) |
1 (reference) |
1 (reference) |
1 (reference) |
1 (reference) |
1 (reference) |
1 (reference) |
1 (reference) |
1 (reference) |
II |
0.73 (0.42-1.26) |
0.60 (0.30-1.20) |
0.98 (0.39-2.51) |
0.76 (0.44-1.32) |
0.58 (0.29-1.17) |
1.45 (0.57-3.71) |
0.74 (0.43-1.30) |
0.77 (0.38-1.57) |
0.66 (0.26-1.67) |
|
III |
1.06 (0.67-1.69) |
0.99 (0.56-1.72) |
1.23 (0.54-2.77) |
1.06 (0.67-1.68) |
0.82 (0.47-1.44) |
1.90 (0.83-4.33) |
1.34 (0.85-2.14) |
1.52 (0.86-2.67) |
1.05 (0.46-2.37) |
|
Risk ratios (RRs) of high to low level of each ratio for overall patients with adenocarcinoma of esophagogastric junction, those with type II tumors, and those with stage III cancers by clinicopathological characteristics are shown as point estimate (95% confidence interval) with respect to a reference group (defined as 1). RRs were calculated using the multiple Logistic regression model adjusting gender, age group, tumor location, nerve and vessel invasion, nodule formation, and pTNM stage. Statistically significant point estimates are shown in bold. aMLR > 0.223 vs. MLR ≤ 0.223; bNLR > 2.22 vs. NLR ≤ 2.22; cPLR > 124.4 vs. PLR ≤ 124.4
Abbreviations: MLR, monocyte-lymphocyte ratio; NLR, neutrophil-lymphocyte ratio; PLR, platelet-lymphocyte ratio; NA, not applicable.
MLR, NLR and PLR in relation to CSS
Based on univariate analysis, advanced pTNM stage, higher MLR and NLR were significantly associated with a higher death risk; after incorporating various factors in the Cox proportional hazards model-based multivariate analysis, pTNM stage was revealed to be an independent prognostic factor, and MLR tended to be independently associated with CSS, although insignificantly. No associated was found for PLR. (Table 3)
Table 3: Univariate and multivariate analyses of monocyte-lymphocyte, neutrophil-lymphocyte and platelet-lymphocyte ratios in relation to adenocarcinoma of esophagogastric junction-specific survival
Parameter |
Univariate analysis |
Multivariate analysis |
Gender |
1.11 (0.82-1.49) |
1.07 (0.79-1.45) |
Age (years) |
1.01 (0.99-1.02) |
1.01 (0.99-1.02) |
Siewert classification |
1.07 (0.84-1.37) |
1.11 (0.86-1.43) |
Nerve invasion |
0.96 (0.48-1.95) |
0.94 (0.46-1.92) |
Vessel invasion |
1.09 (0.80-1.49) |
0.82 (0.60-1.12) |
pTNM stage |
1.98 (1.63-2.42) |
1.96 (1.60-2.41) |
Monocyte-lymphocyte ratio |
3.00 (1.36-6.63) |
2.68 (0.85-8.43)a |
Neutrophil-lymphocyte ratio |
1.04 (1.00-1.08) |
1.00 (0.94-1.07) |
Platelet-lymphocyte ratio |
1.00 (1.00-1.00) |
1.00 (1.00-1.00) |
Data are shown as hazard ratio (95% confidence interval). Statistically significant point estimates are shown in bold.
Continuous ratios were applied.
aP = 0.092
Stratified analyses were further conducted. Overall, MLR was significantly associated with a higher postsurgical death risk in male patients, those ≤ 63 years, those with type II tumors, and a tendency was observed in those without vessel invasion and those with stage III tumors; NLR was significantly associated with a higher death risk in female patients, those with type III tumors, and those with vessel invasion, and a tendency was detected in those > 63 years, and those with stage III tumors. In Siewert type II tumors, tendencies were observed in those ≤ 63 years for MLR. In type III AEG, significant associations were detected in male patients, those with type III tumors, those with vessel invasion, and those with stage III tumors for MLR, and in both genders, those > 63 years, those with and without vessel involvement, and those with stage III tumors for NLR. For PLR, a significant association was only observed in older people with type III cancers. (Table 4)
Table 4: MLR, NLR and PLR in relation to AEG-specific survival in various stratifications of overall patients and those with types II and III AEG
Parameter |
MLRa |
NLRb |
PLRc |
||||||
Overall |
Siewert type II |
Siewert type III |
Overall |
Siewert type II |
Siewert type III |
Overall |
Siewert type II |
Siewert type III |
|
Used no. |
611 |
390 |
221 |
611 |
390 |
221 |
611 |
390 |
221 |
Comprehensive |
1.26 (0.99-1.59) |
1.06 (0.79-1.43) |
1.69 (1.13-2.54) |
1.26 (1.00-1.60) |
1.03 (0.77-1.39) |
1.84 (1.22-2.78) |
0.99 (0.78-1.25) |
0.87 (0.64-1.17) |
1.27 (0.85-1.91) |
Gender |
|||||||||
Female |
1.03 (0.59-1.80) |
0.59 (0.27-1.33) |
1.42 (0.61-3.29) |
1.96 (1.08-3.53) |
1.41 (0.64-3.10) |
2.93 (1.03-8.31) |
1.03 (0.58-1.80) |
0.79 (0.38-1.67) |
1.25 (0.52-3.03) |
Male |
1.33 (1.02-1.73) |
1.18 (0.85-1.63) |
1.71 (1.07-2.75) |
1.16 (0.90-1.51) |
0.98 (0.71-1.35) |
1.69 (1.06-2.70) |
0.98 (0.75-1.27) |
0.86 (0.62-1.19) |
1.33 (0.84-2.11) |
Age group |
|||||||||
≤ 63 years |
1.55 (1.11-2.16) |
1.54 (1.00-2.37) |
1.57 (0.93-2.67) |
1.17 (0.84-1.63) |
1.10 (0.71-1.69) |
1.28 (0.75-2.17) |
0.94 (0.68-1.31) |
0.92 (0.60-1.42) |
1.03 (0.61-1.74) |
> 63 years |
0.98 (0.70-1.37) |
0.74 (0.49-1.12) |
1.74 (0.91-3.33) |
1.32 (0.94-1.85) |
0.93 (0.62-1.41) |
2.94 (1.46-5.89) |
1.08 (0.77-1.53) |
0.84 (0.56-1.27) |
1.99 (1.02-3.87) |
Siewert classification |
|||||||||
Type II |
1.06 (0.79-1.43) |
1.06 (0.79-1.43) |
NA |
1.03 (0.77-1.39) |
1.03 (0.77-1.39) |
NA |
0.87 (0.64-1.17) |
0.87 (0.64-1.17) |
NA |
Type III |
1.69 (1.13-2.54) |
NA |
1.69 (1.13-2.54) |
1.84 (1.22-2.78) |
NA |
1.84 (1.22-2.78) |
1.27 (0.85-1.91) |
NA |
1.27 (0.85-1.91) |
Vessel invasion |
|||||||||
No |
1.23 (0.95-1.60) |
1.11 (0.80-1.53) |
1.49 (0.96-2.32) |
1.17 (0.91-1.52) |
0.96 (0.69-1.33) |
1.70 (1.09-2.67) |
0.90 (0.67-1.17) |
0.80 (0.57-1.11) |
1.12 (0.72-1.74) |
Yes |
1.49 (0.80-2.78) |
0.95 (0.46-1.97) |
3.50 (1.06-11.51) |
2.08 (1.14-3.80) |
1.58 (0.75-3.32) |
5.11 (1.24-21.16) |
1.60 (0.90-2.84) |
1.26 (0.62-2.55) |
2.94 (0.90-9.64) |
pTNM stage |
|||||||||
I |
1.44 (0.52-3.95) |
0.66 (0.20-2.10) |
NA |
0.67 (0.25-1.82) |
0.82 (0.26-2.58) |
0.32 (0.03-3.72) |
1.60 (0.58-4.43) |
1.60 (0.51-5.02) |
1.03 (0.08-12.78) |
II |
1.13 (0.62-2.08) |
1.06 (0.51-2.23) |
1.00 (0.33-2.99) |
1.58 (0.87-2.87) |
1.75 (0.85-3.63) |
1.27 (0.45-3.62) |
1.35 (0.75-2.44) |
1.16 (0.55-2.45) |
1.64 (0.57-4.68) |
III |
1.27 (0.97-1.67) |
1.10 (0.78-1.55) |
1.58 (1.01-2.47) |
1.26 (0.96-1.65) |
0.95 (0.68-1.34) |
2.03 (1.27-3.25) |
0.92 (0.70-1.20) |
0.79 (0.56-1.10) |
1.18 (0.75-1.84) |
Hazard ratios (HRs) of high versus low level of each ratio are presented as point estimate (95% confidence interval) after adjustment of gender, age group, tumor position, vessel invasion, and pTNM stage in each stratification by clinicopathological parameters of the overall patients, patients with type II tumors, and those with type III cancers. HRs were calculated using the multiple Cox regression model with adjustment, and are statistically significant when shown in bold. aMLR > 0.223 vs. MLR ≤ 0.223; bNLR > 2.22 vs. NLR ≤ 2.22; xPLR > 124.4 vs. PLR ≤ 124.4 Abbreviations: MLR, monocyte-lymphocyte ratio; NLR, neutrophil-lymphocyte ratio; PLR, platelet-lymphocyte ratio; NA, not applicable.
Accordingly and consistently, the unadjusted and adjusted survival curves for the overall, tumor position- and stage- specific patient groups are show in Figure 1, and the periodical survival rates in the low- and high-level arms of the 3 ratios are listed in Table 5. Upon 5-year period, in the overall patients, 58% of patients survived in the low-MLR group compared to 50% in the high-level group, 57% survived in the low-NLR group compared to 52% in the high-level group, and 55% survived in the low-PLR group compared to 54% in the high-level group; in those with type II tumors, 56% of people survived in the low-MLR group compared to 53% in the high-level group, 53% survived in the low-NLR group compared to 56% in the high-level group, and 54% survived in the low-PLR group compared to 55% in the high-level group; in those with type III tumors, 62% of individuals survived in the low-MLR group compared to 46% in the high-level group, 64% survived in the low-NLR group compared to 44% in the high-level group, and 54% survived in the low-PLR group compared to 52% in the high-level group.
Table 5: Unadjusted survival rates for overall patients and those with types II and III AEG
Time |
Level |
MLRa |
NLRb |
PLRc |
||||||
Overall |
Siewert type II |
Siewert type III |
Overall |
Siewert type II |
Siewert type III |
Overall |
Siewert type II |
Siewert type III |
||
3-month |
Low |
98.3 (96.0-99.3) |
99.0 (95.9-99.7) |
97.1 (91.2-99.1) |
98.7 (96.5-99.5) |
98.5 (95.5-99.5) |
99.0 (93.3-99.9) |
98.4 (96.1-99.3) |
98.1 (95.0-99.3) |
99.0 (92.9-99.9) |
High |
95.9 (93.0-97.6) |
96.5 (92.8-98.3) |
94.9 (89.0-97.7) |
97.7 (95.3-98.9) |
98.9 (95.8-98.7) |
95.8 (90.1-98.2) |
98.0 (95.7-99.1) |
99.4 (96.1-99.9) |
96.0 (90.6-98.3) |
|
6-month |
Low |
95.9 (92.9-97.7) |
97.4 (93.8-98.9) |
93.2 (86.3-96.7) |
96.4 (93.6-98.0) |
96.5 (92.5-99.3) |
96.1 (90.0-98.5) |
95.1 (92.0-97.0) |
94.7 (90.7-97.1) |
95.9 (89.4-98.4) |
High |
91.5 (87.8-94.1) |
90.5 (85.4-93.8) |
93.2 (86.9-96.6) |
93.5 (90.1-95.7) |
94.1 (89.7-96.7) |
92.4 (85.9-96.0) |
94.8 (91.6-96.8) |
96.1 (92.1-98.1) |
92.7 (86.5-96.2) |
|
12-month |
Low |
88.4 (84.2-91.6) |
90.1 (84.8-93.5) |
85.4 (77.0-91.0) |
91.1 (87.4-93.8) |
90.6 (85.7-93.9) |
92.2 (85.1-96.0) |
87.9 (83.7-91.1) |
88.5 (83.4-92.2) |
86.6 (78.0-92.0) |
High |
83.0 (78.4-86.7) |
83.9 (78.0-88.3) |
81.4 (73.1-87.3) |
83.7 (79.0-87.4) |
87.2 (81.6-91.3) |
78.0 (69.4-86.4) |
86.9 (82.6-90.2) |
89.5 (84.0-93.2) |
83.1 (75.2-88.6) |
|
24-month |
Low |
73.5 (68.0-78.1) |
72.8 (65.9-78.5) |
74.8 (65.2-82.1) |
74.4 (69.1-78.9) |
72.8 (66.1-78.4) |
77.7 (68.3-84.6) |
72.9 (67.5-77.5) |
73.7 (67.2-79.1) |
71.1 (61.0-79.1) |
High |
66.2 (60.8-71.1) |
69.8 (63.0-75.7) |
60.2 (50.8-68.4) |
67.6 (62.1-72.6) |
73.4 (66.5-79.1) |
58.5 (49.0-66.8) |
69.2 (63.7-74.0) |
72.4 (65.2-78.3) |
64.5 (55.4-72.2) |
|
36-month |
Low |
65.6 (60.0-70.8) |
62.8 (59.6-65.2) |
70.9 (61.1-78.6) |
65.6 (60.0-70.6) |
61.4 (54.3-67.7) |
73.8 (64.2-81.2) |
64.4 (58.7-69.5) |
63.2 (56.2-69.3) |
67.0 (56.7-75.4) |
High |
59.9 (54.3-65.1) |
62.3 (55.2-68.6) |
55.9 (46.5-64.3) |
60.8 (55.1-66.0) |
65.4 (58.2-71.7) |
53.4 (44.0-61.9) |
62.0 (56.3-67.1) |
63.5 (56.1-70.1) |
59.7 (50.5-67.7) |
|
60-month |
Low |
58.4 (52.2-64.1) |
56.2 (48.6-63.1) |
62.3 (50.5-72.1) |
56.7 (50.5-62.5) |
53.4 (65.9-40.3) |
64.2 (52.8-73.5) |
54.5 (48.3-60.4) |
54.2 (46.9-60.9) |
53.8 (40.3-65.6) |
High |
50.1 (44.0-55.8) |
52.9 (45.2-60.1) |
45.6 (35.6-55.0) |
51.5 (45.3-57.3) |
56.0 (48.2-63.0) |
44.3 (34.3-53.8) |
53.6 (47.5-59.3) |
55.1 (47.1-62.4) |
51.7 (42.1-60.4) |
|
Data are shown as point estimate (95% confidence interval).
aLow level: ≤ 0.223, high level: > 0.223; blow level: ≤ 2.22, high level: > 2.22; clow level: PLR ≤ 124.4, high level: PLR > 124.4
Abbreviations: MLR, monocyte-lymphocyte ratio; NLR, neutrophil-lymphocyte ratio; PLR, platelet-lymphocyte ratio.
Discussion
Systemic inflammation correlates with tumor progression. Various peripheral inflammatory markers including MLR, NLR and PLR and their prediction of clinical outcomes in diverse tumor entities have been uncovered [9]. These biomarkers also predictive of responses to immunotherapies remain an area of unmet need. In this study, we examined a large prospective cohort of patients with type II/III AEG, and investigated the clinicopathological and prognostic significances of preoperative MLR, NLR, and PLR as markers predicting the outcomes after radical gastrectomy. To the best of our knowledge, few previous studies [15, 16] assessing the ratios in AEG have been reported, and both found a significant association of pretreatment NLR with prognosis in AEG patients. The prognostic significances of the ratios were also reported in gastric cancer [17] and esophageal cancer [18-21], which however might differ greatly in etiology, origin, tumor biology, histology, and prognosis from type II/III AEG, which might be considered as an independent cancer type [6, 22], making the findings in the 2 cancer entities potentially inapplicable in AEG. Regarding NLR in AEG, our results were consistent with the previous overall findings [15, 16], and we had more detailed subgroup analyses with longer follow-up period. Besides, we further investigated MLR and PLR, and showed that both MLR and NLR were prognosis-indicative in type III but not type II AEG, while PLR had very limited significance.
Lymphocytes play essential roles in systemic inflammatory response to tumorous diseases, including the inhibition of tumor cell proliferation and migration [23]. Lymphocytes infiltrating to tumor microenvironment could trigger immunological antitumor reactions. Lymphocyte interaction with other inflammation cells could be essential in the anti-tumor reaction of the immune system (e.g., by inducing tumor cell apoptosis) [24]. Decreased lymphocyte count could reflect insufficient immunologic reaction to tumor, with enhanced tumor proliferation and metastasis [25]. Lymphopenia is a powerful predictor of clinical outcomes in hematologic and solid malignancies [26]. Lymphopenia prior to initiation of systematic treatment is a poor risk feature in cancer patients who have been treated with neoadjuvant therapy [27]. Lymphopenia might impair the efficacy of immune system by impairing antibody-dependent cell-mediated cytotoxicity, which plays important roles in slowing or preventing tumor progression and distant metastasis, due to lack of effector cells. Due to its definite role in tumor immunity, lymphocyte count was applied as the standard in the 3 ratios.
The role of monocytes/macrophages in tumor progression is essential [28]. There is increasing evidence that tumor-associated macrophages (TAMs), which are derived from circulating monocytes, suppress the host immune system and promote tumor angiogenesis, proliferation, migration, and metastasis [29]. There is a pro-tumorous potential of monocytes via formation of different malignancy-promoting macrophage phenotypes. High peripheral absolute monocyte count indicates formation of TAMs and elevated tumor burden in patients. Accordingly, peripheral blood monocytosis is an adverse prognostic factor in various tumors [30, 31]. MLR might be well reflective of responsiveness of the host immune system and a microenvironment surrogate marker of tumor burden. In various hematologic malignancies [32, 33] and solid tumors [31, 34-40] including lung cancer, bladder cancer, breast cancer, oropharyngeal cancer, pancreatic adenocarcinoma, colorectal cancer and renal cell carcinoma, high pre-treatment peripheral MLR level is significantly unfavorable and represents a useful outcome-predictive marker. The prognostic values of MLR in AEG patients remain uncertain. Based on our prospective cohort, MLR was higher in male patients and older individuals; it tended to be an independent prognostic factor, and increased MLR was associated with poorer CSS in male patients, younger people, those with type III tumors, and those with stage III tumors. MLR thus provides an easily-available and low-cost prognostic biomarker. Interestingly and notably, there existed gender-, age-, tumor position- and stage-specific association between MLR and survival. Type III AEG might be more similar to gastric cancer, for which MLR has been revealed to be prognostically significant [39]. Immunoediting occurs with tumor progression [41]. The observation that MLR tended to be prognosis-predictive in stage III tumors might be explained by the fact that pro-tumorous immune cells including Mψ are activated at advanced stages to facilitate the latter metastatic progression. The gender and age discrepancies might be determined by physiological characteristics.
High neutrophil proportion in tumor stroma is associated with poor prognoses [42, 43]. Neutrophils enhance tumor progression by inducting mutation of cancer suppressive genes, secreting enzymes and cytokines to facilitate malignant cell proliferation and metastasis, and promoting tumor angiogenesis [44, 45]. NLR has been validated as a prognostic biomarker in patients in various cancers, identifying patients whose tumors are generating inflammatory responses [46, 47]. There is scope for further investigation of NLR as a predictive biomarker of response to immunotherapies, particularly with immune checkpoint-targeting drugs like PD-1/PDL-1 and CTLA-4 targeting antibodies [48, 49], and the utility of NLR normalization within treatment. We observed that NLR was higher in patients with type II AEG. It was prognosis-predictive in females, older patients, those with type III tumors, and those with stage III tumors. The phenomenon that the significance occurred with the advancement of tumor stage could be partly explained by that at later stages, tumor cells secrete chemokines guiding neutrophils into tumor microenvironment, with peripheral neutrophil proliferation activated, which could conversely suppress lymphocytes [50]. In gastric cancer, correlation between NLR and tumor progression was also reported [11].
The only significant findings concerning PLR were that it was higher in patients with type III tumors, and that its elevation was associated with worse CSS only in older patients with type III AEG, although its prognostic significance has been reported in various other cancer entities [51-53]. The difference might partly lie in the fact that many other researches did not adjust confounding factors sufficiently like the way we did, which could reveal the true association.
The strengths of this study include but are not limited to the prospective nature, the large sample size, the long follow-up period, the application of CSS in survival analysis, and the appropriate and rigorous methodology. However, there are some potential limitations. Firstly, other potential confounding factors including comorbidities that might affect the blood cell count were not considered. Besides, there might be other reasonable cut-off levels for each ratio.
Together, this large prospective evidence showed that MLR and NLR might be potential prognostic factors in patients with non-metastatic Siewert type II/III AEG, especially in those with type III and stage III tumors, while PLR had limited significance.
Acknowledgments
We would like to most sincerely thank the reviewers and editors for their thoughtful and constructive comments and suggestions.
Funding
This work was supported by the National Natural Science Foundation of China (No.: 81572350, to Prof. A-Man Xu). The funder played no role in study design, data collection and analysis, decision to publish, or preparation of the manuscript.
CONFLICTS OF INTEREST
All authors declare no conflicts of interest.
Ethics statement
Refer to the main text.
References
1. Torre LA, Bray F, Siegel RL, Ferlay J, Lortet-Tieulent J, Jemal A. Global cancer statistics, 2012. CA Cancer J Clin. 2015; 65:87-108.
2. Global Burden of Disease Cancer C, Fitzmaurice C, Dicker D, Pain A, Hamavid H, Moradi-Lakeh M, MacIntyre MF, Allen C, Hansen G, Woodbrook R, Wolfe C, Hamadeh RR, Moore A, et al. The Global Burden of Cancer 2013. JAMA Oncol. 2015; 1:505-527.
3. Chen W, Zheng R, Baade PD, Zhang S, Zeng H, Bray F, Jemal A, Yu XQ, He J. Cancer statistics in China, 2015. CA Cancer J Clin. 2016.
4. Siewert JR, Stein HJ. Classification of adenocarcinoma of the oesophagogastric junction. The British journal of surgery. 1998; 85:1457-1459.
5. Schmidt T, Sicic L, Blank S, Becker K, Weichert W, Bruckner T, Parakonthun T, Langer R, Buchler MW, Siewert JR, Lordick F, Ott K. Prognostic value of histopathological regression in 850 neoadjuvantly treated oesophagogastric adenocarcinomas. British journal of cancer. 2014; 110:1712-1720.
6. Huang L, Xu AM. Adenocarcinoma of esophagogastric junction: controversial classification, surgical management, and clinicopathology. Chinese journal of cancer research. Chung-kuo yen cheng yen chiu. 2014; 26:226-230.
7. Mantovani A, Allavena P, Sica A, Balkwill F. Cancer-related inflammation. Nature. 2008; 454:436-444.
8. Yodying H, Matsuda A, Miyashita M, Matsumoto S, Sakurazawa N, Yamada M, Uchida E. Prognostic Significance of Neutrophil-to-Lymphocyte Ratio and Platelet-to-Lymphocyte Ratio in Oncologic Outcomes of Esophageal Cancer: A Systematic Review and Meta-analysis. Annals of surgical oncology. 2016; 23:646-654.
9. Absenger G, Szkandera J, Pichler M, Stotz M, Arminger F, Weissmueller M, Schaberl-Moser R, Samonigg H, Stojakovic T, Gerger A. A derived neutrophil to lymphocyte ratio predicts clinical outcome in stage II and III colon cancer patients. British journal of cancer. 2013; 109:395-400.
10. Koh CH, Bhoo-Pathy N, Ng KL, Jabir RS, Tan GH, See MH, Jamaris S, Taib NA. Utility of pre-treatment neutrophil-lymphocyte ratio and platelet-lymphocyte ratio as prognostic factors in breast cancer. British journal of cancer. 2015; 113:150-158.
11. Xu AM, Huang L, Zhu L, Wei ZJ. Significance of peripheral neutrophil-lymphocyte ratio among gastric cancer patients and construction of a treatment-predictive model: a study based on 1131 cases. American journal of cancer research. 2014; 4:189-195.
12. World Medical Association. World Medical Association Declaration of Helsinki: ethical principles for medical research involving human subjects. JAMA. 2013; 310:2191-2194.
13. Grimes DA, Hubacher D, Nanda K, Schulz KF, Moher D, Altman DG. The Good Clinical Practice guideline: a bronze standard for clinical research. Lancet. 2005; 366:172-174.
14. Washington K. 7th edition of the AJCC cancer staging manual: stomach. Annals of surgical oncology. 2010; 17:3077-3079.
15. Wang SC, Chou JF, Strong VE, Brennan MF, Capanu M, Coit DG. Pretreatment Neutrophil to Lymphocyte Ratio Independently Predicts Disease-specific Survival in Resectable Gastroesophageal Junction and Gastric Adenocarcinoma. Annals of surgery. 2016; 263:292-297.
16. Yuan D, Zhu K, Li K, Yan R, Jia Y, Dang C. The preoperative neutrophil-lymphocyte ratio predicts recurrence and survival among patients undergoing R0 resections of adenocarcinomas of the esophagogastric junction. Journal of surgical oncology. 2014; 110:333-340.
17. Shimada H, Takiguchi N, Kainuma O, Soda H, Ikeda A, Cho A, Miyazaki A, Gunji H, Yamamoto H, Nagata M. High preoperative neutrophil-lymphocyte ratio predicts poor survival in patients with gastric cancer. Gastric cancer. 2010; 13:170-176.
18. Han LH, Jia YB, Song QX, Wang JB, Wang NN, Cheng YF. Prognostic significance of preoperative lymphocyte-monocyte ratio in patients with resectable esophageal squamous cell carcinoma. Asian Pacific journal of cancer prevention. 2015; 16:2245-2250.
19. Sharaiha RZ, Halazun KJ, Mirza F, Port JL, Lee PC, Neugut AI, Altorki NK, Abrams JA. Elevated preoperative neutrophil:lymphocyte ratio as a predictor of postoperative disease recurrence in esophageal cancer. Annals of surgical oncology. 2011; 18:3362-3369.
20. Feng JF, Huang Y, Chen QX. Preoperative platelet lymphocyte ratio (PLR) is superior to neutrophil lymphocyte ratio (NLR) as a predictive factor in patients with esophageal squamous cell carcinoma. World journal of surgical oncology. 2014; 12:58.
21. Rashid F, Waraich N, Bhatti I, Saha S, Khan RN, Ahmed J, Leeder PC, Larvin M, Iftikhar SY. A pre-operative elevated neutrophil: lymphocyte ratio does not predict survival from oesophageal cancer resection. World journal of surgical oncology. 2010; 8:1.
22. Takeuchi H, Kitagawa Y. Adenocarcinoma of the esophagogastric junction: territory of the esophagus or stomach, or an independent region? Annals of surgical oncology. 2013; 20:705-706.
23. Terzic J, Grivennikov S, Karin E, Karin M. Inflammation and colon cancer. Gastroenterology. 2010; 138:2101-2114 e2105.
24. Zikos TA, Donnenberg AD, Landreneau RJ, Luketich JD, Donnenberg VS. Lung T-cell subset composition at the time of surgical resection is a prognostic indicator in non-small cell lung cancer. Cancer immunology, immunotherapy. 2011; 60:819-827.
25. Stotz M, Pichler M, Absenger G, Szkandera J, Arminger F, Schaberl-Moser R, Samonigg H, Stojakovic T, Gerger A. The preoperative lymphocyte to monocyte ratio predicts clinical outcome in patients with stage III colon cancer. British journal of cancer. 2014; 110:435-440.
26. Ray-Coquard I, Cropet C, Van Glabbeke M, Sebban C, Le Cesne A, Judson I, Tredan O, Verweij J, Biron P, Labidi I, Guastalla JP, Bachelot T, Perol D, et al. Lymphopenia as a prognostic factor for overall survival in advanced carcinomas, sarcomas, and lymphomas. Cancer research. 2009; 69:5383-5391.
27. Krauthamer M, Rouvinov K, Ariad S, Man S, Walfish S, Pinsk I, Sztarker I, Charkovsky T, Lavrenkov K. A study of inflammation-based predictors of tumor response to neoadjuvant chemoradiotherapy for locally advanced rectal cancer. Oncology. 2013; 85:27-32.
28. Evani SJ, Prabhu RG, Gnanaruban V, Finol EA, Ramasubramanian AK. Monocytes mediate metastatic breast tumor cell adhesion to endothelium under flow. FASEB journal. 2013; 27:3017-3029.
29. Condeelis J, Pollard JW. Macrophages: obligate partners for tumor cell migration, invasion, and metastasis. Cell. 2006; 124:263-266.
30. Nitta H, Terui Y, Yokoyama M, Mishima Y, Nishimura N, Ueda K, Kusano Y, Tsuyama N, Takeuchi K, Kanda Y, Hatake K. Absolute peripheral monocyte count at diagnosis predicts central nervous system relapse in diffuse large B-cell lymphoma. Haematologica. 2015; 100:87-90.
31. Huang SH, Waldron JN, Milosevic M, Shen X, Ringash J, Su J, Tong L, Perez-Ordonez B, Weinreb I, Bayley AJ, Kim J, Hope A, Cho BC, et al. Prognostic value of pretreatment circulating neutrophils, monocytes, and lymphocytes in oropharyngeal cancer stratified by human papillomavirus status. Cancer. 2015; 121:545-555.
32. Li YL, Pan YY, Jiao Y, Ning J, Fan YG, Zhai ZM. Peripheral blood lymphocyte/monocyte ratio predicts outcome for patients with diffuse large B cell lymphoma after standard first-line regimens. Annals of hematology. 2014; 93:617-626.
33. Koh YW, Shin SJ, Park C, Yoon DH, Suh C, Huh J. Absolute monocyte count predicts overall survival in mantle cell lymphomas: correlation with tumour-associated macrophages. Hematol Oncol. 2014; 32:178-186.
34. Szkandera J, Gerger A, Liegl-Atzwanger B, Absenger G, Stotz M, Friesenbichler J, Trajanoski S, Stojakovic T, Eberhard K, Leithner A, Pichler M. The lymphocyte/monocyte ratio predicts poor clinical outcome and improves the predictive accuracy in patients with soft tissue sarcomas. International journal of cancer. 2014; 135:362-370.
35. Li J, Jiang R, Liu WS, Liu Q, Xu M, Feng QS, Chen LZ, Bei JX, Chen MY, Zeng YX. A large cohort study reveals the association of elevated peripheral blood lymphocyte-to-monocyte ratio with favorable prognosis in nasopharyngeal carcinoma. PloS one. 2013; 8:e83069.
36. Hu P, Shen H, Wang G, Zhang P, Liu Q, Du J. Prognostic significance of systemic inflammation-based lymphocyte- monocyte ratio in patients with lung cancer: based on a large cohort study. PloS one. 2014; 9:e108062.
37. Temraz S, Mukherji D, Farhat ZA, Nasr R, Charafeddine M, Shahait M, Wehbe MR, Ghaida RA, Gheida IA, Shamseddine A. Preoperative lymphocyte-to-monocyte ratio predicts clinical outcome in patients undergoing radical cystectomy for transitional cell carcinoma of the bladder: a retrospective analysis. BMC Urol. 2014; 14:76.
38. Fujiwara Y, Misawa T, Shiba H, Shirai Y, Iwase R, Haruki K, Furukawa K, Futagawa Y, Yanaga K. Postoperative peripheral absolute blood lymphocyte-to-monocyte ratio predicts therapeutic outcome after pancreatic resection in patients with pancreatic adenocarcinoma. Anticancer research. 2014; 34:5163-5168.
39. Zhou X, Du Y, Xu J, Huang Z, Qiu T, Wang X, Qian J, Zhu W, Liu P. The preoperative lymphocyte to monocyte ratio predicts clinical outcomes in patients with stage II/III gastric cancer. Tumour biology. 2014; 35:11659-11666.
40. Lin GN, Peng JW, Liu DY, Xiao JJ, Chen YQ, Chen XQ. Increased lymphocyte to monocyte ratio is associated with better prognosis in patients with newly diagnosed metastatic nasopharyngeal carcinoma receiving chemotherapy. Tumour biology. 2014; 35:10849-10854.
41. Schreiber RD, Old LJ, Smyth MJ. Cancer immunoediting: integrating immunity’s roles in cancer suppression and promotion. Science. 2011; 331:1565-1570.
42. Galon J, Costes A, Sanchez-Cabo F, Kirilovsky A, Mlecnik B, Lagorce-Pages C, Tosolini M, Camus M, Berger A, Wind P, Zinzindohoue F, Bruneval P, Cugnenc PH, et al. Type, density, and location of immune cells within human colorectal tumors predict clinical outcome. Science. 2006; 313:1960-1964.
43. Kuang DM, Zhao Q, Wu Y, Peng C, Wang J, Xu Z, Yin XY, Zheng L. Peritumoral neutrophils link inflammatory response to disease progression by fostering angiogenesis in hepatocellular carcinoma. Journal of hepatology. 2011; 54:948-955.
44. Houghton AM, Rzymkiewicz DM, Ji H, Gregory AD, Egea EE, Metz HE, Stolz DB, Land SR, Marconcini LA, Kliment CR, Jenkins KM, Beaulieu KA, Mouded M, et al. Neutrophil elastase-mediated degradation of IRS-1 accelerates lung tumor growth. Nature medicine. 2010; 16:219-223.
45. McDonald B, Spicer J, Giannais B, Fallavollita L, Brodt P, Ferri LE. Systemic inflammation increases cancer cell adhesion to hepatic sinusoids by neutrophil mediated mechanisms. International journal of cancer. 2009; 125:1298-1305.
46. Pinato DJ, Stavraka C, Flynn MJ, Forster MD, O’Cathail SM, Seckl MJ, Kristeleit RS, Olmos D, Turnbull SJ, Blagden SP. An inflammation based score can optimize the selection of patients with advanced cancer considered for early phase clinical trials. PloS one. 2014; 9:e83279.
47. Donskov F, von der Maase H. Impact of immune parameters on long-term survival in metastatic renal cell carcinoma. Journal of clinical oncology. 2006; 24:1997-2005.
48. Lin G, Liu Y, Li S, Mao Y, Wang J, Shuang Z, Chen J, Li S. Elevated neutrophil-to-lymphocyte ratio is an independent poor prognostic factor in patients with intrahepatic cholangiocarcinoma. Oncotarget. 2016; 7:50963-50971. doi: 10.18632/oncotarget.7680.
49. Ha H, Nam AR, Bang JH, Park JE, Kim TY, Lee KH, Han SW, Im SA, Kim TY, Bang YJ, Oh DY. Soluble programmed death-ligand 1 (sPDL1) and neutrophil-to-lymphocyte ratio (NLR) predicts survival in advanced biliary tract cancer patients treated with palliative chemotherapy. Oncotarget. 2016; 7:76604-76612. doi: 10.18632/oncotarget.8334.
50. Wang JF, Li JB, Zhao YJ, Yi WJ, Bian JJ, Wan XJ, Zhu KM, Deng XM. Up-regulation of programmed cell death 1 ligand 1 on neutrophils may be involved in sepsis-induced immunosuppression: an animal study and a prospective case-control study. Anesthesiology. 2015; 122:852-863.
51. Zhao QT, Yuan Z, Zhang H, Zhang XP, Wang HE, Wang ZK, Duan GC. Prognostic role of platelet to lymphocyte ratio in non-small cell lung cancers: A meta-analysis including 3,720 patients. International journal of cancer. 2016; 139:164-170.
52. You J, Zhu GQ, Xie L, Liu WY, Shi L, Wang OC, Huang ZH, Braddock M, Guo GL, Zheng MH. Preoperative platelet to lymphocyte ratio is a valuable prognostic biomarker in patients with colorectal cancer. Oncotarget. 2016; 7:25516-25527. doi: 10.18632/oncotarget.8334.
53. Gu X, Gao XS, Cui M, Xie M, Peng C, Bai Y, Guo W, Han L, Gu X, Xiong W. Clinicopathological and prognostic significance of platelet to lymphocyte ratio in patients with gastric cancer. Oncotarget. 2016; 7:49878-49887. doi: 10.18632/oncotarget.10490.