
INTRODUCTION
Over the past few years our understanding of the importance of inflammation in coronary instability is considerably increased [1].
CD4+CD28null T-cells are a subset of long-lived directly cytotoxic CD4+ T-lymphocytes producing large amount of the pro-inflammatory cytokine interferon-γ (IFN-γ), that have been implicated in the pathogenesis of various chronic inflammatory diseases. We previously demonstrated that circulating CD4+CD28nullT-cell frequency higher than 4% increase the risk of acute coronary syndromes (ACS), particularly in diabetic patients [2, 3].
At the other extreme, naturally occurring regulatory T-cells are a major cellular source of interleukin (IL)-10, a potent anti-inflammatory cytokine. These regulatory T-cells are involved in the control of autoimmunity [4].Accordingly, a lower number or a decreased function of these cells has been found in patients suffering from lupus erythematous, type-1 diabetes, rheumatoid arthritis, and multiple sclerosis [5], as well as in patients with ACS [6, 7]. Moreover, in ACS the production of pro-inflammatory cytokines is not adequately counterbalanced by anti-inflammatory cytokines, such as IL-10; these alterations have been related to a worse short- and long-term prognosis [8, 9].We recently observed that a subset of ACS patients presents an alteration of the immune response, associated to a worse outcome and characterized by reduced regulatory T-cell response to effector T-cell expansion [10].
Statins have anti-inflammatory and immune-suppressive activity besides lowering lipids that may, at least partially, account for their outcome improvement in the setting of both acute and chronic ischemic heart disease [11, 12, 13]. In particular, statins attenuate T-cell activation and proliferation, inhibit pro-inflammatory cytokine secretion and enhance anti-inflammatory cytokine secretion [14, 15, 16]. Two observational retrospective studies of our group have shown that in ACS the use of statins was associated with reduced levels of CD4+CD28nullT-cells [17, 2]. In a small number of ACS patients, rosuvastatin treatment for 6 weeks induced CD4+CD28nullT-cell apoptosis [18]. Recent studies have also suggested that statins may enhance regulatory T-cell responses [19, 20, 21].
In the present study, we sought to investigate the effects of increasing doses of atorvastatin on phenotype and function of different CD4+T-cell subsets, obtained from 50 statin-naïve patients presenting with non-ST elevation (NSTE)-ACS and raised levels of CD4+CD28nullT-cells. To explore the mechanisms by which atorvastatin might suppress the immune response in ACS, we analyzed by quantitative PCR array the expression of 84 transcription factors involved in the immune response and 84 genes related to the functional properties of different T-helper cell subsets.
Finally, we assessed the in-vivo effects of high-dose of atorvastatin (80 mg/daily) in ACS patients.
RESULTS
Patient selection and study design are presented in Figure-1.
Table 1 summarizes the clinical characteristics of the study population.
The percentage of total CD4+T-cells, CD4+CD28nullT-cells, CD4+CD25highT-cells and CD4+CD25highT-cells expressing the transcription factor Foxp3 did not change significantly after ex-vivo treatment with increasing doses of atorvastatin for 24 hours (Figure 2).
Table 1: Baseline characteristics of study population: 50 statin-naïve ACS patients.
Age, mean ± SD (years) |
64±12 |
Sex, n (F/M) |
10/40 |
Clinical Presentation (UAIIIB/NSTEMI) |
8/42 |
Smokers, n (%) |
29 (58%) |
Family History of CAD, n (%) |
19 (38%) |
Hypertension, n (%) |
33 (66%) |
Obesity, n (%) |
10 (20%) |
Dyslipidemia, n (%) |
26 (52%) |
Previous Cardiovascular Events, n (%) |
7 (14%) |
Previous PCI/CABG, n (%) |
10/5 (20%/10%) |
Multivessel disease, n (%) |
23 (46%) |
In-hospital PCI/CABG, n (%) |
32/14 (64%/28%) |
LVEF, mean ± SD (%) |
51±0.12 |
Total-C, mean ± SD (mg/dl) |
185.3±49.1 |
LDL-C, mean ± SD (mg/dl) |
130.9±34.3 |
HDL-C, mean ± SD (mg/dl) |
40.9±12.8 |
TG, mean ± SD (mg/dl) |
142.8±85.1 |
Plasma glucose, mean ± SD (mg/dl) |
114.2±39.1 |
Lymphocytes, median-range (103/ml) |
1.65 (0.63-4.33) |
ACS=acute coronary syndromes; UA=unstable angina; NSTEMI=non-ST elevation acute myocardial infarction; CAD=coronary artery disease; PCI=percutaneous coronary intervention; CABG=coronary artery by-pass graft; LVEF = left ventricular ejection fraction; Total-C = Total-Cholesterol; LDL-C = LDL-Cholesterol; HDL-C = HDL-Cholesterol; TG = triglycerides.
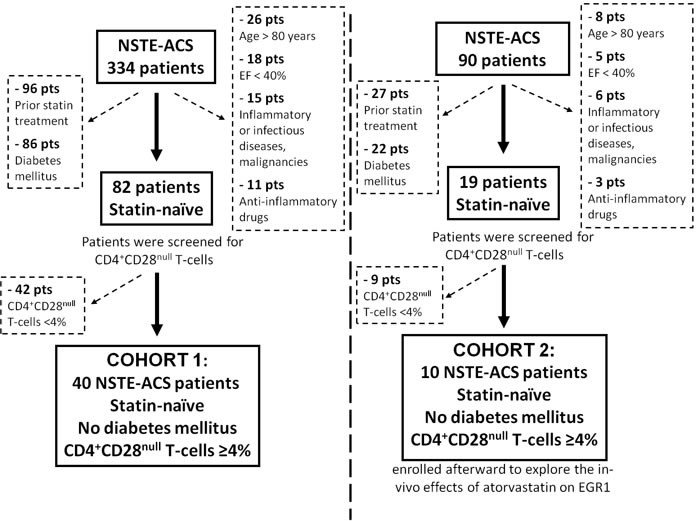
Figure 1: Flow diagram of patient selection and study design. NST-ACS = Non ST elevation acute coronary syndrome; EF = left ventricular ejection fraction.
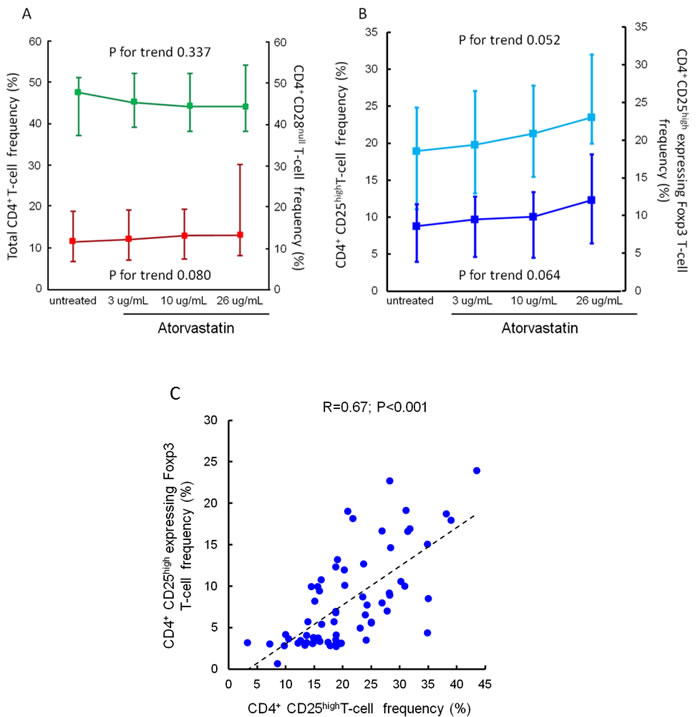
Figure 2: Effects of atorvastatin on total CD4+T-cells, CD4+CD28nullT-cells, CD4+CD25highT-cells and CD4+CD25high Foxp3+T-cells. Panel A. Frequencies of total CD4+ and of CD4+CD28null T-cells were determined by flow-cytometry. CD4+T-cells were isolated from peripheral blood samples of 20 statin-naïve NST-ACS patients and incubated for 24 hours without and with increasing doses of atorvastatin. Data are presented as median and 95% CI. The percentage of both total CD4+ (indicated in green) and of CD4+CD28null T-cells (indicated in red) did not change significantly after treatment with atorvastatin (P for trend = 0.337 and 0.080, respectively). Panel B. Frequencies of CD4+CD25highT-cells and of CD4+CD25highT-cells expressing the transcription factor Foxp3 were determined as described in Panel A. Data are presented as median and 95% CI. The percentage of both total CD4+CD25highT-cells (indicated in light blue) and of CD4+CD25high Foxp3+ T-cells (indicated in dark blue) showed slight, but not statistically significant, changes after treatment with atorvastatin (P for trend = 0.052 and 0.064, respectively). Panel C. Correlation between CD4+CD25highT-cells and CD4+CD25high Foxp3+T-cells. Frequencies of CD4+CD25highT-cells and of CD4+CD25highT-cells expressing the transcription factor Foxp3 were calculated as percentage of CD4+CD25+T-cell population. A significant correlation was observed among these T-cell subsets (R = 0.67; P < 0.001). Spearman rank correlation was performed on pooled data (untreated/treated with increased doses of atorvastatin).
Effects of atorvastatin on CD4+CD28null T-cells and CD4+CD25highT-cells
The activation of CD4+CD28nullT-cells and CD4+CD25highT-cell subset was modified by atorvastatin treatment. Indeed, the percentage of CD4+CD28nullT-cells producing IFN-γ decreased from a median of 44.1% (range 20.5-60.9) (untreated cells) to 15.0% (range 8.6-23.8) after incubation with 26 μg/ml of atorvastatin (P for trend = 0.009) (Figure-3). Conversely, the percentage of CD4+CD25highT-cells producing IL-10 increased from a median of 38.6% (range 13.5-67.1) (untreated cells) to 71.1% (range 44.3-95.5), after incubation with 26 μg/ml of atorvastatin (P for trend < 0.001). Accordingly, the MFI of intracellular IL-10 expression increased after treatment (from 24.4±13.5 to 53.3±22.3; P for trend < 0.001) (Figure-4, panel A-B).
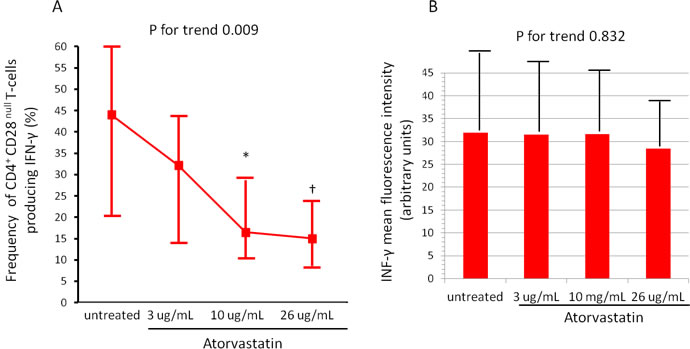
Figure 3: Effects of atorvastatin on CD4+CD28null T-cells. CD4+T-cells were isolated from whole blood samples of 20 statin-naïve NST-ACS patients and incubated for 24 hours without and with increasing doses of atorvastatin. Cells were analyzed by flow-cytometry. A. The percentage of CD4+CD28nullTcells producing IFN-γ decreased after treatment with atorvastatin (P for trend = 0.009). Data are presented as median and 95% CI. *P = 0.014 untreated cells vs 10μg/mL of atorvastatin; †P = 0.006 untreated cells vs 26 μg/mL of atorvastatin. B. The mean fluorescence intensity (MFI) of intracellular IFN-γ expression by CD4+CD28nullT-cells remained unchanged after atorvastatin treatment (P for trend = 0.832). Data are presented as mean±SD.
Effects of atorvastatin on pro-inflammatory and anti-inflammatory cytokine concentrations
IL-10 concentration increased from a median of 1.5 pg/mL, range 0.7-39.9 (untreated blood) to 6.3 pg/mL (range 1-42.7) after incubation of whole blood samples, collected from an antecubital vein at the time of patient enrollment, with 26 μg/ml of atorvastatin (P for trend = 0.024) (Figure-4, Panel C). Although we used a high-sensitivity ELISA kit, IFN-γ was detectable in few patients at baseline and resulted undetectable after atorvastatin treatment (data not shown).
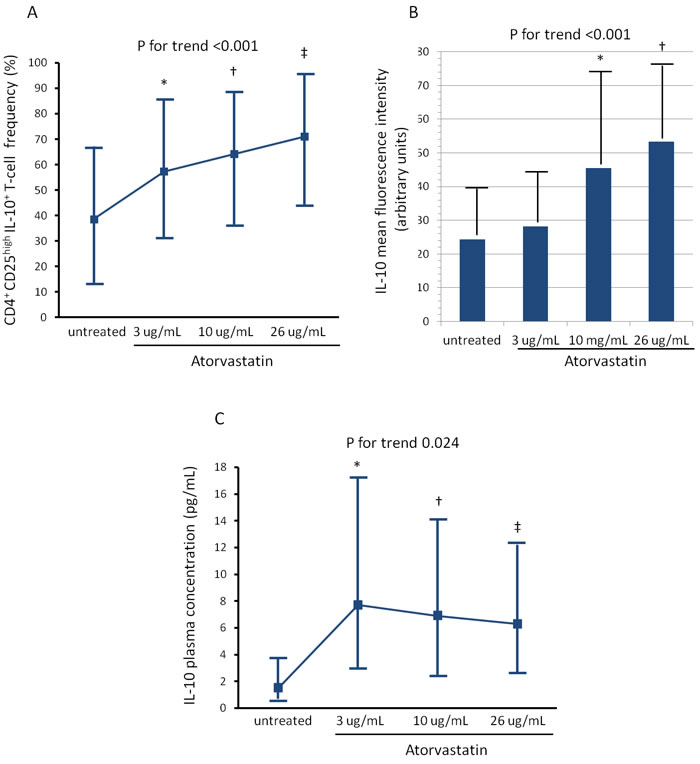
Figure 4: Effects of atorvastatin on CD4+CD25highT-cells. Experimental conditions are reported in Figure 3. A. The percentage of CD4+CD25highTcells producing IL-10 increased significantly after treatment with atorvastatin (P for trend < 0.001). Data are presented as median and 95% CI. *P = 0.034 untreated cells vs 3μg/mL of atorvastatin; †P = 0.022 untreated cells vs 10μg/mL of atorvastatin; ‡P < 0.001 untreated cells vs 26μg/mL of atorvastatin. B. The mean fluorescence intensity (MFI) of intracellular IL-10 expression by CD4+CD25highT-cells also increased significantly after atorvastatin treatment (P for trend < 0.001). Data are presented as mean±SD. *P = 0.056 untreated cells vs 10μg/mL of atorvastatin; †P < 0.001 untreated cells vs 26μg/mL of atorvastatin. C. IL-10 was measured by high-sensitivity ELISA in aliquots of 1mL of whole blood incubated for 24 hours without and with increasing doses of atorvastatin: 3-10-26μg/ml. IL-10 concentrations significantly increased after atorvastatin treatment (P for trend = 0.024). *P = 0.025 untreated cells vs 3μg/mL of atorvastatin; †P = 0.016 untreated cells vs 10μg/mL of atorvastatin; ‡P = 0.058 untreated cells vs 26ug/mL of atorvastatin.
Atorvastatin decreases the expression of key cellular pathways in ACS CD4+T-cells
To identify mechanisms by which atorvastatin might have immune-suppressive effects in CD4+T-cell populations, we analyzed the gene expression of a focused panel of 84 transcription factors downstream of signaling from cytokines, chemokines, growth factors, androgens and Toll-Like receptors. Then, we performed a PCR array profiling the expression of 84 genes including cytokine genes representative of the three classes of helper T-cells, genes encoding transcriptional factors that regulate the expression of these cytokines, markers of CD4+T-cell activation and other genes involved in the adaptive immune responses. PCR array analysis was applied on pooled RNA samples.
The complete list of genes investigated by PCR arrays, and their different expression after atorvastatin treatment, is reported in Table-2 and 3.
PCR array analysis revealed that the expression of 2 genes was increased while the expression of 12 genes was decreased (>3-fold changes) by ex-vivo treatment of freshly isolated CD4+T-cells from ACS patients with a dose of 26 μg/ml atorvastatin for 24 hours compared with control (Figure-5). Among the transcription factors, atorvastatin decreased the expression of early growth response 1 (EGR1) and V-fos FBJ murine osteosarcoma viral oncogene homolog (FOS). Among the genes related to helper T-cell pathway, atorvastatin decreased the expression of chemokine (C-C motif) receptor-2 (CCR2), the Toll-like receptor-4 (TLR4), and the proinflammatory cytokines IL-6 and IL-18.
Table 2: Genes investigated by Human Transcription Factors RT² Profiler™ PCR Array, and changes in their expression induced by atorvastatin.
Position |
Symbol |
Description |
Fold Regulation |
A01 |
AR |
Androgen receptor |
3,6217 |
A02 |
ARNT |
Aryl hydrocarbon receptor nuclear translocator |
2,5198 |
A03 |
ATF1 |
Activating transcription factor 1 |
-1,3044 |
A04 |
ATF2 |
Activating transcription factor 2 |
-1,1277 |
A05 |
ATF3 |
Activating transcription factor 3 |
1,0473 |
A06 |
ATF4 |
Activating transcription factor 4 (tax-responsive enhancer element B67) |
1,0329 |
A07 |
CEBPA |
CCAAT/enhancer binding protein (C/EBP), alpha |
-2,7959 |
A08 |
CEBPB |
CCAAT/enhancer binding protein (C/EBP), beta |
-1,4077 |
A09 |
CEBPG |
CCAAT/enhancer binding protein (C/EBP), gamma |
-1,4880 |
A10 |
CREB1 |
CAMP responsive element binding protein 1 |
-1,1277 |
A11 |
CREBBP |
CREB binding protein |
-1,3226 |
A12 |
CTNNB1 |
Catenin (cadherin-associated protein), beta 1, 88kDa |
-1,6058 |
B01 |
DR1 |
Down-regulator of transcription 1, TBP-binding (negative cofactor 2) |
-2,3027 |
B02 |
E2F1 |
E2F transcription factor 1 |
1,2454 |
B03 |
E2F6 |
E2F transcription factor 6 |
-1,4777 |
B04 |
EGR1 |
Early growth response 1 |
-10,9710 |
B05 |
ELK1 |
ELK1, member of ETS oncogene family |
-1,0743 |
B06 |
ESR1 |
Estrogen receptor 1 |
-1,1674 |
B07 |
ETS1 |
V-ets erythroblastosis virus E26 oncogene homolog 1 (avian) |
-1,5837 |
B08 |
ETS2 |
V-Ets erythroblastosis virus E26 oncogene homolog 2 (avian) |
-1,2340 |
B09 |
FOS |
FBJ murine osteosarcoma viral oncogene homolog |
-5,5533 |
B10 |
FOXA2 |
Forkhead box A2 |
2,5198 |
B11 |
FOXO1 |
Forkhead box O1 |
-1,3044 |
B12 |
GATA1 |
GATA binding protein 1 (globin transcription factor 1) |
-1,9498 |
C01 |
GATA2 |
GATA binding protein 2 |
1,0842 |
C02 |
GATA3 |
GATA binding protein 3 |
-1,4777 |
C03 |
GTF2B |
General transcription factor IIB |
-1,2340 |
C04 |
GTF2F1 |
General transcription factor IIF, polypeptide 1, 74kDa |
-1,2599 |
C05 |
HAND1 |
Heart and neural crest derivatives expressed 1 |
1,4506 |
C06 |
HAND2 |
Heart and neural crest derivatives expressed 2 |
2,4566 |
C07 |
HDAC1 |
Histone deacetylase 1 |
1,0918 |
C08 |
HIF1A |
Hypoxia inducible factor 1, alpha subunit (basic helix-loop-helix transcription factor) |
-1,2426 |
C09 |
HNF4A |
Hepatocyte nuclear factor 4, alpha |
1,0842 |
C10 |
HOXA5 |
Homeobox A5 |
1,0842 |
C11 |
HSF1 |
Heat shock transcription factor 1 |
1,0918 |
C12 |
ID1 |
Inhibitor of DNA binding 1, dominant negative helix-loop-helix protein |
-2,0326 |
D01 |
IRF1 |
Interferon regulatory factor 1 |
1,0693 |
D02 |
JUN |
Jun proto-oncogene |
2,5198 |
D03 |
JUNB |
Jun B proto-oncogene |
-1,3883 |
D04 |
JUND |
Jun D proto-oncogene |
-1,1045 |
D05 |
MAX |
MYC associated factor X |
-1,1514 |
D06 |
MEF2A |
Myocyte enhancer factor 2A |
-1,2426 |
D07 |
MEF2B |
Myocyte enhancer factor 2B |
-1,4473 |
D08 |
MEF2C |
Myocyte enhancer factor 2C |
2,9214 |
D09 |
MYB |
V-myb myeloblastosis viral oncogene homolog (avian) |
1,0116 |
D10 |
MYC |
V-myc myelocytomatosis viral oncogene homolog (avian) |
-1,0595 |
D11 |
MYF5 |
Myogenic factor 5 |
1,0842 |
D12 |
MYOD1 |
Myogenic differentiation 1 |
1,0842 |
E01 |
NFAT5 |
Nuclear factor of activated T-cells 5, tonicity-responsive |
-1,2255 |
E02 |
NFATC1 |
Nuclear factor of activated T-cells, cytoplasmic, calcineurin-dependent 1 |
-1,4777 |
E03 |
NFATC2 |
Nuclear factor of activated T-cells, cytoplasmic, calcineurin-dependent 2 |
-1,0595 |
E04 |
NFATC3 |
Nuclear factor of activated T-cells, cytoplasmic, calcineurin-dependent 3 |
-1,2775 |
E05 |
NFATC4 |
Nuclear factor of activated T-cells, cytoplasmic, calcineurin-dependent 4 |
-1,0892 |
E06 |
NFKB1 |
Nuclear factor of kappa light polypeptide gene enhancer in B-cells 1 |
1,2283 |
E07 |
NFYB |
Nuclear transcription factor Y, beta |
-1,0595 |
E08 |
NR3C1 |
Nuclear receptor subfamily 3, group C, member 1 (glucocorticoid receptor) |
-1,1674 |
E09 |
PAX6 |
Paired box 6 |
1,0046 |
E10 |
POU2AF1 |
POU class 2 associating factor 1 |
-3,3714 |
E11 |
PPARA |
Peroxisome proliferator-activated receptor alpha |
-1,0305 |
E12 |
PPARG |
Peroxisome proliferator-activated receptor gamma |
1,2805 |
F01 |
RB1 |
Retinoblastoma 1 |
-1,2512 |
F02 |
REL |
V-rel reticuloendotheliosis viral oncogene homolog (avian) |
-1,4777 |
F03 |
RELA |
V-rel reticuloendotheliosis viral oncogene homolog A (avian) |
-1,0449 |
F04 |
RELB |
V-rel reticuloendotheliosis viral oncogene homolog B |
1,2030 |
F05 |
SMAD1 |
SMAD family member 1 |
-1,4880 |
F06 |
SMAD4 |
SMAD family member 4 |
-1,0234 |
F07 |
SMAD5 |
SMAD family member 5 |
1,2114 |
F08 |
SMAD9 |
SMAD family member 9 |
-1,1277 |
F09 |
SP1 |
Sp1 transcription factor |
-1,2170 |
F10 |
SP3 |
Sp3 transcription factor |
-1,0595 |
F11 |
STAT1 |
Signal transducer and activator of transcription 1, 91kDa |
1,0046 |
F12 |
STAT2 |
Signal transducer and activator of transcription 2, 113kDa |
-1,2864 |
G01 |
STAT3 |
Signal transducer and activator of transcription 3 (acute-phase response factor) |
-3,1748 |
G02 |
STAT4 |
Signal transducer and activator of transcription 4 |
-1,0595 |
G03 |
STAT5A |
Signal transducer and activator of transcription 5A |
-1,2086 |
G04 |
STAT5B |
Signal transducer and activator of transcription 5B |
2,5198 |
G05 |
STAT6 |
Signal transducer and activator of transcription 6, interleukin-4 induced |
1,0257 |
G06 |
TBP |
TATA box binding protein |
-1,1755 |
G07 |
HNF1A |
HNF1 homeobox A |
1,0842 |
G08 |
TCF7L2 |
Transcription factor 7-like 2 (T-cell specific, HMG-box) |
1,0842 |
G09 |
TFAP2A |
Transcription factor AP-2 alpha (activating enhancer binding protein 2 alpha) |
2,4061 |
G10 |
TGIF1 |
TGFB-induced factor homeobox 1 |
1,0473 |
G11 |
TP53 |
Tumor protein p53 |
1,0046 |
G12 |
YY1 |
YY1 transcription factor |
-1,2426 |
For each condition (untreated/treated with atorvastatin) a pool of RNA was constituted, starting with the same amount of RNA (500 ng) from each patient of Cohort 1 (see Methods).
Data are presented as fold of changes in gene expression induced by atorvastatin treatment as compared with the gene expression in untreated CD4+T-cells. Increased genes are indicated in red and decreased genes in green. A fold change in gene expression of ≥ 3 was taken as significant.
Table 3: Genes investigated by Human Th1-Th2-Th3 RT² Profiler™ PCR Array, and changes in their expression induced by atorvastatin.
Position |
Symbol |
Description |
Fold Regulation |
A01 |
IL17A |
Interleukin 17A |
-1,0822 |
A02 |
CCL11 |
Chemokine (C-C motif) ligand 11 |
1,0622 |
A03 |
CCL5 |
Chemokine (C-C motif) ligand 5 |
-1,1696 |
A04 |
CCL7 |
Chemokine (C-C motif) ligand 7 |
1,0822 |
A05 |
CCR2 |
Chemokine (C-C motif) receptor 2 |
-3,4822 |
A06 |
CCR3 |
Chemokine (C-C motif) receptor 3 |
2,5974 |
A07 |
CCR4 |
Chemokine (C-C motif) receptor 4 |
1,0310 |
A08 |
CCR5 |
Chemokine (C-C motif) receptor 5 |
-1,6656 |
A09 |
CD28 |
CD28 molecule |
-1,1859 |
A10 |
CD4 |
CD4 molecule |
-2,0648 |
A11 |
CD40LG |
CD40 ligand |
-2,6500 |
A12 |
IL23A |
Interleukin 23, alpha subunit p19 |
-1,4804 |
B01 |
CD80 |
CD80 molecule |
1,0098 |
B02 |
CD86 |
CD86 molecule |
-7,4436 |
B03 |
CEBPB |
CCAAT/enhancer binding protein (C/EBP), beta |
-1,2025 |
B04 |
CREBBP |
CREB binding protein |
1,0973 |
B05 |
CSF2 |
Colony stimulating factor 2 (granulocyte-macrophage) |
1,0822 |
B06 |
CTLA4 |
Cytotoxic T-lymphocyte-associated protein 4 |
1,0381 |
B07 |
CXCR3 |
Chemokine (C-X-C motif) receptor 3 |
-1,1065 |
B08 |
FASLG |
Fas ligand (TNF superfamily, member 6) |
-1,5648 |
B09 |
GATA3 |
GATA binding protein 3 |
-1,2710 |
B10 |
GFI1 |
Growth factor independent 1 transcription repressor |
-1,3250 |
B11 |
GLMN |
Glomulin, FKBP associated protein |
-1,5433 |
B12 |
GPR44 |
G protein-coupled receptor 44 |
-1,9807 |
C01 |
HAVCR2 |
Hepatitis A virus cellular receptor 2 |
-1,7484 |
C02 |
ICOS |
Inducible T-cell co-stimulator |
-1,2277 |
C03 |
IFNG |
Interferon, gamma |
-1,7487 |
C04 |
IGSF6 |
Immunoglobulin superfamily, member 6 |
-2,2439 |
C05 |
IL10 |
Interleukin 10 |
1,9411 |
C06 |
IL12B |
Interleukin 12B (natural killer cell stimulatory factor 2, cytotoxic lymphocyte maturation factor 2, p40) |
-1,1859 |
C07 |
IL12RB2 |
Interleukin 12 receptor, beta 2 |
-1,1519 |
C08 |
IL13 |
Interleukin 13 |
-1,0396 |
C09 |
IL13RA1 |
Interleukin 13 receptor, alpha 1 |
-3,6200 |
C10 |
IL15 |
Interleukin 15 |
-1,6313 |
C11 |
IL18 |
Interleukin 18 (interferon-gamma-inducing factor) |
-5,8401 |
C12 |
IL18R1 |
Interleukin 18 receptor 1 |
-1,1696 |
D01 |
IL1R1 |
Interleukin 1 receptor, type I |
-1,1455 |
D02 |
IL1R2 |
Interleukin 1 receptor, type II |
1,2693 |
D03 |
IL2 |
Interleukin 2 |
-2,3554 |
D04 |
IL2RA |
Interleukin 2 receptor, alpha |
-1,4702 |
D05 |
IL4 |
Interleukin 4 |
1,0822 |
D06 |
IL4R |
Interleukin 4 receptor |
-1,2108 |
D07 |
IL5 |
Interleukin 5 (colony-stimulating factor, eosinophil) |
-1,7243 |
D08 |
IL6 |
Interleukin 6 (interferon, beta 2) |
-5,9628 |
D09 |
IL6R |
Interleukin 6 receptor |
-1,2277 |
D10 |
IL7 |
Interleukin 7 |
-1,3159 |
D11 |
IL9 |
Interleukin 9 |
1,0822 |
D12 |
INHA |
Inhibin, alpha |
1,0822 |
E01 |
INHBA |
Inhibin, beta A |
1,4682 |
E02 |
IRF1 |
Interferon regulatory factor 1 |
1,1761 |
E03 |
IRF4 |
Interferon regulatory factor 4 |
-1,0324 |
E04 |
JAK1 |
Janus kinase 1 |
-1,0324 |
E05 |
JAK2 |
Janus kinase 2 |
-1,0614 |
E06 |
LAG3 |
Lymphocyte-activation gene 3 |
-1,4103 |
E07 |
LAT |
Linker for activation of T cells |
1,0238 |
E08 |
MAF |
V-maf musculoaponeurotic fibrosarcoma oncogene homolog (avian) |
-1,0468 |
E09 |
MAP2K7 |
Mitogen-activated protein kinase kinase 7 |
-1,1942 |
E10 |
MAPK8 |
Mitogen-activated protein kinase 8 |
1,0028 |
E11 |
NFATC1 |
Nuclear factor of activated T-cells, cytoplasmic, calcineurin-dependent 1 |
-1,3159 |
E12 |
NFATC2 |
Nuclear factor of activated T-cells, cytoplasmic, calcineurin-dependent 2 |
-1,0468 |
F01 |
NFATC2IP |
Nuclear factor of activated T-cells, cytoplasmic, calcineurin-dependent 2 interacting protein |
-1,2799 |
F02 |
PCGF2 |
Polycomb group ring finger 2 |
-1,7005 |
F03 |
PTPRC |
Protein tyrosine phosphatase, receptor type, C |
-1,1696 |
F04 |
SFTPD |
Surfactant protein D |
3,1037 |
F05 |
SOCS1 |
Suppressor of cytokine signaling 1 |
1,0098 |
F06 |
SOCS2 |
Suppressor of cytokine signaling 2 |
-1,5977 |
F07 |
SOCS5 |
Suppressor of cytokine signaling 5 |
1,0747 |
F08 |
SPP1 |
Secreted phosphoprotein 1 |
-5,2634 |
F09 |
STAT1 |
Signal transducer and activator of transcription 1, 91kDa |
1,0673 |
F10 |
STAT4 |
Signal transducer and activator of transcription 4 |
-1,0973 |
F11 |
STAT6 |
Signal transducer and activator of transcription 6, interleukin-4 induced |
1,0028 |
F12 |
TBX21 |
T-box 21 |
-1,0913 |
G01 |
TFCP2 |
Transcription factor CP2 |
-1,3813 |
G02 |
TGFB3 |
Transforming growth factor, beta 3 |
1,1127 |
G03 |
TLR4 |
Toll-like receptor 4 |
-3,4822 |
G04 |
TLR6 |
Toll-like receptor 6 |
-1,4702 |
G05 |
TMED1 |
Transmembrane emp24 protein transport domain containing 1 |
-1,4499 |
G06 |
TNF |
Tumor necrosis factor |
1,0973 |
G07 |
CD27 |
CD27 molecule |
-1,2025 |
G08 |
TNFRSF8 |
Tumor necrosis factor receptor superfamily, member 8 |
-5,4869 |
G09 |
TNFRSF9 |
Tumor necrosis factor receptor superfamily, member 9 |
-1,5757 |
G10 |
TNFSF4 |
Tumor necrosis factor (ligand) superfamily, member 4 |
1,0098 |
G11 |
TYK2 |
Tyrosine kinase 2 |
-1,1535 |
G12 |
YY1 |
YY1 transcription factor |
-1,3909 |
For each condition (untreated/treated with atorvastatin) a pool of RNA was constituted, starting with the same amount of RNA (500 ng) from each patient of Cohort 1 (see Methods).
Data are presented as fold of changes in gene expression induced by atorvastatin treatment as compared with the gene expression in untreated CD4+T-cells. Increased genes are indicated in red and decreased genes in green. A fold change in gene expression of ≥ 3 was taken as significant.
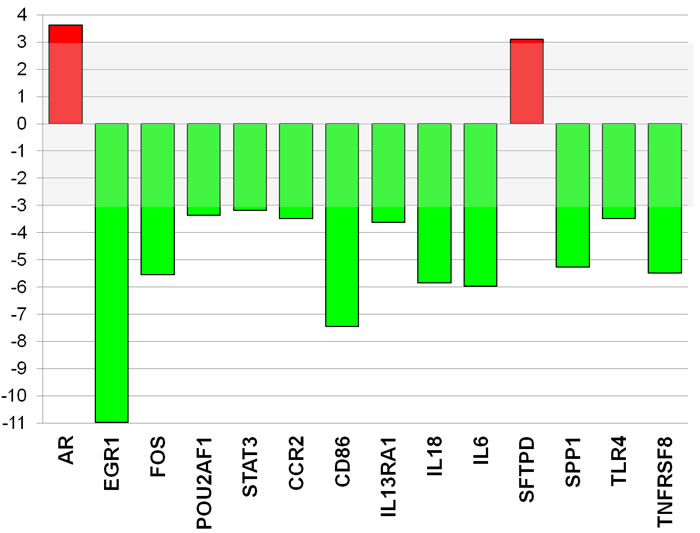
Figure 5: Atorvastatin decreases the expression of inflammatory genes and key transcription factors in CD4+T-cells of patients with ACS. The expression of 84 transcription factors and 84 genes related to both T-effectors and T-regulatory cells was analyzed by quantitative PCR array using a pool of RNA (n = 20 patients). Data are presented as fold of regulation by atorvastatin treatment as compared with the gene expression in untreated CD4+T-cells. The expression of 2 genes was increased (red) and the expression of 12 genes was reduced (green) (>3 fold changes) by atorvastatin treatment (26 μg/ml for 24 hours) compared with control. The complete list of genes investigated by PCR arrays, and changes in their expression induced by atorvastatin, is reported in Tables 2 and 3.
To validate the PCR array results for selected genes, RT-qPCR was performed using RNA of each single patient. This set of data confirmed that atorvastatin significantly decreased the expression of CCR2 and of TLR4 as well as the expression of the transcription factors EGR1, FOS (Figure-6).
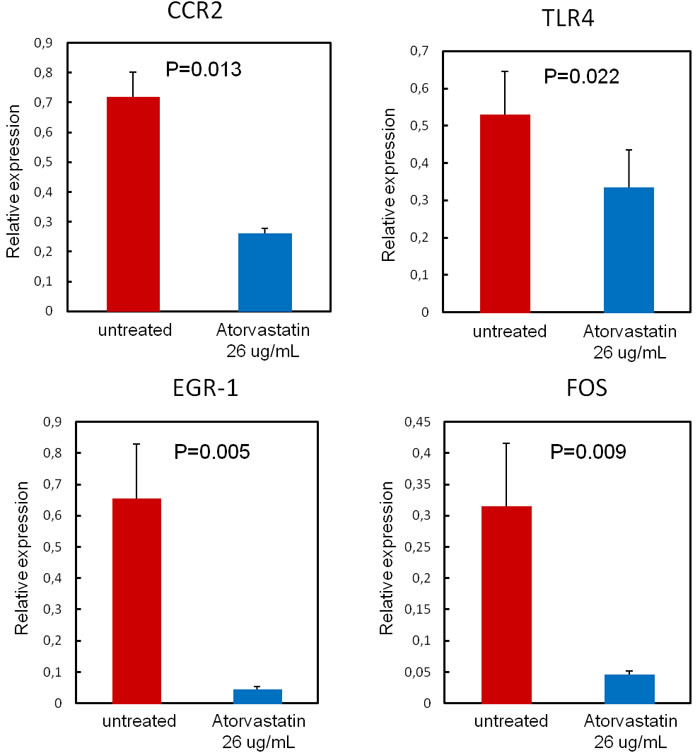
Figure 6: Validation of PCR array results. To validate the PCR array results for selected genes, RT-qPCR was performed using single patients RNA (n = 20 patients). Data are presented as relative expression compared to human β-2-microglobulin (β-2MG) and glyceraldehyde-3-phosphate dehydrogenase (GAPDH) mRNA levels as endogenous controls, and expressed as mean±SD. Atorvastatin treatment (26 μg/ml for 24hours) significantly decreases the expression of the transcription factors EGR1 (from 0.65±0.18 to0.04±0.01; P = 0.005) and FOS (from 0.31±0.10 to 0.05±0.01; P = 0.009), Moreover, atorvastatin decreases the expression of the chemokine receptor CCR2 (from 0.72±0.08 to 0.26±0.02; P = 0.013) and of the pattern recognition receptor TLR4 (from 0.53±0.12 to0.34±0.10; P = 0.022).
We also explored whether atorvastatin treatment might decrease EGR1 protein expression levels, as EGR1 gene showed the highest inhibition at PCR array analysis and also because EGR1 is a transcription factors critically involved in the immune response. Western-blot assay confirmed that incubation with atorvastatin (26 μg/ml) resulted in a significant reduction of EGR1 protein levels (from 5.0±2.6 to1.9±0.97; P = 0.038) (Figure-7).
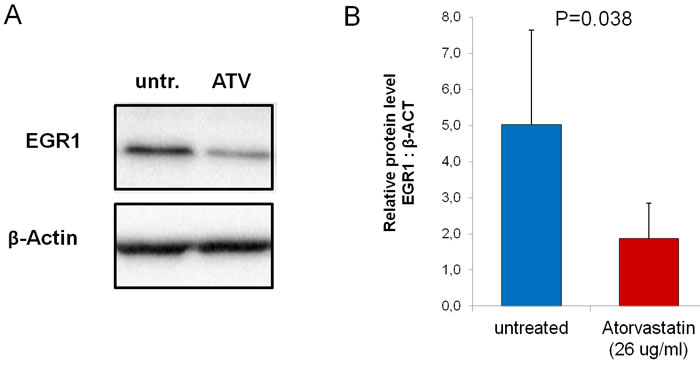
Figure 7: Effect of atorvastatin on EGR-1 protein expression. CD4+T-cells were cultured for 24 hours with (ATV) and without (untr.) atorvastatin (26μg/ml). Western blot was performed using whole-cell extracts (25 μg per lane) (n = 20 patients). A. Representative bands for Egr-1 and β-actin loading controls. B. After atorvastatin treatment, Egr-1 protein decreased significantly. Data are shown as mean±S.E.M.
In vivo effects of Atorvastatin
The in-vivo effects of atorvastatin were analyzed in 10 statin-free ACS patients at baseline, and after 24 hours and 48 hours of atorvastatin therapy (80 mg/daily). A single high-dose of atorvastatin has early effects on EGR1 mRNA expression and, with a reasonable delay, on EGR1 protein levels. In all patients, EGR1 gene expression was reduced after 24h of atorvastin therapy, from a mean (± SEM) value of 26.7 ± 5.7 at baseline to 8.5±1.9 at 24 hours (P = 0.01 versus baseline) and to 5.9±2.1 at 48hours (P = 0.005 versus baseline). Accordingly, EGR1 protein levels were significantly reduced after 48h of atorvastatin treatment, from a mean (± SEM) value of 26.1±2.2 at baseline to 24.7±1.9 at 24 hours (P = 0.67) and to 18.8±1.2 at 48 hours (P = 0.03 versus baseline) (Figure 8).
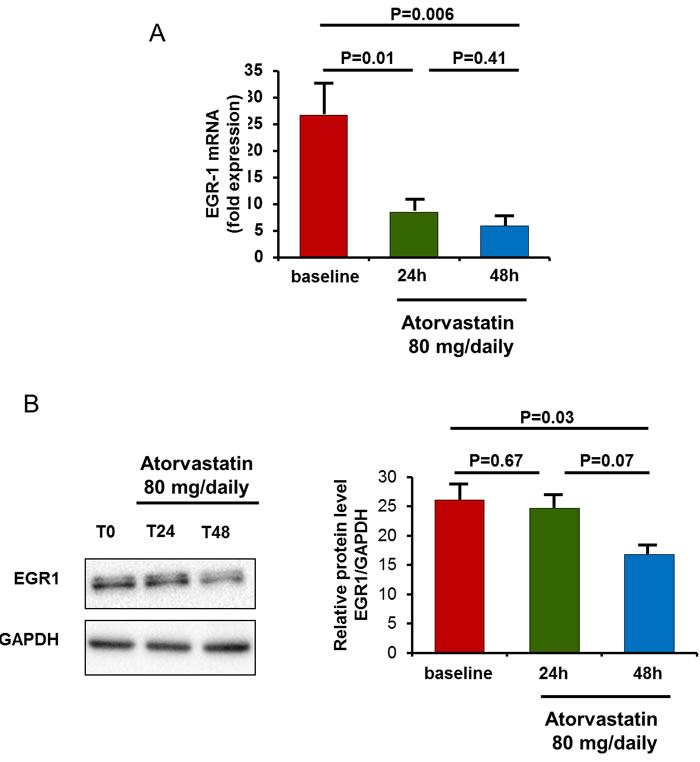
Figure 8: In-vivo effect of atorvastatin on EGR1 gene expression and protein levels. EGR1 gene expression and protein levels were assessed in 10 statin-naïve ACS patients after 24 hours and 48 hours of therapy with atorvastatin (80 mg/daily). A. To analyze atorvastatin effects on EGR1 gene expression, RT-qPCR was performed using RNA of each single patient of Cohort 2. Data are presented as relative expression compared to human β-2-microglobulin (β-2MG) and glyceraldehyde-3-phosphate dehydrogenase (GAPDH) mRNA levels as endogenous controls, and expressed as mean±S.E.M. In all patients, EGR1 mRNA levels decreased significantly after 24 hours of atorvastatin therapy. B. To analyze atorvastatin effects on EGR1 protein levels, Western blot was performed using whole-cell extracts (25 μg per lane). Representative bands for EGR11 and GAPDH loading controls are shown. After 48 hours of atorvastatin therapy, EGR1 protein decreased significantly. Data are shown as mean±S.E.M.
The mean fluorescence intensity of intracellular IFN-γ expression by CD4+CD28nullT-cells significantly decreased after 48hours of atorvastatin therapy (from 40.6±5.7 to 30.9±4.0 mean±S.E.M; P for trend = 0.0034). Moreover, the mean fluorescence intensity of intracellular IL-10 expression by CD4+CD25highT-cells significantly increased after 48hours of atorvastatin therapy (from 21.5±2.3 to 40.7±7.1; P for trend < 0.001). Accordingly, the ratio between IL-10 and INF-γ expression significantly increased (from 0.59±0.08 to 1.78±0.64; P for trend = 0.002) (Figure 9).
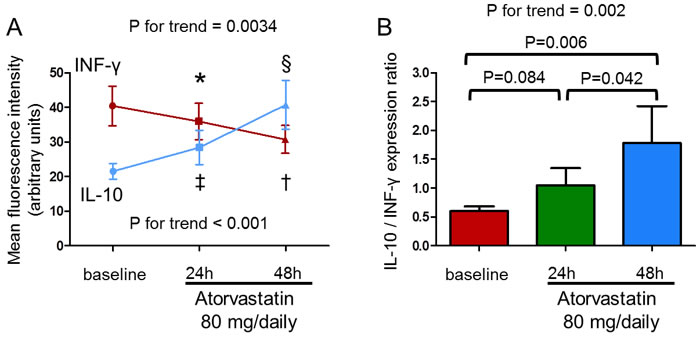
Figure 9: In-vivo effect of atorvastatin on IFN-γ production by CD4+CD28nullT-cells and IL-10 production by CD4+CD25highT-cells upon stimulation. IFN-γ and IL-10 production were assessed by flow-cytometry in 10 statin-naïve ACS patients after 24 and 48 hours of therapy with atorvastatin (80 mg/daily). A. The mean fluorescence intensity of intracellular IFN-γ expression by CD4+CD28nullT-cells significantly decreased (P for trend = 0.0034; *P = 0.12, baseline vs 24 hours; †P = 0.010, baseline vs 48 hours; P = 0.037, 24 hours vs 48 hours) and the mean fluorescence intensity of intracellular IL-10 expression by CD4+CD25highT-cells significantly increased after 48hours of atorvastatin therapy (P for trend < 0.001; ‡P = 0.16, baseline vs 24 hours; §P = 0.004, baseline vs 48 hours; P = 0.006, 24 hours vs 48 hours). Data are shown as mean±S.E.M. B. Accordingly, the ratio between IL-10/INF-γ expression significantly increased (P for trend = 0.002). Data are shown as mean±S.E.M.
DISCUSSION
In the present study, we observed that atorvastatin ex-vivo, at concentrations corresponding to blood levels achieved with 10-40-80 mg/die, and after short-time (24 hours of incubation), modified the inflammatory activity of T-lymphocytes, although it did not affect their count. Atorvastatin reduced the frequency of CD4+CD28nullT-cells producing IFN-γ, while it increased the production of the anti-inflammatory cytokine IL-10 by CD4+CD25highT-cells.
We also explored the mechanisms through which atorvastatin might have immune-suppressive effects in ACS, analyzing the expression of relevant transcription factors and genes related to T-cell functional properties. We found that atorvastatin significantly reduced the expression of the chemokine receptor CCR2, involved in trans-endothelial migration of inflammatory cells, and of TLR4. Both CCR2 and TLR4 induce a series of downstream transcriptional factors, including FOS and EGR1, finally leading to the production of a large number of pro-inflammatory cytokines [22, 23, 24]. Furthermore, EGR1 reduces IL-10 expression at the post-transcriptional level [25].
Finally, we explored the in-vivo effects of atorvastatin, demonstrating that a single high-dose of atorvastatin had also in-vivo early effects on EGR1 mRNA expression and on EGR1 protein levels. Moreover, it reduced the frequency of CD4+CD28nullT-cells producing IFN-γ, and increased the production of the anti-inflammatory cytokine IL-10 by CD4+CD25highT-cells.
Effects of atorvastatin on CD4+T-cell functions
In ACS, CD4+CD28nullT-cells are increased in peripheral blood [26] and infiltrate unstable coronary plaques where they undergo clonal expansion [27], probably triggered by specific antigens [28].They produce pro-inflammatory cytokines, in particular IFN-γ [26], and express high levels of TRAIL, a member of the TNF family implicated in apoptosis of vascular smooth muscle cells [29]. By directly stimulating apoptosis of vascular smooth muscle cells or by activating macrophages to kill these ones trough IFN-γ production, CD4+CD28nullT-cells could weaken the fibrous cap and destabilize angiogenic vessels, precipitating atherosclerotic plaque rupture [30]. Moreover, these T-cells spontaneously express the subunit β1 of the IL-12 receptor even in the absence of antigenic stimulation, and respond to direct IL-12 stimulation with an increased expression of chemokine receptors that promote the tissue homing of effector T-cells [31]. In contrast, the anti-inflammatory cytokine IL-10 contributes to the atheroprotective effects of regulatory T-cells [32], and the expression of regulatory T-cells co-localizes with IL-10 within the atherosclerotic plaques [33]. ACS patients have a skewed helper T-cell differentiation oriented towards the expansion of aggressive effector T-cells and the reduction of Treg number and function [34]. These helper T-cell abnormalities characterize a sizeable proportion of ACS patients [10]. In this subset of ACS patients, the immune response might contribute to plaque destabilization through multiple damaging pathways [35].
Short-term treatment of ACS patients with statins is associated with a reduction of inflammatory markers [36], and with a rapid reduction in the intracellular production of TNF-α and IFN-γ by T-cells in-vitro [37]. Rosuvastatin, fluvastatin, and pitavastatin in-vitro treatment inhibits CD4+T-cell-induced endothelial cell apoptosis by suppressing T-cell activation and TRAIL expression upon activation [38]. In two previous observational reports we found that the use of statins was associated with reduced levels of CD4+CD28nullT cells [17, 2].
Furthermore, short-term treatment of ACS patients with statins is associated with a significant increase of regulatory T-cell inhibitory properties and a significant reduction of serum IFN-γ and increase of IL-10 [39, 40]. Statins may enhance regulatory T-cell responses by promoting their chemokine-dependent recruitment into inflammatory sites [21] and/or their differentiation in the periphery [19].
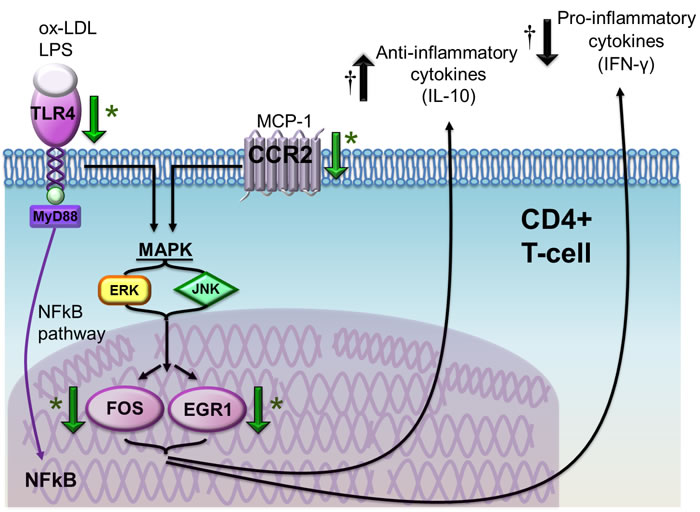
Figure 10: Schematic representation of the effects of atorvastatin on CD4+T-cells in patients with ACS. Atorvastatin decreases toll like receptor (TLR)-4 gene expression, a pattern-recognition receptor stimulated by several pathogen-associated molecular patterns (PAMPs) and damage associated molecular patterns (DAMPs), including bacterial lipolysaccaride (LPS) and ox-LDL, that has been implicated in the initiation and progression of atherosclerosis. TLR-4 stimulation induces intracellular pathways converging on nuclear factor (NF)-kB and mitogen-activated protein kinases (MAPK), with subsequent release of pro-inflammatory cytokines and expression of co-stimulatory molecules. Atorvastatin also reduces the expression of the chemokine (C-C motif) receptor 2 (CCR2), which is the receptor for monocyte chemoattractant protein (MCP)-1 and is involved in CD4+T-cell transendothelial migration and recruitment at the site of tissue damage and inflammation. CCR2 intracellular pathway also converges on MAPK pathway, resulting in the activation of ERK and JNK and, eventually, of nuclear transcription factors FBJ murine osteosarcoma viral oncogene homolog (FOS) and early growth response 1 (EGR1), implicated in the immune response. Indeed, we observed an important decrease of EGR1 gene and protein expression by a single high-dose of atorvastatin both ex-vivo and in-vivo, suggesting a specific direct effects of atorvastatin on EGR1. The final net effect is a reduction of pro-inflammatory cytokine secretion and of chemokine and chemokine receptor synthesis, and an increase of anti-inflammatory pathways. *Green arrows indicate the effects of atorvastatin according to molecular assays (reduced expression of the TLR4, CCR2, FOS and EGR1 genes and of EGR1 protein); † black arrows indicate the opposite effects of atorvastatin on IFN-γ (reduced intracellular expression by CD4+CD28nullT-cells) and IL-10 (increased intracellular expression by CD4+CD25highT-cells) as assessed by flow-cytometry.
Effects of atorvastatin on the expression of inflammatory genes and transcription factors involved in the immune response
In our study atorvastatin reduced TLR4 gene expression, a pattern-recognition receptor stimulated by several pathogen associated molecular patterns (PAMPs) and damage associated molecular patterns (DAMPs). TLR4 has been found in atherosclerotic lesions and at the site of plaque rupture in patients with MI [41]; its expression is increased in thrombi [42] and in circulating monocytes [43] from patients with ACS. TLR4 stimulation induces intracellular pathways converging on nuclear factor (NF)-kB and mitogen activated protein kinases (MAPK), with subsequent release of pro-inflammatory cytokines and expression of co-stimulatory molecules [23].
Atorvastatin also reduced the expression of the chemokine receptor CCR2, that is involved in CD4+T-cell transendothelial migration and recruitment at the site of tissue damage and inflammation [23]. CCR2 intracellular pathway also converges on MAPK and, downstream, on the nuclear transcription factors FOS and EGR1, both implicated in the immune response [22]. Indeed, we observed a decrease of the expression of these two transcription factors by atorvastatin. In particular, EGR1 gene showed the highest inhibition (Figure 10).
EGR1 is the prototype of a family of zinc-finger transcription factors, “immediate-early response proteins”, that is rapidly and transiently induced by a broad spectrum of extracellular signals, including growth factors, cytokines, injurious stimuli and many physiologic stimuli [44]. EGR1 is involved in cell growth, cell differentiation and cell survival [45]. EGR1 is expressed in T-cells and promotes T-cell activation and development by transcriptional induction of key cytokines, such as IL-2 and TNF-α, and costimulatory molecules, such as CD40 ligand, after T-cell receptor (TCR) stimulation [46, 22]. EGR1 also induces the transcriptional activation of T-bet, the master gene regulator of Th1 [47], a T-cell subsets involved in atherosclerosis progression and plaque destabilization [48].
Conversely, EGR1 reduces the expression of IL-10 at post-transcriptional level, by inducing the transcription of a microRNA (hsa-miR-106a) that degrades IL-10 mRNA [25]. EGR1 might also promote atherogenesis through the activation of inflammatory genes [49, 50]. Thus, we could speculate that, by reducing the expression of the transcription factor EGR1 in CD4+ T-cells, atorvastatin treatment might have the final net effect of reducing pro-inflammatory cytokine secretion, chemokine and chemokine receptor synthesis. This hypothesis is strongly supported by the in-vivo observation that a single high-dose of atorvastatin has early effects on EGR1 mRNA expression and, with a reasonable delay, on EGR1 protein levels. Moreover, it modifies the inflammatory profile of T-lymphocytes by decreasing IFN-γ production by aggressive effector T-cells, and increasing the production of the anti-inflammatory cytokine IL-10 by T-cells with a regulatory phenotype (Figure 10).
Although some of these beneficial effects have already been attributed to different statins in humans [51, 52] as well as in animal models [53] and in-vitro [54], our study investigates a comprehensive expression profile in ACS.
In the setting of ACS, it has been proposed that the early outcome improvement observed with intensive statin treatment, compared to a moderate treatment schedule, might be related to anti-inflammatory properties rather than to lipid-lowering effects. According to this, the improvement of short-term outcome associated to intensive statin treatment appeared to correlate with hs-CRP level reduction rather than with LDL-cholesterol level lowering [55]. However, hs-CRP is more likely a risk marker rather than a causal factor of atherosclerosis [56, 57]. The current data show that atorvastatin acts on the immune-response, offering a causal explanation on why statins ameliorate prognosis in ACS.
CONCLUSIONS
In ACS, ex-vivo atorvastatin treatment decreases the expression of transcription factors in T-cells, in particular the “immediate-early response protein” EGR1, resulting in inhibition of pro-inflammatory effector T-cells and activation of anti-inflammatory T-cells. EGR1 reduction by atorvastatin has also been confirmed in-vivo, after a single high-dose treatment. Therefore, in the setting of ACS, the early outcome improvement of intensive statin treatment might, at least partially, be related to direct inhibition of the master regulator EGR1 and to consequent immune-suppressive effects.
Some of the pathways inhibited by atorvastatin in the present study have recently been proposed as new therapeutic targets for the prevention of cardiovascular diseases. This is the case for the MCP-1/CCR2 pathway [58], the TLR4 pathway [59], and for a newly identified microRNA that functions as a negative regulator on inflammatory cytokines TNF-α and IL-6 via targeting EGR1 in vivo [60].
MATERIALS AND METHODS
Study population
We prospectively evaluated 334 consecutive patients admitted to our CCU from June 2011 to June 2013 with a diagnosis of NSTE-ACS. We enrolled 40 patients (Cohort 1) who had never received statin treatment and with circulating CD4+CD28nullT-cell frequency >4%, as our group has previously shown that CD4+CD28nullT-cell frequency >4% predicts recurrence of acute coronary events [2]. Ten additional patients (Cohort 2) were enrolled from November 2013 to May 2014 using the same inclusion criteria, to analyze the in-vivo effects of atorvastatin on EGR1 gene expression and protein levels.
Exclusion criteria were: 1) age >80 years; 2) evidence of inflammatory or infectious diseases, malignancies, immunologic or hematological disorders; 3) diabetes mellitus; 4) ejection fraction < 40%; 5) treatment with anti-inflammatory drugs other than low-dose aspirin.
The study was approved by the local ethics committee and appropriate consent was obtained from study patients.
Screening for CD4+CD28nullT-cell frequency
Immediately after CCU admission, 1 ml of whole blood anti-coagulated with EDTA was used to assess CD4+CD28nullT-cell frequency by flow cytometry, using anti-CD4 fluorescin-isothiocyanate (FITC) conjugated and anti-CD28 phycoerythrin-Cy5 (PE-Cy5) conjugated monoclonal antibodies (all Beckman Coulter, Brea, CA). After the initial screening, venous peripheral blood samples were obtained from patients with circulating CD4+CD28nullT-cell frequency >4%.
Isolation of CD4+T-cells and atorvastatin treatment
Peripheral blood mononuclear cells (PBMCs) were obtained from whole blood samples by standard gradient centrifugation over Ficoll-Hypaque (GE Healthcare Bio-Sciences, Piscataway, NJ). CD4+T-cells were isolated by magnetic micro-beads (CD4+T-cell isolation kit MACS, Miltenyi Biotec, Auburn, CA) according to the manufacturer’s instructions. Pure atorvastatin, kindly provided by Pfizer (New York, NY), was dissolved in 2% dimethilsulfoxide (DMSO) solution at final concentration of 50mM. CD4+T-cells were incubated for 24 hours, under sterile conditions at 37°C in an atmosphere containing 5% CO2, at a density of 1 x 10⁶/ml in RPMI 1640 medium (Sigma, St. Louis, MO) supplemented with 10% fetal bovin serum (Invitrogen, Carlsbad, CA) with and without increasing doses of atorvastatin: 3-10-26 μg/ml. These doses were chosen on the basis of the observation that comparable plasmatic concentrations correspond to in vivo doses of 10-40-80 mg of atorvastatin [61].
T-cell analysis by flow cytometry
In Cohort 1 patients, phenotypic and functional characteristics of CD4+T-cells treated/untreated with atorvastatin were assessed by flow-cytometry using fluorochrome-conjugated monoclonal anti-human antibody (mAb), including isotype controls. Flow-cytometry quantization was performed on 40.000 live cells. Data acquisition was performed using a FC500 Flow Cytometry System (Beckman Coulter, Brea, CA) and data analysis using the Kaluza® analysis software packages (Beckman Coulter, Brea, CA).
We assessed total CD4+, CD4+CD28null, CD4+CD25high, CD4+CD25highFoxp3+T-cells. We also determined IFN-γ production by CD4+CD28nullT-cells and IL-10 production by CD4+CD25highT-cells upon stimulation.
CD4+CD28null T-cell frequency was determined using anti-CD4-fluorescinisothiocyanate (FITC)-conjugated mAb and anti-CD28-phycoerythrin-Cy5(PE-Cy5)-conjugated mAb (both Beckman Coulter, Brea, CA). The percentage of CD4+CD28nullT-cells was expressed as percentage of the entire population of CD4+T-cells.
CD4+CD25highT-cell frequency was obtained using monoclonal anti-CD4-FITC-labeled and monoclonal anti-human CD25-APC-labeled, on the basis of high CD25-APC fluorescence in comparison with intermediate CD25-APC fluorescence in CD4+CD25+T-cells. After cell surface staining, cell fixation and permeabilization, cells were stained with the intracellular PE-conjugated anti-Foxp3 mAB (eBioscience, San Diego, CA). The percentage of CD4+CD25highT-cells and of CD4+CD25highT-cells expressing Foxp3+T-cells was then calculated as percentage of CD4+CD25+T-cell population.
In order to evaluate T-cell function, we determined IFN-γ production by CD4+CD28nullT-cells and IL-10 production by CD4+CD25highT-cells upon stimulation. In the assessment of IL-10 production, regulatory T-cells were identified as CD4+CD25high T-cells, in order to avoid a stressful cell-handling as required to perform permeabilization for intra-cytoplamasmatic and intra-nuclear protein assessment, potentially resulting in a less accurate measurement of IL-10. A significant correlation was observed between CD4+CD25highT-cells and CD4+CD25high Foxp3+T-cells (R = 0.67; P < 0.001). Briefly, cytokines production by CD4+T-cell subsets was assessed after 4-hours in vitro activation with 100 ng/ml phorbol-2-myristate-13-acetate (PMA) (Sigma, St. Louis, MO) and 1µg/ml ionomycin (Sigma, St. Louis, MO). Cells were incubated in polypropylene tubes at 37°C for a total of 4 hrs; during the last 2 hrs, 10 µg/mL Brefeldin A (Sigma, St. Louis, MO) was added to block extracellular secretion of cytokines. After cell surface staining, cell fixation was done with IC FIX Buffer (eBioscience, San Diego, CA) for 15 min at 4°C. Cell membranes were reversibly permeabilized with Permeabilization Buffer (eBioscience, San Diego, CA) and intracellular cytokines were labeled with mouse anti-human IFN-γ PE-conjugated (eBioscience, San Diego, CA) and mouse anti-human IL-10 Peridinin-Chlorophyll-Protein-Complex (PerCP)-conjugated (R&D Systems, Minneapolis, MN). In addition, IFN-γ and IL-10 intracellular expression was presented as MFI.
Cytokine measurements
In the same patients of Cohort 1, citrate whole-blood samples were collected from an antecubital vein at the time of patient enrollment. Immediately after sampling, aliquots of 1 mL of whole blood were incubated for 24 hours under sterile conditions at 37°C in an atmosphere containing 5% CO2 without and with increasing doses of atorvastatin: 3, 10, 26 μg/ml. Afterwards, plasma samples were obtained, stored at -80°C and analysed in a single bath at the end of the study. Plasma levels of IL-10 and IFN-γ were measured with high-sensitivity ELISA kits (human-IL-10, Aushon Biosystems, Billerica, MA; human-IFN-γ, Bender MedSystem, Vienna, Austria), according to the manufacturer’s instructions. The linear range of detection was 0.78 to 200 pg/ml for IL-10 and 1.6 to 100 pg/ml for IFN-γ. All samples were measured in duplicate, and the intra- and inter-assay variability was < 10%.
RNA preparation and quantitative PCR array analysis
Patients in Cohort 1 underwent quantitative PCR array. CD4+T-cells were incubated for 24 hours without and with 26 µg/ml of atorvastatin (see above). Total RNA was isolated by using RNeasy minikit (Qiagen, Valencia, CA) from 3x10⁶ CD4+T-cells per patient. RNA was quantified using a Picodrop spectrophotometer measuring the absorbance at 260/280 nm, and RNA integrity was confirmed with the Agilent Bioanalyzer (Agilent Technologies, Santa Clara CA). For each condition (untreated/treated with atorvastatin) a pool of RNA was constituted, starting with the same amount of RNA (500 ng) from each patient.
Array targets were prepared from 435 ng of total RNA from each pool (untreated/treated with atorvastatin) using SABiosciences Kit for genomic DNA removal and reverse transcription, and two focused panels of genes were analyze by quantitative PCR array (RT² Profiler™ PCR Array, SABiosciences, Frederick, MD, USA). We performed the Human Transcription Factors RT² Profiler™ PCR Array (Catalog #PAHS-075) and the Human Th1-Th2-Th3 RT² Profiler™ PCR Array (Catalog #PAHS-034) both profiling the expression of 84 genes, according to the manufacturer’s instruction. Thermal cycling parameters were 95°C for 10 min, followed by 40 cycles of amplifications at 95°C for 15 s, 55°C for 30 s, 72°C for 30 s, and 72°C for 5 min as the final elongation step performed on IQ5 Icycler (BioRad). Relative levels of mRNA expression were normalized in all samples with the expression levels of housekeeping genes, and data analysis was done using the Web portal (http://www.sabiosciences.com/pcr/arrayanalysis.php). The relative expression of each gene was compared with the expression in the control group and calculated using the ΔΔCT method. Each reported value represented the mean decrease (or increase) of mRNA expression relative to the control levels. A P-value of ≤0.05 and a fold change in gene expression of >3 were taken as significant.
Quantitative real-time RT-PCR
Confirmation and validation of candidate genes was performed by real time quantitative polymerase chain reaction (RT-qPCR) after reverse transcription of RNA obtained from each single patient of Cohort 1 using the iScriptTM cDNA Synthesis Kit (BioRad Laboratories, Hercules, CA). For each patient 250 ng of RNA from CD4+T-cells untreated/treated with atorvastatin was used to synthesize cDNA in a final volume of 20 µl. 1 µl of cDNA was used as template for RT-qPCR in a 15 µl reaction mixture, including SsoAdvancedTM SYBR® Green supermix (BioRad) and 400 nm of each primer. Oligonucleotide primers for RT-qPCR were designed with Beacon Design (Table 4). RT-qPCR was performed on triplicates samples using the IQ5 Icycler (BioRad). After initial denaturation step of 30 sec at 95°C, a two-steps cycling procedure (denaturation at 95°C for 5 sec, annealing and extension at 64°C for 30sec) was performed for 40 cycles and followed by melting curve at 95°C for 6 sec. Data are normalized to human β-2-microglobulin (β-2MG) and glyceraldehyde-3-phosphate dehydrogenase (GAPDH) mRNA levels as an endogenous control and are expressed relative to control sample using the formula 2-∆∆CT, where CT is the threshold cycle number.
Also, the in-vivo effect of atorvastatin on EGR1 gene expression was assessed by RT-qPCR.
Table 4: Oligonucleotide primers used for real time quantitative polymerase chain reaction.
GeneBank accession number |
Gene name |
Primers 5’-3’ |
NM_001964 |
Early growth response (EGR1) |
For GAGCAGCCCTACGAGCAC Rev GTCTCCACCAGCACCTTCTC |
NM_005252 |
V-fos FBJ murine osteosarcoma viral oncogene homolog (FOS) |
For GACCTTATCTGTGCGTGAA Rev CACTGGGAACAATACACACT |
NM_001123396 |
Chemokine (C-C motif) receptor 2 (CCR2) |
For GCATTCAGCCAGGAGATG Rev ATCATCGGACTCCACCAA |
NM_138554 |
Toll-like receptor 4 (TLR4) |
For GCCCTGCGTGGAGGTGGTT Rev GGGGAGGTTGTCGGGGATTTTGT |
NM_004048 |
β-2-Microglobulin (B2M) |
For AGGACTGGTCTTTCTATCTCTTGT Rev ACCTCCATGATGCTGCTTACA |
NM_002046 |
Glyceraldehyde-3-phosphate dehydrogenase (GAPDH) |
For AGTCAGCCGCATCTTCTT Rev GCCCAATACGACCAAATCC |
Confirmation and validation of candidate genes among those reduced or increased by atorvastatin was performed by real time quantitative polymerase chain reaction (RT-qPCR) after reverse transcription of single-patient RNA.
Western-blot assays
We also explored whether atorvastatin treatment might influence protein expression levels of EGR1, both ex-vivo and in-vivo. Western-blot analysis was carried out in CD4+T-cells (1x10⁶) cultured for 24 hours with and without 26 μg/ml atorvastatin. Western blot was performed using whole-cell extracts (25 μg per lane). Protein were resolved on 7% SDS-PAGE gels and transferred to nitrocellulose membranes. Membranes were blocked with 5% non-fat milk in phosphate buffered saline and 1% Tween-20 (TBS) and labeled with primary antibodies (all from Santa Cruz Biotechnology, Dallas, Tx): mouse monoclonal IgG1 anti-human β-actin (sc-130301) and rabbit polyclonal IgG anti-human EGR1 p82 (588, sc-110). To saving samples, materials, and time we stripped and re-probed a single membrane for multiple targets instead of running and blotting multiple gels. Membranes were stripped with a buffer consisting of β-mercaptoethanol, SDS, and Tris-HCl and re-probed with the specific antibodies. Then, specific bands were detected by a chemiluminescent system (ChemiDoc MP System, Biorad) using corresponding secondary antibodies conjugated with horseradish peroxidase.
Also, the in-vivo effect of atorvastatin on EGR1 protein expression was assessed by western-blot.
In-vivo effects of atorvastatin
In-vivo effects of atorvastatin on EGR1 gene expression and protein levels were analyzed in Cohort 2 patients treated with atorvastatin 80 mg/daily, at 24 hours and 48 hours of treatment, by RT-qPCR and by western-blotting, respectively (see above).
We also determined the in-vivo effects of atorvastatin on IFN-γ production by CD4+CD28nullT-cells and IL-10 production by CD4+CD25highT-cells upon stimulation by flow cytometry (see above).
Statistical analysis
No power calculation could be performed because of lack of previous studies in this setting. Thus, the enrollment of 40 patients in Cohort 1 and of 10 patients in Cohort 2 was arbitrary.
The percentage of T-cell subsets along with cytokine production by these T-cells, were not normally distributed; they were expressed as median and range and analyzed using the Friedman’s two-way analysis of variance by ranks for multiple pairwise comparisons with Dunnet’s correction. The remaining continuous variables, including gene and protein expression were normally distributed; they were expressed as mean±SD and were compared using 1-way ANOVA for repeated measures with the Bonferroni correction for multiple pairwise comparisons or using the paired t-test, as appropriate. Proportions were compared using the Chi square test.
Univariate logistic regression analysis was applied to individuate the variables associated with the effects of atorvastatin (a reduction of CD4+CD28nullT-cells producing IFNγ and/or an increase of CD4+CD25highT-cells producing IL-10 higher than 50% after incubation with atorvastatin 26 μg/ml). The following clinical and laboratory variables were tested: age, sex, classical risk factors, previous history of acute coronary events, left ventricular ejection fraction, multi-vessel disease, troponin T levels, lipid profile (total-cholesterol, LDL-cholesterol, and HDL-cholesterol). At univariate logistic regression analysis none of the variables considered, including lipid profile, demonstrated any association with effects of atorvastatin. Therefore, the multivariate analysis was not performed.
A two-tailed P value < 0.05 was considered statistically significant. Statistical analysis was performed with SPSS 18.0 software (SPSS Inc., Chicago, Illinois).
Abbreviations
INF-γ = Interferon-γ
ACS = Acute Coronary Syndromes
IL-10 = Interleukin-10
NSTE = Non-ST Elevation
EGR1 = Early Growth Response 1
TLR4 = Toll-like Receptor-4
CCR2 = Chemokine (C-C motif) Receptor-2
PAMPs = Pathogen Associated Molecular Patterns
DAMPs = Damage Associated Molecular Patterns
TCR = T-cell Receptor
NF-kB = Nuclear Factor-kB
ACKNOWLEDGMENTS
The authors would like to thank the Coronary Care Unit staff of the “Policlinico A.Gemelli”, Catholic University of the Sacred Heart for its invaluable help, support and patience.
CONFLICTs OF INTEREST
None to declare.
SOURCES OF FUNDING
This work was supported by an unrestricted grant of Pfizer (New York, NY) and partially by “Ministero dell’Istruzione dell’Università e della Ricerca Scientifica” [progetto strategico di ricerca finalizzata 2010: “Caratterizzazione del profilo protrombotico ed infiammatorio/immunitario di pazienti con sindrome coronarica acuta a differente rischio, con approccio genomico e proteomico”].
DISCLOSURES
This work was supported by an unrestricted grant of Pfizer (New York, NY).
Author contributions
Dr. Giovanna Liuzzo, Dr. Anna Severino and Dr. Chiara Zara have conceived and designed the study and contributed to data interpretation.
Dr. Liuzzo and Dr. Daniela Pedicino have drafted the manuscript.
Dr. Simona Giubilato, Dr. Vincenzo Pazzano, Dr. Ada F. Giglio, Dr. Francesco Trotta, Dr. Claudia Lucci, Dr. Antonio Iaconelli, Dr. Aureliano Ruggio have crucially participated in data collection and analysis of patients with acute coronary syndromes.
Dr. Chiara Zara, Dr. Mara Campioni, Dr. Davide Flego and Dr. Giulia Angelini have collected and analyzed all the biological parameters, including T-cell analysis by flow-cytometry, cytokine measurements, and quantitative PCR array analysis.
Dr. Giovanna Liuzzo, Dr. Luigi Marzio Biasucci and Dr. Filippo Crea have revised critically the manuscript for important intellectual content.
Dr. Filippo Crea has also given the final approval of the manuscript submitted.
REFERENCES
1. Hansson GK. Inflammation, atherosclerosis, and coronary artery disease. N Engl J Med. 2005; 352:1685-1695. doi: 10.1056/NEJMra043430.
2. Liuzzo G, Biasucci LM, Trotta G, Brugaletta S, Pinnelli M, Digianuario G, Rizzello V, Rebuzzi AG, Rumi C, Maseri A, Crea F. Unusual CD4+ CD28null T lymphocytes and recurrence of acute coronary events. J Am CollCardiol. 2007; 50:1450-1458. doi:10.1016/j.jacc.2007.06.040.
3. Giubilato S, Liuzzo G, Brugaletta S, Pitocco D, Graziani F, Smaldone C, Montone RA, Pazzano V, Pedicino D, Biasucci LM, Ghirlanda G, Crea F. Expansion of CD4+CD28null T lymphocytes in diabetic patients: exploring new pathogenetic mechanisms of increased cardiovascular risk in diabetes mellitus. Eur Heart J. 2011; 32:1214-1226. doi:10.1093/eurheartj/ehq499.
4. Sakaguchi S, Miyara M, Costantino CM, Hafler DA. FOXP3+ regulatory T cells in the human immune system. Nature Rev Immunol. 2010; 10:490-500. doi:10.1038/nri2785.
5. Brusko TM, Putnam AL, Bluestone JA. Human regulatory T cells: role in autoimmune disease and therapeutic opportunities. Immunol Rev. 2008; 223:371-390. doi: 10.1111/j.1600-065X.2008.00637.x.
6. Flego D, Severino A, Trotta F, Previtero M, Ucci S, Zara C, Massaro G, Pedicino D, Biasucci LM, Liuzzo G, Crea F. Increased PTPN22 expression and defective CREB activation impair regulatory T-cell differentiation in non-ST-segment elevation acute coronary syndromes. J Am Coll Cardiol. 2015; 65:1175-1186. doi: 10.1016/j.jacc.2015.01.027.
7. Mor A, Luboshits G, Planer D, Keren G, George J. Altered status of CD4(+) CD25(+) regulatory T cells in patients with acute coronary syndromes. Eur Heart J. 2006; 27:2530-2537. doi:10. 1093/eurheartj/ehl222.
8. Chalikias GK, Tziakas DN, Kaski JC, Kekes A, Hatzinikolaou EI, Stakos DA, Tentes IK, Kortsaris AX, Hatseras DI. Interleukin-18/interleukin-10 ratio is an independent predictor of recurrent coronary events during a 1-year follow-up in patients with acute coronary syndrome. Int J Cardiol. 2007; 117:333-339. doi:10.1016/j.ijcard.2006.05.017.
9. Mälarstig A, Eriksson P, Hamsten A, Lindahl B, Wallentin L, Siegbahn A. Raised interleukin-10 is an indicator of poor outcome and enhanced systemic inflammation in patients with acute coronary syndrome. Heart. 2008; 94:724-729. doi:10.1136/hrt.2007.119271.
10. Liuzzo G, Montone RA, Gabriele M, Pedicino D, Giglio AF, Trotta F, Galiffa VA, Previtero M, Severino A, Biasucci LM, Crea F. Identification of unique adaptive immune system signature in acute coronary syndromes. Int J Cardiol. 2013; 168:564-567. doi:10.1016/j.ijcard.2013.01.009.
11. Morrow DA, de Lemos JA, Sabatine MS, Wiviott SD, Blazing MA, Shui A, Rifai N, Califf RM, Braunwald E. Clinical relevance of C-reactive protein during follow-up of patients with acute coronary syndromes in the Aggrastat-to-Zocor Trial. Circulation. 2006; 114:281-288. doi: 10.1161/CIRCULATIONAHA.106.628909.
12. Nissen SE, Tuzcu EM, Schoenhagen P, Crowe T, Sasiela WJ, Tsai J, Orazem J, Magorien RD, O’Shaughnessy C, Ganz P. Reversal of Atherosclerosis with Aggressive Lipid Lowering (REVERSAL) Investigators. Statin therapy, LDL cholesterol, C-reactive protein, and coronary artery disease. N Engl J Med. 2005; 352:29-38. doi: 10.1056/NEJMoa042000.
13. Ridker PM, Cannon CP, Morrow D, Rifai N, Rose LM, McCabe CH, Pfeffer MA, Braunwald E. Pravastatin or Atorvastatin Evaluation and Infection Therapy-Thrombolysis in Myocardial Infarction 22 (PROVE IT-TIMI 22) Investigators. C-reactive protein levels and outcomes after statin therapy. N Engl J Med. 2005; 352:20-28 doi: 10.1056/NEJMoa042378.
14. Blanco-Colio LM, Muñoz-García B, Martín-Ventura JL, Lorz C, Díaz C, Hernández G, Egido J. 3-Hydroxy-3-Methylglutaryl Coenzyme A reductase inhibitors decrease Fas ligand expression and cytotoxicity in activated human T lymphocytes. Circulation. 2003; 108:1506-1513. doi:10.1161/01.CIR.0000089086.48617.2B.
15. Dunn SE, Youssef S, Goldstein MJ, Prod’homme T, Weber MS, Zamvil SS, Steinman L. Isoprenoids determine Th1/Th2 fate in pathogenic T cells, providing a mechanism of modulation of autoimmunity by atorvastatin. J Exp Med. 2006; 203:401-412 doi: 10.1084/jem.20051129.
16. Youssef S, Stüve O, Patarroyo JC, Ruiz PJ, Radosevich JL, Hur EM, Bravo M, Mitchell DJ, Sobel RA, Steinman L, Zamvil SS. The HMG-CoA reductase inhibitor, atorvastatin, promotes a Th2 bias and reverses paralysis in central nervous system autoimmune disease. Nature. 2002; 420:78-84.
17. Brugaletta S, Biasucci L M, Pinnelli M, Biondi-Zoccai G, Di Giannuario G, Trotta G, Liuzzo G, Crea F. Novel anti-inflammatory effect of statins: reduction of CD4+CD28null T lymphocyte frequency in patients with unstable angina. Heart. 2006; 92:249-250. doi:10.1136/hrt.2004.052282.
18. Link A, Selejan S, Hewera L, Walter F, Nickenig G, Böhm M. Rosuvastatin induces apoptosis in CD4+CD28null T cells in patients with acute coronary syndromes. Clin Res Cardiol. 2011; 100:147-158. doi: 10.1007/s00392-010-0225-8
19. Kim YC, Kim KK, Shevach EM. Simvastatin induces Foxp3+ T regulatory cells by modulation of transforming growth factor-beta signal transduction. Immunology. 2010; 130:484-493. doi:10.1111/j.1365-2567.2010.03269.x.
20. Mausner-Fainberg K1, Luboshits G, Mor A, Maysel-Auslender S, Rubinstein A, Keren G, George J. The effect of HMG-CoA reductase inhibitors on naturally occurring CD4+CD25+ T cells. Atherosclerosis. 2007; 197:829-839. doi:10.1016/j.atherosclerosis. 2007. 07.031.
21. Mira E, León B, Barber DF, Jiménez-Baranda S, Goya I, Almonacid L, Márquez G, Zaballos A, Martínez-A C, Stein JV, Ardavín C, Mañes S. Statins induce regulatory T cell recruitment via a CCL1 dependent pathway. J Immunol. 2008; 181:3524-3534. doi: 10.4049/jimmunol.181.5.3524.
22. Gómez-Martín D, Díaz-Zamudio M, Galindo-Campos M, Alcocer-Varela J. Early growth response transcription factors and the modulation of immune response: implications towards autoimmunity. Autoimmun Rev. 2010; 9:454-58. doi:10.1016/j.autrev.2009.12.006.
23. Kawai T, Akira S. The role of pattern-recognition receptors in innate immunity: update on Toll-like receptors. Nat Immunol. 2010; 11:373-384. doi:10.1038/ni.1863.
24. Kolattukudy PE, Niu J. Inflammation, Endoplasmic Reticulum Stress, Autophagy, and the Monocyte Chemoattractant Protein-1/CCR2 Pathway. Circ Res. 2012; 110:174-89. doi: 10.1161/CIRCRESAHA.111.243212.
25. Sharma A, Kumar M, Aich J, Hariharan M, Brahmachari SK, Agrawal A, Ghosh B. Posttranscriptional regulation of interleukin-10 expression by hsa-miR-106a. Proc Natl AcadSci U S A. 2009; 106:5761-5766. doi: 10.1073/pnas.0808743106.
26. Liuzzo G, Kopecky SL, Frye RL, O’Fallon WM, Maseri A, Goronzy JJ, Weyand CM. Perturbation of the T-cell repertoire in patients with unstable angina. Circulation. 1999; 100:2135-9. doi: 10.1161/01.CIR.100.21.2135.
27. Liuzzo G, Goronzy JJ, Yang H, Kopecky SL, Holmes DR, Frye RL, Weyand CM. Monoclonal T cell proliferation and plaque instability in acute coronary syndromes. Circulation. 2000; 101:2883-2888. doi:10.1161/01.CIR.101.25.2883.
28. Zal B, Kaski JC, Arno G, Akiyu JP, Xu Q, Cole D, Whelan M, Russell N, Madrigal JA, Dodi IA, Baboonian C. Heat-shock protein 60-reactive CD4+CD28null T cells in patients with acute coronary syndromes. Circulation. 2004; 109:1230-1235.doi: 10.1161/01.CIR.0000118476.29352.2A.
29. Sato K, Niessner A, Kopecky SL, Frye RL, Goronzy JJ, Weyand CM. TRAIL-expressing T cells induce apoptosis of vascular smooth muscle cells in the atherosclerotic plaque. J Exp Med. 2006; 203:239-250. doi: 10.1084/jem.20051062.
30. Dumitriu IE, Araguas ET, Baboonian C, Kaski JC. CD4+ CD28 null T cells in coronary artery disease: when helpers become killers. Cardiovasc Res. 2009; 81:11-19. doi: 10.1093/cvr/.
31. Zhang X, Niessner A, Nakajima TMa-Krupa W, Kopecky SL, Frye RL, Goronzy JJ, Weyand CM. Interleukin 12 induces T-cell recruitment into the atherosclerotic plaque. Circ Res. 2006; 98:524-31. doi: 10.1161/01.RES.0000204452.46568.5.
32. Ait-Oufella H, Salomon BL, Potteaux S, Robertson AK, Gourdy P, Zoll J, Merval R, Esposito B, Cohen JL, Fisson S, Flavell RA, Hansson GK, Klatzmann D, Tedgui A, Mallat Z. Natural regulatory T cells control the development of atherosclerosis in mice. Nat Med. 2006; 12:178-180. doi:10.1038/nm1343
33. Heller EA, Liu E, Tager AM, Yuan Q, Lin AY, Ahluwalia N, Jones K, Koehn SL, Lok VM, Aikawa E, Moore KJ, Luster AD, Gerszten RE. Chemokine CXCL10 promotes atherogenesis by modulating the local balance of effector and regulatory T cells. Circulation. 2006; 113:2301-2312. doi: 10.1161/CIRCULATIONAHA.105.605121.
34. Caligiuri G, Nicoletti A. Lymphocyte responses in acute coronary syndromes: lack of regulation spawns deviant behavior. Eur Heart J. 2006; 27:2485-2486. doi: http://dx.doi.org/10.1093/eurheartj/ehl284.
35. Crea F, Liuzzo G. Pathogenesis of acute coronary syndromes. J Am CollCardiol. 2013. 61:1-11. doi:10.1016/j.jacc.2012.07. 064.
36. Kinlay S, Schwartz GG, Olsson AG, Rifai N, Leslie SJ, Sasiela WJ, Szarek M, Libby P, Ganz P. Myocardial Ischemia Reduction with Aggressive Cholesterol Lowering Study Investigators. High-dose atorvastatin enhances the decline in inflammatory markers in patients with acute coronary syndromes in the MIRACL study. Circulation. 2003; 108:1560-1566. doi: 10.1161/01.CIR.0000091404.09558.AF.
37. Link A, Ayadhi T, Böhm M, Nickenig G. Rapid immunomodulation by rosuvastatin in patients with acute coronary syndrome. Eur Heart J. 2006; 27:2945-2955. doi: http://dx.doi.org/10.1093/eurheartj/ehl277.
38. Sato K, Nuki T, Gomita K, Weyand CM, Hagiwara N. Statins reduce endothelial cell apoptosis via inhibition of TRAIL expression on activated CD4 T cells in acute coronary syndrome. Atherosclerosis. 2010; 213:33-39. doi: 10.1016/j.atherosclerosis.
39. Hu Z, Li D, Hu Y, Yang K. Changes of CD4+CD25+ regulatory T cells in patients with acute coronary syndrome and the effects of atorvastatin. J Huazhong Univ Sci Technolog Med Sci. 2007; 27:524-527. Doi:10.1007/s11596-007-0512-4.
40. Li JJ, Li YS, Fang CH, Hui RT, Yang YJ, Cheng JL, Gao RL. Effects of simvastatin within two weeks on anti-inflammatory cytokine interleukin 10 in patients with unstable angina. Heart. 2006; 92:529-30. doi:10.1136/hrt. 2004.057489.
41. Ishikawa Y, Satoh M, Itoh T, Minami Y, Takahashi Y, Akamura M. Local expression of toll-like receptor 4 at the site of ruptured plaques in patients with acute myocardial infarction. Clin Sci. 2008; 115:133-140. doi:10.1042/CS20070379.
42. Spanaus KS, Yonekawa K, Wischnewsky MB, Corti R, Kucher N, Roffi M, Eberli FR, Amann-Vesti B, Gay S, von Eckardstein A, Lüscher TF, Maier W. Cellular actors, Toll-like receptors, and local cytokine profile in acute coronary syndromes. Eur Heart J. 2010; 31:1457-1469. doi: 10.1093/eurheartj/ehq084.
43. Methe H, Kim JO, Kofler S, Weis M, Nabauer M, Koglin J. Expansion of circulating Tol-like receptor 4-positive monocytes in patients with acute coronary syndrome. Circulation. 2005; 111:2654-61. doi: 10.1161/CIRCULATIONAHA.104.498865.
44. Thiel G, Cibelli G. Regulation of life and death by the zinc finger transcription factor Egr-1.J Cell Physiol. 2002; 193:287-292. doi: 10.1002/jcp.10178.
45. Dias S, Xu W, McGregor S, Kee B. Transcriptional regulation of lymphocyte development. CurrOpin Genet Dev. 2008; 18:441-448. doi: 10.3390/biom5021020.
46. Bettini M, Xi H, Milbrandt J, Kersh GJ. Thymocyte development in early growth response gene 1-deficient mice. J Immunol. 2002; 169:1713-1720. doi: 10.4049/jimmunol.169.4.1713.
47. Shin HJ, Lee JB, Park SH, Chang J, Lee CW. T-bet expression is regulated by EGR1-mediated signaling in activated T cells. Clinical immunology. 2009; 131: 285-394. doi:10.1016/j.clim.2009.02.009.
48. Methe H, Brunner S, Wiegand D, Nabauer M, Koglin J, Edelman ER. Enhanced T-helper-1 lymphocyte activation patterns in acute coronary syndromes. 2005; 45:1939-1945. doi:10.1016/j.jacc.2005.03.040.
49. Harja E, Bucciarelli LG, Lu Y, Stern DM, Zou YS, Schmidt AM, Yan SF. Early growth response-1 promotes atherogenesis: mice deficient in early growth response-1 and apolipoprotein E display decreased atherosclerosis and vascular inflammation. Circ Res. 2004; 94: 333-339. doi: 10.1161/01.RES.0000112405.61577.95.
50. Khachigian LM. Early growth response-1 in cardiovascular pathobiology. Circ Res. 2006; 98:186-191. doi: 10.1161/01.RES.0000200177.53882.c3.
51. Niessner A, Steiner S, Pleiner J, Seidinger D, Maurer G, Goronzy JJ, Weyand CM, Kopp CW, Huber K, Wolzt M, Wojta J. Simvastatin suppresses endotoxin-induced upregulation of toll-like receptors 4 and 2 in vivo. Atherosclerosis. 2006; 189:408-413. doi:10.1016/j.atherosclerosis.2005.12.022.
52. Zhang X, Jin J, Peng X, Ramgolam VS, Markovic-Plese S. Simvastatin inhibits IL-17 secretion by targeting multiple IL-17-regulatory cytokines and by inhibiting the expression of IL-17 transcription factor RORC in CD4+ lymphocytes. J Immunol. 2008; 180:6988-9696. doi: 10.4049/jimmunol.180.10.6988.
53. Bea F, Blessing E, Shelley MI, Shultz JM, Rosenfeld ME. Simvastatin inhibits expression of tissue factor in advanced atherosclerotic lesions of apolipoprotein E deficient mice independently of lipid lowering: potential role of simvastatin-mediated inhibition of Egr-1 expression and activation. Atherosclerosis. 2003; 167:187-194. doi:10.1016/S0021-9150(02)00387-8.
54. Lamon BD, Summers BD, Gotto AM Jr, Hajjar DP. (2009) Pitavastatin suppresses mitogen activated protein kinase-mediated Erg-1 induction in human vascular smooth muscle cells. Eur J Pharmacol. 606:72-76. doi: 10.1016/j.ejphar.2008.12.047.
55. Nissen SE. High-dose statins in acute coronary syndromes: not just lipid levels. JAMA. 2004; 292:1365-1367. doi:10.1001/jama.292.11.1365.
56. Libby P, Crea F. Clinical implications of inflammation for cardiovascular primary prevention. Eur Heart J. 2010; 31:777-783. doi: 10.1093/eurheartj/ehq022.
57. Zacho J, Tybjærg-Hansen A, Jensen JS, Grande P, Sillesen H, Nordestgaard BG. Genetically elevated C-reactive protein and ischemic vascular disease. N Engl J Med. 2008; 359:1897-1908. doi:10.1038/nature01158.
58. Gilbert J, Lekstrom-Himes J, Donaldson D, Lee Y, Hu M, Xu J, Wyant T, Davidson M; MLN1202 Study Group. Effect of CC chemokine receptor 2 CCR2 blockade on serum C-reactive protein in individuals at atherosclerotic risk and with a single nucleotide polymorphism of the monocyte chemoattractant protein-1 promoter region. Am J Cardiol. 2011; 107:906 -911. doi: 10.1016/j.amjcard.2010.11.005.
59. Stoll LL, Denning GM, Weintraub NL. Endotoxin, TLR4 signaling and vascular inflammation: potential therapeutic targets in cardiovascular disease. Curr Pharm Des. 2006; 12:4229-4245. doi: http://dx.doi.org/10.2174/138161206778743501.
60. Zhang J, Xie S, Ma W, Teng Y, Tian Y, Huang X, Zhang Y. A newly identified microRNA, mmu-miR-7578, functions as a negative regulator on inflammatory cytokines tumor necrosis factor-α and interleukin-6 via targeting Egr1 in vivo. J Biol Chem. 2013; 288:4310-4320. doi: 10.1074/jbc.M112.351197.
61. Shitara Y, Sugiyama Y. Pharmacokinetic and pharmacodynamic alterations of 3-hydroxy-3-methylglutaryl coenzyme A (HMG-CoA) reductase inhibitors: Drug-drug interactions and interindividual differences in transporter and metabolic enzyme functions. Pharmacology & Therapeutics. 2006; 112:71-105. doi:10.1016/j.pharmthera.2006.03.003.