
Tumors usually rise from normal cells with tissue specific acquired mutations or aberrations in their genomic materials [1]. Copy number variation (CNV) is one of the most important somatic aberrations [1-4]. CNV was initially defined as the amplification or deletion of genetic materials in the size of >1kb [5, 6], then was widened to include much smaller events (>50 bp) [7] on accounting of the greatly improved resolution of detection methods. Tumor genomes usually acquire somatic CNVs during carcinogenesis, and the amplification of oncogenes or deletion of tumor suppressor genes are usually pathogenic, as the expression level of a gene is highly correlated to its copy number [8]. In searching for oncotargets, genomic regions with recurrent CNVs in tumor genomes are believed to have high probability of containing cancer genes [9]. Indeed, quite a few cancer-related genes have been identified to be affected by somatic CNVs [4, 10-13]. This list of CNV related oncotargets includes ERBB2, EGFR, MYC, PIK3CA, IGF1R, FGFR1/2, KRAS, CDK4, CCND1, MDM2, MET, CDK6 for amplification, and RB1, PTEN, CDKN2A/B, ARID1A, MAP2K4, NF1, SMAD4, BRCA1/2, MSH2/6, DCC, CDH1 for deletion. Different patterns of somatic mutations may divide one type of cancer into different subgroups, and the prognostics and treatment responses of the subgroups could be very different [8, 14]. For example, Trastuzumab is effective only to breast cancers in which ERBB2 is amplified and over expressed [15-18]. The identification of such somatic events should facilitate prognosis and treatment decision [14]. Therefore, accurate CNVs detection is an essential part of cancer genome analysis, which holds great promise to improve cancer diagnosis and treatment decision.
An ideal CNV detection method should accurately quantify the copy numbers in all genomic segments and delineate their breakpoints across the whole genome. Currently, several platforms with different achievable throughputs, coverage, and resolutions are available, including Fluorescence In Situ Hybridization (FISH) [19, 20], NanoString’s digital detection technology [21-23], array comparative genomic hybridization (array CGH) [24], Single Nucleotide Polymorphism (SNP) array [7], and Next Generation Sequencing (NGS) [25-33]. In this Review, we focus on NGS-based approaches, as they have been emerging as the primary means of interrogating the CNV in recent investigations. Somatic CNV detection in cancer is our primary focus, as the characteristics of somatic CNVs need special consideration in algorithms and strategies in which germline CNV detection programs are usually not suited for. We begin by briefly reviewing the NGS studies and outlining the existing computational programs for somatic CNV detection. We then cover the primary types of NGS data that could be used in CNV detection, followed by deciphering and summarizing the principles under data preprocessing, segmentation, and interpretation. The key similarity and difference between different computational programs are described. We continue by providing some discussion of the challenges in somatic CNV detection, and we conclude with an outlook on the near future of this fast evolving field. The aims of this article are to provide a guide to the analytic tools used in NGS-based cancer CNV studies, and to discuss the important factors that researchers need to consider when analyzing NGS data for somatic CNV detections.
NGS Studies
NGS is a technology that parallelly sequences massive amounts of short DNA strands from randomly fragmented copies of a genome [25-33]. A typical NGS run will generate millions to billions of reads, which are assumed to be random representations of the targeted regions or the whole genome. The widespread availability of NGS technology provides an unprecedented opportunity to systematically screen for CNVs. NGS is flexible in that it can be adapted to cover either the whole genome or targeted regions of interest (for example, the exome, defined as the complete set of coding regions of human genome). NGS-based CNV studies frequently fall into Whole Genome Sequencing (WGS) studies and Whole Exome Sequencing (WES) studies, and they are both considered in this Review.
WGS.
A single experiment of WGS can produce multidimensional information for discovering CNVs in a genome-wide scale. First, as the frequency of a genomic region being represented by reads is linear correlated to its copy number in a broad range after correcting some systematic bias (such as GC bias and mappability bias), the analysis of relative number of reads falling in a region can reveal its copy number. Second, the numbers of reads covering both alleles at a single nucleotide polymorphism (SNP) locus could be used to estimate the allele specific absolute copy numbers, determine copy neutral regions of loss of heterozygosity (LOH), and infer the amount of normal cells in a tumor population. Third, reads that capture the sequences of boundary regions can serve as signatures of structural variations, and identify the breakpoints of structure variations at base pair resolution. Fourth, as pair-end and mate-paired sequencing are often employed, the pairs of reads with spans and/or orientations are inconsistent with the reference genome can facilitate the determination of structure variations. A more detailed discussion about these data types is followed. The quality and richness of data make WGS by far the most powerful approach for CNV detection.
WES.
The cost of a WGS experiment has dropped substantially in the past several years, but it is still relatively expensive (>$5,000 per sample), and the resultant data requires substantial investment in computational resources for processing and storage. To balance the cost and output, WES approach can be used when WGS is not financially affordable. The exome represents a highly function-enriched subset of the human genome, and CNVs in exome are more likely to be pathogenic than those in nongenic regions [34, 35]. In WES experiments, DNA fragments belonging to the exome can be enriched from fragmented genome sample by hybridization with designed probes or by PCR amplification with designed primers, and then parallel sequencing is applied to the selected fragments. Compared with WGS, WES cannot reach base pair resolution in determining breakpoints falling into non-coding regions due to the discrete nature of exome regions, and its CNV calling results are only reliable in exon-rich regions because of the uneven distribution of exons across the genome. Nevertheless, WES is ideal for searching for gene-harboring CNVs in a cost-efficient and analytic-effective manner. As the data types from WES are similar to WGS, similar data processing is usually conducted.
Somatic CNV Detection Programs for NGS data
Sophisticated computational algorithms are crucial to accurately retrieve segmental copy number and breaking points from NGS data. Although the NGS technology was only emerging and applied to cancer studies during the past several years [36-56], a number of somatic CNV detection programs for NGS data have been developed. In table 1, we list 11 publicly available programs and their websites. SegSeq [41], ReadDepth [57], BICseq [58], Patchwalk [59], OncoSNP-SEQ [60], HMMCOPY, and CONSERTING were designed for WGS data; ExomeCNV [61], VarScan2 [62], and HAPSEG/ABSOLUTE [63, 64] can be applied to WES data. Control-FREEC [65, 66] can analyze the data from both WES and WGS platforms.
A somatic CNV detection program generally follows the flow chart illustrated in Figure 1. It may take one or more data types as inputs. The core of a computational algorithm can be broadly divided into three modules: data preprocessing, segmentation, and interpretation. Different strategies could be used in each module. Depending on the embedded algorithms, the programs output the results at different level of details. Some programs only report the segments with copy number gain or loss, some report segments with total or allele specific copy number, and others provide further information including tumor purity, ploidy, and even heterogeneity. The major features of each program have been summarized in Table 2, and we will discuss them with more details in the following.
Table 1: Available programs for detecting copy number variation in cancer genome using next generation sequencing data
Platform |
Program |
Website |
Ref. |
Year |
Language |
WGS |
SegSeq |
http://www.broadinstitute.org/cancer/cga/Home |
[41] |
2009 |
MATLAB |
ReadDepth |
http://code.google.com/p/readdepth/ |
[57] |
2011 |
R |
|
BIC-seq |
http://compbio.med.harvard.edu/Supplements/PNAS11.html |
[58] |
2011 |
Perl/R |
|
Patchwork |
http://patchwork.r-forge.r-project.org/ |
[59] |
2013 |
R |
|
OncoSNP-SEQ |
https://sites.google.com/site/oncosnpseq/ |
[60] |
2013 |
MATLAB |
|
HMMcopy |
http://compbio.bccrc.ca/software/hmmcopy/ |
/ |
/ |
R |
|
CONSERTING |
http://www.stjuderesearch.org/site/lab/zhang |
/ |
/ |
R |
|
WES |
ExomeCNV |
https://secure.genome.ucla.edu/index.php/ExomeCNV_User_Guide |
[61] |
2011 |
R |
VarScan2 |
http://varscan.sourceforge.net/ |
[62] |
2012 |
Java |
|
HAPSEG/ABSOLUTE |
http://www.broadinstitute.org/cancer/cga/Home |
2012 |
R |
||
WGS&WES |
Control_FREEC |
http://bioinfo-out.curie.fr/projects/freec/#documentation |
2011 |
C |
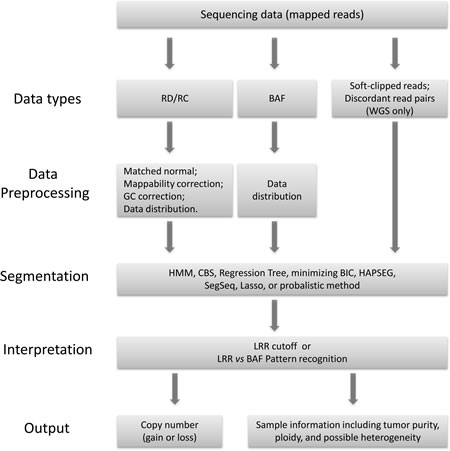
Figure 1: The workflow chart that computational methods fall in for calling somatic copy number variations from next generation sequencing data.
Data Types
In this section, we describe the types of data that could be used in NGS-based CNV detection. These data types include read counts (RC) or read depth (RD), B Allele Frequency (BAF), soft-clipped reads, and discordant read pairs.
RD or RC.
A normal human cell usually has two copies of its genetic materials (Homologues 1 and 2), with one copy from each parent (Figure 2A). When a CNV event happens in a genomic region, it becomes aneuploid, i.e. its copy number deviates from 2. The event could be a deletion (loss of genetic material), or amplification (gain of genetic material). Figure 2B shows a simple case with tandem amplification. NGS technology is capable of producing short reads of 100-150 bases in length, which will be mapped to the reference genome. A basic hypothesis in NGS is that each read is a random representation of the targeted regions or the whole genome, thus the mean or median read depth (RD) or read counts (RC) of a genomic region should be proportional to its abundance, or say, its copy number (Figure 2C). Here, read depth (RD) is defined as the number of reads covering a specific locus in the alignment file; read count (RC) is the number of reads falling into a region in the reference genome. RD and RC are two different ways to describe the frequency of a genomic unit (base pair or segment) being represented in sequencing data. They are usually represented in the log2 scale and relative to a selected reference value, and called Log RD Ratio or Log RC Ratio (LRR). LRR is the primary information used in most NGS-based analytic tools for extracting copy number. In principle, LRR provides enough information for CNV detection. However, inherited data bias, intrinsic sample characteristics, and random experimental variations make it problematic to call CNV solely on LRR. Other information, especially B Allele Frequency or Fraction (BAF), could aid CNV detection.
BAF.
As illustrated in Figure 2A, BAF is the estimation of allelic fraction at a SNP locus. Alleles are assigned arbitrarily, but usually the allele with the same nucleotide as the reference genome is assigned as ‘A’ allele, and the allele with different nucleotide from reference is called ‘B’ allele. BAF is calculated as b/(a+b) at each SNP locus, where a and b are copy number of A and B allele, respectively. There are four genotype possibilities for a SNP locus in a normal genome: AA, AB, BA, and BB, and their BAFs are 0, 0.5, 0.5, and 1, respectively (Figure 2). Genotypes AB and BA are not distinguishable from their BAFs. When the copy number is away from 2, BAF has other possibilities, which depend on allelic copy number. As illustrated in Figure 2c, if there are m copies of Homologue 1 and n copies of Homologue 2 in a tumor genomic region, BAF has possibilities of 0, m/(m+n), n/(m+n), and 1 (table in Figure 2). Comparing tumor and normal genome, the BAF at heterozygous loci (Loci 2 and 3 in Figure 2) may shift away from 0.5 in tumor genome. A CNV segment usually contains many heterozygous SNP loci, so the BAF plot of heterozygous SNP loci across the tumor genome segment may split into two bands at mean value of m/(m+n) and n/(m+n), respectively, while it is only one band at mean value of 0.5 across the normal genome segment. Presumably, BAF is more sensitive to CNV events than LRR, since biases introduced by local nucleotide sequence (for example, GC bias) are canceled in BAF calculation. While BAF shifting away from mean value of 0.5 indicates a CNV event in the corresponding genomic region, BAF alone does not provide enough information to identify absolute tumor copy number especially when normal tissue contamination exists. Moreover, false negative calls are possible if CNV calling is solely based on BAF, since BAF remaining at mean value of 0.5 does not indicate lack of CNV events in the region. In the scenario of homozygous amplification, m equals n so that the BAF possibilities are the same as normal diploid genome, and LRR is necessary for determining copy number. Therefore, accurate CNV detection will likely benefit from the combination of LRR and BAF.
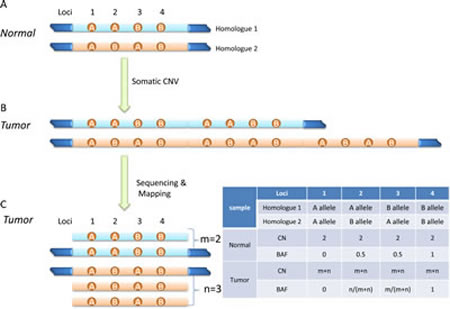
Figure 2: Diagram of detecting somatic CNV from sequencing data. (A) A normal human genome usually has two copies of its chromosomes (each copy or homologue from either parents), and contains loci with different genotypes (AA, AB, BA, and BB for loci 1-4, respectively). (B) A somatic CNV event (tandem duplication here) alters copy number of some genomic regions. (C) Pileup view of mapped reads. Altered relative read depth or read counts can be observed. Depending on copy numbers of two homologues in tumor genome, shifted B allele frequency might be observed at heterozygous loci (see the table. CN, copy number; BAF, B allele frequency).
As show in Table 2, all existing programs exploit the LRR (either RD or RC), and several have incorporated BAF information. Patchwork incorporates LRR and BAF for pattern recognition, as only certain LRR and BAF combinations are possible. HAPSEG/ABSOLUTE has the option of matching pattern of local relative DNA concentration to interpret the segments. The terms of local relative DNA concentration is equivalent to the combination of total copy number and BAF in a segment, since relative DNA concentration could be derived from total copy number and BAF, and vice versa. CONSERTING has the option to use regions with BAF equals 0.5 for determining diploid baseline.
Table 2: Major features of programs for detecting copy number variation in cancer genome using next generation sequencing data1
Programs |
Data type |
Data preprocessing3 |
Segmentation |
Interpretation |
Sample information |
SegSeq |
RC |
Matched normal; |
Local change-point analysis with a subsequent merging procedure |
Optimized cutoffs |
/ |
ReadDepth |
RD Discordant read pairs |
Mappability correction; GC correction; RD Negative-binomial distribution |
CBS |
Optimized cutoffs |
/ |
BIC-seq |
RD |
Matched normal; No data distribution assumption |
Minimizing BIC |
Empirical cutoffs |
/ |
Patchwork |
RD BAF |
Normal genome; GC correction |
CBS |
Pattern Recognition and empirical cutoffs |
Tumor purity Tumor ploidy |
OncoSNP-SEQ |
RC BAF |
Matched normal; Mappability correction; GC correction Mixture of uniform and binomial distribution |
HMM |
HMM |
Tumor purity Tumor ploidy Tumor heterogeneity |
HMMcopy |
RC |
Matched normal; Mappability correction; GC correction |
HMM |
HMM |
/ |
CONSERTING |
RD BAF Soft-clipped reads |
Matched normal; Mappability filtering; GC correction |
Regression Tree |
Empirical cutoff |
/ |
ExomeCNV |
RD2 |
Matched normal |
CBS |
Optimized cutoff |
Fixed tumor purity |
VarScan2 |
RD |
Matched normal |
CBS |
Empirical cutoff |
/ |
HAPSEG/ABSOLUTE |
RD at SNP loci |
Matched normal |
probabilistic method |
Pattern Matching and fit platform error model |
Tumor purity Tumor ploidy Existence of sub-clone |
Control_FREEC |
RC |
Matched normal and/or GC and Mappability correction; |
LASSO algorithm |
Empirical cutoff |
Tumor purity User inputs tumor ploidy |
1 Abbreviations: RC, Read Counts; RD, Read Depth; BAF, B Allele Frequency; SNP, single nucleotide polymorphism; CBS, circular binary segmentation; HMM, hidden Markov model.
2 ExomeCNV uses only RD for calling CNV; it uses BAF for calling LOH.
3 The data is assumed to be in normal distribution if not specified.
Soft-clipped reads and discordant read pairs.
New nucleotide sequences often arise in the boundary regions when a CNV event occurs (Figure 2B). These new sequences might be captured by soft-clipped reads or discordant read pairs in WGS data, and the probability of them being captured by WES methodologies is low. Soft-clipped reads are reads whose sequences are mapped to discrete regions in the reference genome; discordant read pairs are read pairs whose spans and/or orientations are inconsistent with the reference genome. Though it is unlikely to determine segmental copy number solely based on soft-clipped reads and/or discordant read pairs, they could provide useful information to confirm CNV events and to refine the breakpoints. Soft-clipped reads have been combined with LRR and BAF in CONSERTING to detect somatic CNVs.
In short, NGS provides multidimensional data at base level resolution to reveal somatic CNVs. An accurate somatic CNV prediction could be supported by evidences at different levels, including LRR, BAF, soft-clipped reads, discordant read pairs, or their combination.
Data Preprocessing
The principle in most CNV detection programs is that larger or smaller than expected LRR in a genomic region reflects gain or loss of DNA in this region, respectively. However, random variations and systematic biases including mappability bias and GC-content bias (see below) deviates LRR from “correct” number. It is important to correct the biases and create a baseline for capturing the technical variation of a platform. Then a hypothesis of data (LRR and/or BAF) distribution is needed for segmentation.
Matched normal.
A typical strategy to cancel biases and variations in NGS-based cancer CNV studies is to use sequencing data from matched normal tissue or germline of the same patient (most programs) or another individual with majorly diploid genome (Patchwork) under the identical experimental conditions. This is required or preferred for all somatic CNV detection algorithms listed in Table 2, except ReadDepth, which use only tumor NGS data for CNV detection. Though it is tempting to design an algorithm to detect somatic CNV from tumor sample alone, Xi et al oppose this conduction as they believe this would result in many false positive due to the fluctuation of reads distribution along the genome [58]. Moreover, it is important to have matched normal from same patient in somatic CNV detection, because the matched normal helps to identify heterozygous SNP loci for calculating BAF and to filter out benign CNV in patient. While the inclusion of match normal is a powerful strategy for somatic CNV detection, it might not cancel all the biases, and further corrections for mappability and GC-content biases are proposed in several programs.
Mappability bias.
NGS generates short reads in length of 100-150 bases, which are mapped to a reference genome for downstream analysis. The great advantage of using short reads is that it can reach massively parallel sequencing with reasonably low error rate (< 0.1%). However, it brings challenges in mapping, as some reads cannot be uniquely mapped to the reference genome, which are called multi-reads. For a given genome, the ratio of multi-reads in all reads from a platform depends mostly on the length of sequence reads, the number of mismatches allowed in mapping [67], and sequencing approach (pair-end vs. single-end sequencing). Mappability is defined as the probability for a region in the reference genome that a read originating from it is unambiguously mapped back to it. It can be calculated by programs such as GEM mappability [68]. Regions with higher mappability have more unique sequences and produce less ambiguous reads, and vice versa. Mutations and/or sequencing errors in just one or two positions in low mappability regions may cause the reads to be mapped to wrong position. This is especially common for repetitive regions. Different strategies are used for dealing with multi-reads: (1) discarding the reads; (2) choosing a random position out of all of equally good match position; (3) reporting all possible positions. No matter what strategy is used, the ambiguous reads will likely create some biases in the read depth or read counts and might cause errors in CNV detection [69]. In theory, discarding multi-reads may lead to false positive deletion calls, while placing a multi-read at a random possible position may cause false negative deletion/amplification calls. The list of programs implementing mappability correction includes ReadDepth, Control-FREEC, HMMCOPY and CONSERTING. Control-FREEC and CONSERTING skip the regions with low mappability (default < 0.85 and 0.9 in Control-FREEC and CONSERTING respectively), and only reads falling in high mappability regions are used to call CNVs. HMMCOPY and OncoSNP-SEQ correct mappability bias in read counts by dividing the raw read counts by regional mappability (Appendix, Equation 1). In this way, ambiguous reads will be discarded, and unambiguous reads in low mappability regions have bigger weight for CNV detection than reads in high mappability region. To prevent overcorrection, ReadDepth uses the same formula to correct RD data in only high mappability region (default >0.75) and ignores the RD data in low mappability region.
GC-content bias.
It is well known that average read depth of a bin or read count in a region has a unimodal relationship with its GC content, regardless of the chosen bin/region size or average coverage [70-72]. Bins with high or low GC-content have lower mean read depth than bins with medium GC-content (40% to 55% GC). This is believed partially due to PCR efficiency in amplification [71] and sequencing. What makes correcting the bias even harder is while read depth v.s. GC-content curves are all unimodal, different samples or even repeated experiments have different slopes, locations of modes, and variances [71]. Benjamini and Speed developed a correction method based on the fragment and fragment-length models to remove most GC-dependent fragment count variation [71]. The method has been implemented in HMMCOPY program, which is based on read counts. When it is applied to read depth but not read counts, increased overall read depth variance was observed [69]. In currently available read depth based programs including CONSERTING, ReadDepth, and Patchwork, the GC bias is corrected in a fashion described by Teo et al [69] and Yoon et al [72] (Appendix, Equation 2). Regions with extreme GC content (high or low) might be excluded from the analysis. Control-FREEC and OncoSNP-SEQ uses this way for correcting GC bias too, though they are read counts based methods.
Other biases.
Besides mappability and GC-content, there might be additional biases in NGS data which haven’t been explicitly corrected in existing CNV detection programs. For example, A and T are more common near the fragment ends, and fragments are much more likely to start with a CpG dinucleotide than any other dinucleotides when the fragment libraries are prepared following Illumina procedure [71]. These local biases near fragment ends might imply that the fragmentation is not truly random. Moreover, it is not clear how Phred-score filtering of sequence reads affect CNV detection [69]. Further investigations are necessary for systematical bias correction in NGS-based cancer CNV studies [73-76].
Assumption of data distribution.
Supposing all the biases are removed from NGS data, an assumption of data distribution is needed to model the data variation for segmentation in most CNV detection programs (except BIC-seq which uses Bayesian Information Criterion (BIC) as merging and stopping criterion). Since the sequence reads are assumed to be chosen randomly from the genome, the RC or RD in a region should follow a Poisson distribution with mean directly proportional to the size of the region and to the copy number [41]. In most of the programs, the hypothetical Poisson distribution is approximated to normal distribution. However, Miller et. al. found that the observed distribution violates the Poisson distribution’s assumption of equal mean and variance, and negative-binomial distribution is a better approximation for the over dispersed Poisson distribution [57]. As a result, negative binomial distribution is used for bias corrected NGS data in the ReadDepth program. In OncoSNP-SEQ, a mixture of uniform and binomial distribution is used. Overall, an improved understanding of NGS data distribution will likely improve the detection accuracy.
Segmentation
Segmentation is the process that combines all the reads from same continuous region into a segment with determined boundaries. The challenge in segmentation is that the algorithm needs to distinguish the data variation caused by genuine CNV from that by random effects. Several strategies have been used for this purpose. Two of the most widely used segmentation modules in CNV detection algorithms for array CGH and SNP array, Circular Binary Segmentation (CBS) [77-79] and Hidden Markov Model (HMM) [80-82], have been adapted into programs for NGS data. CBS is used in Patchwork, ExomeCNV, and VarScan2; HMM is implemented into OncoSNP-SEQ and HMMCOPY. The key idea of CBS is joining the ends of a chromosome to make a circle and then iteratively computing segments to minimize the variance within segments and maximize the variance between segments. HMM simultaneously classify each window into a fixed number of possible states based on the read count in the window via an emission distribution (usually Guassian), and make segmentation by combining consecutive windows with same states. Under HMM, segmentation and classification can promote each other by allowing probabilistic parameters in model efficiently learnt from data through algorithms like Expectation Maximization (EM). However, OncoSNP-SEQ uses fixed parameters obtained by off-line training in the model, because the iterative application of the forward-backward algorithm for HMM is not computational trivial due to the sequence length and dynamic range. Besides CBS and HMM, some new algorithms have been developed based on NGS data in the past several years: Xi et al developed the BIC-seq algorithm for read depth segmentation via minimizing Bayesian Information Criterion (BIC) by merging the appropriate neighboring bins [58]; Chen et al designed a regression tree algorithm based on WGS data to integrate read depth change with structure variation sequence signature to determine segments in CONSERTING; Carter et al built a probabilistic method by partitioning the genome into segments of distinct copy number and modeling the four distinct genotypes into each segment in HAPSEG/ABSOLUTE [63, 64]; Chiang et al used a local change-point analysis with a subsequent merging procedure in SegSeq [41]; Boeva et al adapted Lasso algorithm in Control-FREEC to catch the change points [66]. These segmentation algorithms offered a good amount of choices for segmentation, and a systematic evaluation of them using NGS data will be valuable to help researcher choose an appropriate one for their research projects.
Segments Interpretation
An ideal segmentation approach will merge adjacent data points with same copy number into one segment and divide regions with different copy numbers into different segments. Further step of interpretation is needed to determine the copy number state of each segment, except for HMM based programs (i.e., HMMcopy), which simultaneously classify each data point to a state and merges the points to segments through EM algorithm. To assign a copy number state to each segment, quantitative criteria are necessary. As shown in Table 2, most of the currently available programs interpret the copy number based on specified LRR cutoffs. Some of the programs, including CONSERTING, Control-FREEC, BIC-seq, and VarScan2, set empirical cutoff values to define copy number states. Some other programs, including ExomeCNV, SegSeq, and ReadDepth, optimize the cutoffs to reach the desired sensitivity and specificity. If a segment does not have sufficient coverage to achieve the desired sensitivity/specificity, no call will usually make in order to prevent false call from inferior data quality. The LRR versus BAF pattern has been used in Patchwork for assigning copy number state. As LRR versus BAF pattern involves two data types, cutoff values of LRR and BAF corresponding to different copy number states are needed. In Patchwork, the empirical cutoff values will be specified by the users. HAPSEG/ABSOLUTE fits observed data to a platform-dependent error model to determine the cutoffs.
Challenges in Somatic CNV Detection
In theory, ‘digital karyotyping’ is simple and powerful to asses CNV in designated regions from WGS or WES data [83-85]. However, accurate determination of somatic CNVs is still a great challenge, largely due to the complexities of tumor samples. First, CNVs are very extensive and diverse in tumor genome. Second, tumor samples are inevitably contaminated by normal tissues without known fractions. Third, the ploidies of tumor cells are usually unknown. Fourth, multiple clones in tumor sample are possible, owing to subclonal evolution. These issues are further confounded by signal variation caused by local sequence content and by sample quality and experiment conditions, which are proven to be hard to deconvolute in germline samples [86].
Extensive and diverse CNV events in tumor genome.
Germline and somatic CNVs are very different in their extensities and diversities in genome. Overall, germline CNVs covers about 3.7% [35] to 12% [87] of the genome and they often overlap in genomes of different people, while somatic CNVs could compass the whole genome and recurrent ones are at relative low rate. It is usually assumed that non-recurrent and sharp read depth changes are due to technical variations in normal genome sequencing data, but this assumption could be fallacious for tumor samples. These features make some excellent germline CNVs detection programs, such as ERDS [34], JointSLM [88], and CoNIFER [89], not suitable for somatic CNV detection. For example, modeling across samples may improve the performance of germline CNV detection by removing non-recurrent signals variation [88, 90], but this strategy may increase false negative rate in somatic CNV detection because non-recurrent ones are more common in tumor genome.
Tumor purity.
Normal cell contamination in tumor sample will diminish the observed LRR changes caused by CNVs, and shift BAFs away from presumed values. This introduces difficulties in determining segmental copy number based on LRR and BAF, as the cutoff values will depend on tumor purity which is usually unknown. As overall RD or RC of a sample is the linear combination of RD or RC of tumor and normal genomes, fitting measured LRR and/or BAF values across the genome to different tumor percentage could help determine the most likely tumor purity.
Tumor ploidy.
Aneuploidy of tumor genome creates difficulties in determining the copy number state of LRR baseline. NGS experimental protocol constrains the amount of DNA, not the number of cells. Therefore, instead of corresponding to diploidy as in normal human cells, the LRR baseline is corresponding to the average ploidy, which is usually unknown in tumor sample. Combining LRR and BAF information might be able to reveal the average ploidy, since different ploidy has different possibilities of BAF pattern. For example, diploidy has BAF possibilities of 0, 0.5, and 1; tetraploidy has BAF possibilities of 0, 0.25, 0.5, 0.75, and 1. Since tumor purity and ploidy confound with each other, solving them coordinately will likely provide important information to make accurate CNV calls. Patchwork, OncoSNP-SEQ and ABSOLUTE provide function to evaluate tumor purity and ploidy. Control-FREEC asks users to input sample ploidy, and it can estimate tumor purity. If ploidy is not known, it is suggested to run the program several times with possible ploidy values and compare the results.
Tumor heterogeneity.
Multiple clones of tumor cells could coexist in one tumor [91], and subclones are important to tumor evolution and cancer relapse. Due to their low percentage in a sample, it is hard to determine the subclones. While increasing the depth of sequencing can help to capture the substantial subclone, the accuracy also depends on the properties of tumor sample and the complexity of tumor genomic being investigated. OncoSNP-SEQ and ABSOLUTE provide the feature to detect heterogeneous events.
For a given copy number state, only certain LRR and BAF combinations are possible. Therefore, the number of LRR vs BAF patterns is limited. The deviations from these patterns are usually caused by tumor impurity, aneuploidy, tumor heterogeneity, or their combinations. The observed LRR and BAF of a tumor sample are the linear combinations of LRR and BAF of its components [64], when there are admixtures of normal contamination and multiple clones of tumor cells. From the deviation of patterns, it is possible to deconvolute the tumor impurity, aneuploidy, and tumor heterogeneity.
Lack of gold standard.
Another challenge in somatic CNV detection algorithm development is the lack of gold standard controls or samples to benchmark CNV calling results. Though all the published NGS based somatic CNV detection programs have been tested by some sort of benchmark, such as in silico simulated data or calls from SNP arrays on the same set of tumor samples, the generality of such benchmark is less clear. While several simulators, such as ART [92], pIRS [93], GemSIM [94], and Wessim [95], have been developed to simulate NGS data by reproducing known biases from sequence context and empirical platform-dependent error, there is no comprehensive tumor genome simulator that captures all the features of tumor genome mentioned above. Meanwhile, it has been shown that there is a striking lack of reproducibility and concordance for array-based platforms and calling algorithms based on recent assessment [86]. Without a well controlled reference set, it will be difficult to further understand the advantages and disadvantages associated with each program. As a result, the choice of NGS based CNV detection algorithm relies more on factors such as the algorithm’s technique descriptions instead of its performances with a common benchmark. Therefore, it is necessary for the community to establish better benchmark datasets, which compass the complexity of tumor genome, for algorithms evaluation and further development.
Conclusions and Outlooks
One of the most important somatic aberrations, CNV in tumor genomes is believed to have high probability of harboring oncotargets. The widespread availability of NGS technology provides an unprecedented opportunity to systematically screen for somatic CNVs. Accurate detection of somatic CNV from massive amount of raw sequence data for each individual requires sophisticated computational algorithms. Read depth or read counts, BAF, soft clipped reads, and discordant reads pairs derived from sequence read mapping are the primary input for CNV determination. During the past several years, a number of computational algorithms have been developed to retrieve copy number from one or more of these data types. In this article, we reviewed 11 existing programs for determining somatic CNV from NGS data, described their similarity and difference in types of data using, data preprocessing, data segmentation, and data interpretation, and highlighted challenges associated with the analysis of NGS data for CNV detection in cancer studies Our review serves as a timely and practical guide to the analytic tools used in NGS-based cancer CNV studies.
Due to the special characteristics of tumor samples and the extraordinary complexity of tumor genomes, accurate detection of somatic CNVs is still a great challenge for the community. Improved computational frameworks are required to take full use of NGS data in order to tackle the tumor purity, ploidy, and heterogeneity coordinately for allele specific copy number calling. Meanwhile, standard protocols, quality control measures, and benchmark are much needed for better further understanding of the advantages and disadvantages associated with existing programs, and to foster the development of next-generation analytic tools.
Acknowledgement
This work was supported by an award from the Roswell Park Alliance Foundation and by NCI grants P30 CA016056, R01 CA067267, and R21 CA162218.
References
1. Albertson DG, Collins C, McCormick F and Gray JW. Chromosome aberrations in solid tumors. Nature genetics. 2003; 34(4):369-376.
2. Diskin SJ, Hou C, Glessner JT, Attiyeh EF, Laudenslager M, Bosse K, Cole K, Mosse YP, Wood A, Lynch JE, Pecor K, Diamond M, Winter C, Wang K, Kim C, Geiger EA, et al. Copy number variation at 1q21.1 associated with neuroblastoma. Nature. 2009; 459(7249):987-991.
3. Shlien A and Malkin D. Copy number variations and cancer. Genome medicine. 2009; 1(6):62.
4. Beroukhim R, Mermel CH, Porter D, Wei G, Raychaudhuri S, Donovan J, Barretina J, Boehm JS, Dobson J, Urashima M, Mc Henry KT, Pinchback RM, Ligon AH, Cho YJ, Haery L, Greulich H, et al. The landscape of somatic copy-number alteration across human cancers. Nature. 2010; 463(7283):899-905.
5. Stranger BE, Forrest MS, Dunning M, Ingle CE, Beazley C, Thorne N, Redon R, Bird CP, de Grassi A, Lee C, Tyler-Smith C, Carter N, Scherer SW, Tavare S, Deloukas P, Hurles ME, et al. Relative impact of nucleotide and copy number variation on gene expression phenotypes. Science. 2007; 315(5813):848-853.
6. Feuk L, Carson AR and Scherer SW. Structural variation in the human genome. Nature reviews Genetics. 2006; 7(2):85-97.
7. Alkan C, Coe BP and Eichler EE. Genome structural variation discovery and genotyping. Nature reviews Genetics. 2011; 12(5):363-376.
8. Curtis C, Shah SP, Chin SF, Turashvili G, Rueda OM, Dunning MJ, Speed D, Lynch AG, Samarajiwa S, Yuan Y, Graf S, Ha G, Haffari G, Bashashati A, Russell R, McKinney S, et al. The genomic and transcriptomic architecture of 2,000 breast tumours reveals novel subgroups. Nature. 2012; 486(7403):346-352.
9. Beroukhim R, Getz G, Nghiemphu L, Barretina J, Hsueh T, Linhart D, Vivanco I, Lee JC, Huang JH, Alexander S, Du J, Kau T, Thomas RK, Shah K, Soto H, Perner S, et al. Assessing the significance of chromosomal aberrations in cancer: methodology and application to glioma. Proceedings of the National Academy of Sciences of the United States of America. 2007; 104(50):20007-20012.
10. Kim TM, Xi R, Luquette LJ, Park RW, Johnson MD and Park PJ. Functional genomic analysis of chromosomal aberrations in a compendium of 8000 cancer genomes. Genome research. 2013; 23(2):217-227.
11. Santarius T, Shipley J, Brewer D, Stratton MR and Cooper CS. A census of amplified and overexpressed human cancer genes. Nature reviews Cancer. 2010; 10(1):59-64.
12. Cox C, Bignell G, Greenman C, Stabenau A, Warren W, Stephens P, Davies H, Watt S, Teague J, Edkins S, Birney E, Easton DF, Wooster R, Futreal PA and Stratton MR. A survey of homozygous deletions in human cancer genomes. Proceedings of the National Academy of Sciences of the United States of America. 2005; 102(12):4542-4547.
13. Futreal PA, Coin L, Marshall M, Down T, Hubbard T, Wooster R, Rahman N and Stratton MR. A census of human cancer genes. Nature reviews Cancer. 2004; 4(3):177-183.
14. Dancey JE, Bedard PL, Onetto N and Hudson TJ. The genetic basis for cancer treatment decisions. Cell. 2012; 148(3):409-420.
15. Carter P, Presta L, Gorman CM, Ridgway JB, Henner D, Wong WL, Rowland AM, Kotts C, Carver ME and Shepard HM. Humanization of an anti-p185HER2 antibody for human cancer therapy. Proceedings of the National Academy of Sciences of the United States of America. 1992; 89(10):4285-4289.
16. Pegram MD, Pienkowski T, Northfelt DW, Eiermann W, Patel R, Fumoleau P, Quan E, Crown J, Toppmeyer D, Smylie M, Riva A, Blitz S, Press MF, Reese D, Lindsay MA and Slamon DJ. Results of two open-label, multicenter phase II studies of docetaxel, platinum salts, and trastuzumab in HER2-positive advanced breast cancer. Journal of the National Cancer Institute. 2004; 96(10):759-769.
17. Robert N, Leyland-Jones B, Asmar L, Belt R, Ilegbodu D, Loesch D, Raju R, Valentine E, Sayre R, Cobleigh M, Albain K, McCullough C, Fuchs L and Slamon D. Randomized phase III study of trastuzumab, paclitaxel, and carboplatin compared with trastuzumab and paclitaxel in women with HER-2-overexpressing metastatic breast cancer. Journal of clinical oncology : official journal of the American Society of Clinical Oncology. 2006; 24(18):2786-2792.
18. Piccart-Gebhart MJ, Procter M, Leyland-Jones B, Goldhirsch A, Untch M, Smith I, Gianni L, Baselga J, Bell R, Jackisch C, Cameron D, Dowsett M, Barrios CH, Steger G, Huang CS, Andersson M, et al. Trastuzumab after adjuvant chemotherapy in HER2-positive breast cancer. The New England journal of medicine. 2005; 353(16):1659-1672.
19. Speicher MR and Carter NP. The new cytogenetics: blurring the boundaries with molecular biology. Nature reviews Genetics. 2005; 6(10):782-792.
20. Schaaf CP, Wiszniewska J and Beaudet AL. Copy number and SNP arrays in clinical diagnostics. Annual review of genomics and human genetics. 2011; 12:25-51.
21. O’Huallachain M, Karczewski KJ, Weissman SM, Urban AE and Snyder MP. Extensive genetic variation in somatic human tissues. Proceedings of the National Academy of Sciences of the United States of America. 2012; 109(44):18018-18023.
22. Northcott PA, Shih DJ, Peacock J, Garzia L, Morrissy AS, Zichner T, Stutz AM, Korshunov A, Reimand J, Schumacher SE, Beroukhim R, Ellison DW, Marshall CR, Lionel AC, Mack S, Dubuc A, et al. Subgroup-specific structural variation across 1,000 medulloblastoma genomes. Nature. 2012; 488(7409):49-56.
23. Ruderfer DM, Chambert K, Moran J, Talkowski M, Chen ES, Gigek C, Gusella JF, Blackwood DH, Corvin A, Gurling HM, Hultman CM, Kirov G, Magnusson P, O’Donovan MC, Owen MJ, Pato C, et al. Mosaic copy number variation in schizophrenia. European journal of human genetics : EJHG. 2013; 21(9):1007-1011.
24. Kallioniemi A, Kallioniemi OP, Sudar D, Rutovitz D, Gray JW, Waldman F and Pinkel D. Comparative genomic hybridization for molecular cytogenetic analysis of solid tumors. Science. 1992; 258(5083):818-821.
25. Metzker ML. Sequencing technologies - the next generation. Nature reviews Genetics. 2010; 11(1):31-46.
26. Mardis ER. Next-generation DNA sequencing methods. Annual review of genomics and human genetics. 2008; 9:387-402.
27. Bentley DR, Balasubramanian S, Swerdlow HP, Smith GP, Milton J, Brown CG, Hall KP, Evers DJ, Barnes CL, Bignell HR, Boutell JM, Bryant J, Carter RJ, Keira Cheetham R, Cox AJ, Ellis DJ, et al. Accurate whole human genome sequencing using reversible terminator chemistry. Nature. 2008; 456(7218):53-59.
28. Rothberg JM, Hinz W, Rearick TM, Schultz J, Mileski W, Davey M, Leamon JH, Johnson K, Milgrew MJ, Edwards M, Hoon J, Simons JF, Marran D, Myers JW, Davidson JF, Branting A, et al. An integrated semiconductor device enabling non-optical genome sequencing. Nature. 2011; 475(7356):348-352.
29. Drmanac R, Sparks AB, Callow MJ, Halpern AL, Burns NL, Kermani BG, Carnevali P, Nazarenko I, Nilsen GB, Yeung G, Dahl F, Fernandez A, Staker B, Pant KP, Baccash J, Borcherding AP, et al. Human genome sequencing using unchained base reads on self-assembling DNA nanoarrays. Science. 2010; 327(5961):78-81.
30. Eid J, Fehr A, Gray J, Luong K, Lyle J, Otto G, Peluso P, Rank D, Baybayan P, Bettman B, Bibillo A, Bjornson K, Chaudhuri B, Christians F, Cicero R, Clark S, et al. Real-time DNA sequencing from single polymerase molecules. Science. 2009; 323(5910):133-138.
31. Lam HY, Clark MJ, Chen R, Natsoulis G, O’Huallachain M, Dewey FE, Habegger L, Ashley EA, Gerstein MB, Butte AJ, Ji HP and Snyder M. Performance comparison of whole-genome sequencing platforms. Nature biotechnology. 2012; 30(1):78-82.
32. Clark MJ, Chen R, Lam HY, Karczewski KJ, Euskirchen G, Butte AJ and Snyder M. Performance comparison of exome DNA sequencing technologies. Nature biotechnology. 2011; 29(10):908-914.
33. Quail MA, Smith M, Coupland P, Otto TD, Harris SR, Connor TR, Bertoni A, Swerdlow HP and Gu Y. A tale of three next generation sequencing platforms: comparison of Ion Torrent, Pacific Biosciences and Illumina MiSeq sequencers. BMC genomics. 2012; 13:341.
34. Zhu M, Need AC, Han Y, Ge D, Maia JM, Zhu Q, Heinzen EL, Cirulli ET, Pelak K, He M, Ruzzo EK, Gumbs C, Singh A, Feng S, Shianna KV and Goldstein DB. Using ERDS to infer copy-number variants in high-coverage genomes. American journal of human genetics. 2012; 91(3):408-421.
35. Conrad DF, Pinto D, Redon R, Feuk L, Gokcumen O, Zhang Y, Aerts J, Andrews TD, Barnes C, Campbell P, Fitzgerald T, Hu M, Ihm CH, Kristiansson K, Macarthur DG, Macdonald JR, et al. Origins and functional impact of copy number variation in the human genome. Nature. 2010; 464(7289):704-712.
36. Campbell PJ, Stephens PJ, Pleasance ED, O’Meara S, Li H, Santarius T, Stebbings LA, Leroy C, Edkins S, Hardy C, Teague JW, Menzies A, Goodhead I, Turner DJ, Clee CM, Quail MA, et al. Identification of somatically acquired rearrangements in cancer using genome-wide massively parallel paired-end sequencing. Nature genetics. 2008; 40(6):722-729.
37. Stephens PJ, McBride DJ, Lin ML, Varela I, Pleasance ED, Simpson JT, Stebbings LA, Leroy C, Edkins S, Mudie LJ, Greenman CD, Jia M, Latimer C, Teague JW, Lau KW, Burton J, et al. Complex landscapes of somatic rearrangement in human breast cancer genomes. Nature. 2009; 462(7276):1005-1010.
38. Turajlic S, Furney SJ, Lambros MB, Mitsopoulos C, Kozarewa I, Geyer FC, Mackay A, Hakas J, Zvelebil M, Lord CJ, Ashworth A, Thomas M, Stamp G, Larkin J, Reis-Filho JS and Marais R. Whole genome sequencing of matched primary and metastatic acral melanomas. Genome research. 2012; 22(2):196-207.
39. Ding L, Ellis MJ, Li S, Larson DE, Chen K, Wallis JW, Harris CC, McLellan MD, Fulton RS, Fulton LL, Abbott RM, Hoog J, Dooling DJ, Koboldt DC, Schmidt H, Kalicki J, et al. Genome remodelling in a basal-like breast cancer metastasis and xenograft. Nature. 2010; 464(7291):999-1005.
40. Mardis ER, Ding L, Dooling DJ, Larson DE, McLellan MD, Chen K, Koboldt DC, Fulton RS, Delehaunty KD, McGrath SD, Fulton LA, Locke DP, Magrini VJ, Abbott RM, Vickery TL, Reed JS, et al. Recurring mutations found by sequencing an acute myeloid leukemia genome. The New England journal of medicine. 2009; 361(11):1058-1066.
41. Chiang DY, Getz G, Jaffe DB, O’Kelly MJ, Zhao X, Carter SL, Russ C, Nusbaum C, Meyerson M and Lander ES. High-resolution mapping of copy-number alterations with massively parallel sequencing. Nature methods. 2009; 6(1):99-103.
42. Ha G, Roth A, Lai D, Bashashati A, Ding J, Goya R, Giuliany R, Rosner J, Oloumi A, Shumansky K, Chin SF, Turashvili G, Hirst M, Caldas C, Marra MA, Aparicio S, et al. Integrative analysis of genome-wide loss of heterozygosity and monoallelic expression at nucleotide resolution reveals disrupted pathways in triple-negative breast cancer. Genome research. 2012; 22(10):1995-2007.
43. Zhang J, Ding L, Holmfeldt L, Wu G, Heatley SL, Payne-Turner D, Easton J, Chen X, Wang J, Rusch M, Lu C, Chen SC, Wei L, Collins-Underwood JR, Ma J, Roberts KG, et al. The genetic basis of early T-cell precursor acute lymphoblastic leukaemia. Nature. 2012; 481(7380):157-163.
44. Holmfeldt L, Wei L, Diaz-Flores E, Walsh M, Zhang J, Ding L, Payne-Turner D, Churchman M, Andersson A, Chen SC, McCastlain K, Becksfort J, Ma J, Wu G, Patel SN, Heatley SL, et al. The genomic landscape of hypodiploid acute lymphoblastic leukemia. Nature genetics. 2013; 45(3):242-252.
45. Robinson G, Parker M, Kranenburg TA, Lu C, Chen X, Ding L, Phoenix TN, Hedlund E, Wei L, Zhu X, Chalhoub N, Baker SJ, Huether R, Kriwacki R, Curley N, Thiruvenkatam R, et al. Novel mutations target distinct subgroups of medulloblastoma. Nature. 2012; 488(7409):43-48.
46. Zhang J, Benavente CA, McEvoy J, Flores-Otero J, Ding L, Chen X, Ulyanov A, Wu G, Wilson M, Wang J, Brennan R, Rusch M, Manning AL, Ma J, Easton J, Shurtleff S, et al. A novel retinoblastoma therapy from genomic and epigenetic analyses. Nature. 2012; 481(7381):329-334.
47. Ley TJ, Mardis ER, Ding L, Fulton B, McLellan MD, Chen K, Dooling D, Dunford-Shore BH, McGrath S, Hickenbotham M, Cook L, Abbott R, Larson DE, Koboldt DC, Pohl C, Smith S, et al. DNA sequencing of a cytogenetically normal acute myeloid leukaemia genome. Nature. 2008; 456(7218):66-72.
48. Berger MF, Lawrence MS, Demichelis F, Drier Y, Cibulskis K, Sivachenko AY, Sboner A, Esgueva R, Pflueger D, Sougnez C, Onofrio R, Carter SL, Park K, Habegger L, Ambrogio L, Fennell T, et al. The genomic complexity of primary human prostate cancer. Nature. 2011; 470(7333):214-220.
49. Pleasance ED, Cheetham RK, Stephens PJ, McBride DJ, Humphray SJ, Greenman CD, Varela I, Lin ML, Ordonez GR, Bignell GR, Ye K, Alipaz J, Bauer MJ, Beare D, Butler A, Carter RJ, et al. A comprehensive catalogue of somatic mutations from a human cancer genome. Nature. 2010; 463(7278):191-196.
50. Pleasance ED, Stephens PJ, O’Meara S, McBride DJ, Meynert A, Jones D, Lin ML, Beare D, Lau KW, Greenman C, Varela I, Nik-Zainal S, Davies HR, Ordonez GR, Mudie LJ, Latimer C, et al. A small-cell lung cancer genome with complex signatures of tobacco exposure. Nature. 2010; 463(7278):184-190.
51. Shah SP, Morin RD, Khattra J, Prentice L, Pugh T, Burleigh A, Delaney A, Gelmon K, Guliany R, Senz J, Steidl C, Holt RA, Jones S, Sun M, Leung G, Moore R, et al. Mutational evolution in a lobular breast tumour profiled at single nucleotide resolution. Nature. 2009; 461(7265):809-813.
52. Ding L, Ley TJ, Larson DE, Miller CA, Koboldt DC, Welch JS, Ritchey JK, Young MA, Lamprecht T, McLellan MD, McMichael JF, Wallis JW, Lu C, Shen D, Harris CC, Dooling DJ, et al. Clonal evolution in relapsed acute myeloid leukaemia revealed by whole-genome sequencing. Nature. 2012; 481(7382):506-510.
53. Hou Y, Song L, Zhu P, Zhang B, Tao Y, Xu X, Li F, Wu K, Liang J, Shao D, Wu H, Ye X, Ye C, Wu R, Jian M, Chen Y, et al. Single-cell exome sequencing and monoclonal evolution of a JAK2-negative myeloproliferative neoplasm. Cell. 2012; 148(5):873-885.
54. Xu X, Hou Y, Yin X, Bao L, Tang A, Song L, Li F, Tsang S, Wu K, Wu H, He W, Zeng L, Xing M, Wu R, Jiang H, Liu X, et al. Single-cell exome sequencing reveals single-nucleotide mutation characteristics of a kidney tumor. Cell. 2012; 148(5):886-895.
55. Gerlinger M, Rowan AJ, Horswell S, Larkin J, Endesfelder D, Gronroos E, Martinez P, Matthews N, Stewart A, Tarpey P, Varela I, Phillimore B, Begum S, McDonald NQ, Butler A, Jones D, et al. Intratumor heterogeneity and branched evolution revealed by multiregion sequencing. The New England journal of medicine. 2012; 366(10):883-892.
56. Comprehensive molecular characterization of human colon and rectal cancer. Nature. 2012; 487(7407):330-337.
57. Miller CA, Hampton O, Coarfa C and Milosavljevic A. ReadDepth: a parallel R package for detecting copy number alterations from short sequencing reads. PloS one. 2011; 6(1):e16327.
58. Xi R, Hadjipanayis AG, Luquette LJ, Kim TM, Lee E, Zhang J, Johnson MD, Muzny DM, Wheeler DA, Gibbs RA, Kucherlapati R and Park PJ. Copy number variation detection in whole-genome sequencing data using the Bayesian information criterion. Proceedings of the National Academy of Sciences of the United States of America. 2011; 108(46):E1128-1136.
59. Mayrhofer M, Dilorenzo S and Isaksson A. Patchwork: allele-specific copy number analysis of whole-genome sequenced tumor tissue. Genome biology. 2013; 14(3):R24.
60. Yau C. OncoSNP-SEQ: a statistical approach for the identification of somatic copy number alterations from next-generation sequencing of cancer genomes. Bioinformatics. 2013; 29(19):2482-2484.
61. Sathirapongsasuti JF, Lee H, Horst BA, Brunner G, Cochran AJ, Binder S, Quackenbush J and Nelson SF. Exome sequencing-based copy-number variation and loss of heterozygosity detection: ExomeCNV. Bioinformatics. 2011; 27(19):2648-2654.
62. Koboldt DC, Zhang Q, Larson DE, Shen D, McLellan MD, Lin L, Miller CA, Mardis ER, Ding L and Wilson RK. VarScan 2: somatic mutation and copy number alteration discovery in cancer by exome sequencing. Genome research. 2012; 22(3):568-576.
63. Carter SL, Meyerson M and Getz G. Accurate estimation of homologue-specific DNA concentration-ratios in cancer samples allows long-range haplotyping. Preprint at http://precedingsnaturecom/documents/6494/version/1. 2011.
64. Carter SL, Cibulskis K, Helman E, McKenna A, Shen H, Zack T, Laird PW, Onofrio RC, Winckler W, Weir BA, Beroukhim R, Pellman D, Levine DA, Lander ES, Meyerson M and Getz G. Absolute quantification of somatic DNA alterations in human cancer. Nature biotechnology. 2012; 30(5):413-421.
65. Boeva V, Popova T, Bleakley K, Chiche P, Cappo J, Schleiermacher G, Janoueix-Lerosey I, Delattre O and Barillot E. Control-FREEC: a tool for assessing copy number and allelic content using next-generation sequencing data. Bioinformatics. 2012; 28(3):423-425.
66. Boeva V, Zinovyev A, Bleakley K, Vert JP, Janoueix-Lerosey I, Delattre O and Barillot E. Control-free calling of copy number alterations in deep-sequencing data using GC-content normalization. Bioinformatics. 2011; 27(2):268-269.
67. Whiteford N, Haslam N, Weber G, Prugel-Bennett A, Essex JW, Roach PL, Bradley M and Neylon C. An analysis of the feasibility of short read sequencing. Nucleic acids research. 2005; 33(19):e171.
68. Derrien T, Estelle J, Marco Sola S, Knowles DG, Raineri E, Guigo R and Ribeca P. Fast computation and applications of genome mappability. PloS one. 2012; 7(1):e30377.
69. Teo SM, Pawitan Y, Ku CS, Chia KS and Salim A. Statistical challenges associated with detecting copy number variations with next-generation sequencing. Bioinformatics. 2012; 28(21):2711-2718.
70. Abyzov A, Urban AE, Snyder M and Gerstein M. CNVnator: an approach to discover, genotype, and characterize typical and atypical CNVs from family and population genome sequencing. Genome research. 2011; 21(6):974-984.
71. Benjamini Y and Speed TP. Summarizing and correcting the GC content bias in high-throughput sequencing. Nucleic acids research. 2012; 40(10):e72.
72. Yoon S, Xuan Z, Makarov V, Ye K and Sebat J. Sensitive and accurate detection of copy number variants using read depth of coverage. Genome research. 2009; 19(9):1586-1592.
73. Taub MA, Corrada Bravo H and Irizarry RA. Overcoming bias and systematic errors in next generation sequencing data. Genome medicine. 2010; 2(12):87.
74. Aird D, Ross MG, Chen WS, Danielsson M, Fennell T, Russ C, Jaffe DB, Nusbaum C and Gnirke A. Analyzing and minimizing PCR amplification bias in Illumina sequencing libraries. Genome biology. 2011; 12(2):R18.
75. Ross MG, Russ C, Costello M, Hollinger A, Lennon NJ, Hegarty R, Nusbaum C and Jaffe DB. Characterizing and measuring bias in sequence data. Genome biology. 2013; 14(5):R51.
76. Nakamura K, Oshima T, Morimoto T, Ikeda S, Yoshikawa H, Shiwa Y, Ishikawa S, Linak MC, Hirai A, Takahashi H, Altaf-Ul-Amin M, Ogasawara N and Kanaya S. Sequence-specific error profile of Illumina sequencers. Nucleic acids research. 2011; 39(13):e90.
77. Olshen AB, Venkatraman ES, Lucito R and Wigler M. Circular binary segmentation for the analysis of array-based DNA copy number data. Biostatistics. 2004; 5(4):557-572.
78. Popova T, Manie E, Stoppa-Lyonnet D, Rigaill G, Barillot E and Stern MH. Genome Alteration Print (GAP): a tool to visualize and mine complex cancer genomic profiles obtained by SNP arrays. Genome biology. 2009; 10(11):R128.
79. Olshen AB, Bengtsson H, Neuvial P, Spellman PT, Olshen RA and Seshan VE. Parent-specific copy number in paired tumor-normal studies using circular binary segmentation. Bioinformatics. 2011; 27(15):2038-2046.
80. Eddy SR. What is a hidden Markov model? Nature biotechnology. 2004; 22(10):1315-1316.
81. Yau C, Mouradov D, Jorissen RN, Colella S, Mirza G, Steers G, Harris A, Ragoussis J, Sieber O and Holmes CC. A statistical approach for detecting genomic aberrations in heterogeneous tumor samples from single nucleotide polymorphism genotyping data. Genome biology. 2010; 11(9):R92.
82. Sun W, Wright FA, Tang Z, Nordgard SH, Van Loo P, Yu T, Kristensen VN and Perou CM. Integrated study of copy number states and genotype calls using high-density SNP arrays. Nucleic acids research. 2009; 37(16):5365-5377.
83. Bailey JA, Gu Z, Clark RA, Reinert K, Samonte RV, Schwartz S, Adams MD, Myers EW, Li PW and Eichler EE. Recent segmental duplications in the human genome. Science. 2002; 297(5583):1003-1007.
84. Korbel JO, Urban AE, Affourtit JP, Godwin B, Grubert F, Simons JF, Kim PM, Palejev D, Carriero NJ, Du L, Taillon BE, Chen Z, Tanzer A, Saunders AC, Chi J, Yang F, et al. Paired-end mapping reveals extensive structural variation in the human genome. Science. 2007; 318(5849):420-426.
85. Kidd JM, Cooper GM, Donahue WF, Hayden HS, Sampas N, Graves T, Hansen N, Teague B, Alkan C, Antonacci F, Haugen E, Zerr T, Yamada NA, Tsang P, Newman TL, Tuzun E, et al. Mapping and sequencing of structural variation from eight human genomes. Nature. 2008; 453(7191):56-64.
86. Pinto D, Darvishi K, Shi X, Rajan D, Rigler D, Fitzgerald T, Lionel AC, Thiruvahindrapuram B, Macdonald JR, Mills R, Prasad A, Noonan K, Gribble S, Prigmore E, Donahoe PK, Smith RS, et al. Comprehensive assessment of array-based platforms and calling algorithms for detection of copy number variants. Nature biotechnology. 2011; 29(6):512-520.
87. Redon R, Ishikawa S, Fitch KR, Feuk L, Perry GH, Andrews TD, Fiegler H, Shapero MH, Carson AR, Chen W, Cho EK, Dallaire S, Freeman JL, Gonzalez JR, Gratacos M, Huang J, et al. Global variation in copy number in the human genome. Nature. 2006; 444(7118):444-454.
88. Magi A, Benelli M, Yoon S, Roviello F and Torricelli F. Detecting common copy number variants in high-throughput sequencing data by using JointSLM algorithm. Nucleic acids research. 2011; 39(10):e65.
89. Krumm N, Sudmant PH, Ko A, O’Roak BJ, Malig M, Coe BP, Quinlan AR, Nickerson DA and Eichler EE. Copy number variation detection and genotyping from exome sequence data. Genome research. 2012; 22(8):1525-1532.
90. Klambauer G, Schwarzbauer K, Mayr A, Clevert DA, Mitterecker A, Bodenhofer U and Hochreiter S. cn.MOPS: mixture of Poissons for discovering copy number variations in next-generation sequencing data with a low false discovery rate. Nucleic acids research. 2012; 40(9):e69.
91. Navin N, Kendall J, Troge J, Andrews P, Rodgers L, McIndoo J, Cook K, Stepansky A, Levy D, Esposito D, Muthuswamy L, Krasnitz A, McCombie WR, Hicks J and Wigler M. Tumour evolution inferred by single-cell sequencing. Nature. 2011; 472(7341):90-94.
92. Huang W, Li L, Myers JR and Marth GT. ART: a next-generation sequencing read simulator. Bioinformatics. 2012; 28(4):593-594.
93. Hu X, Yuan J, Shi Y, Lu J, Liu B, Li Z, Chen Y, Mu D, Zhang H, Li N, Yue Z, Bai F, Li H and Fan W. pIRS: Profile-based Illumina pair-end reads simulator. Bioinformatics. 2012; 28(11):1533-1535.
94. McElroy KE, Luciani F and Thomas T. GemSIM: general, error-model based simulator of next-generation sequencing data. BMC genomics. 2012; 13:74.
95. Kim S, Jeong K and Bafna V. Wessim: a whole-exome sequencing simulator based on in silico exome capture. Bioinformatics. 2013; 29(8):1076-1077.