
INTRODUCTION
It has been reported that the fourth most malignant tumor is Gastric cancer (GC), which is the second leading cause of tumor related death in the world [1]. It was estimated that there were 24,590 new patients diagnosed with GC in the United States with 10,720 deaths in 2015 [2]. Patients with advanced GC have a median overall survival of less than 12 months [3–6]. From the aspect of active treatments and preventions, reliable prognostic biomarkers are valuable for improvement of prognosis in GC patients.
The human epidermal growth factor receptor (EGFR) is a cell membrane tyrosine kinase receptor. The prognostic significance of EGFR expression in GC patients was controversial in different studies. High EGFR expression has been reported to be correlated with poor prognosis in patients with GC [7–8]. However, it has been reported that patients with high EGFR expression had favorable prognosis than those with low EGFR expression [9]. Furthermore, EGFR expression has been reported to be not significantly associated with overall survival in patients with GC [10]. Even more interesting, the conclusions in two meta analyses were controversial too. Hong et al. reported that high EGFR expression was not an independent predictor for prognosis of GC patients [11]. However, Chen et al. reported that high EGFR expression had a significant predictive ability for prognosis in GC patients and might be useful for predicting prognosis of GC patients [12].
These opposed conclusions leaded to great confusion about prognostic significance of EGFR expression in patients with GC. Therefore, we performed this update meta-analysis to determine the clinicopathologic and prognostic significance of EGFR expression in GC patients.
RESULTS
Search results
The initial search returned 495 studies (with 28 duplicate studies). After screening the abstracts, 411 irrelevant studies were excluded according to the criteria of inclusion and exclusion. Reviewers identified 56 potential studies for full-text review and 31 studies were eliminated due to inadequate data for meta-analysis. Finally, 25 studies were included in the current meta-analysis [7, 9, 10, 19–40]. The detail of the screening process was shown in Figure 1.
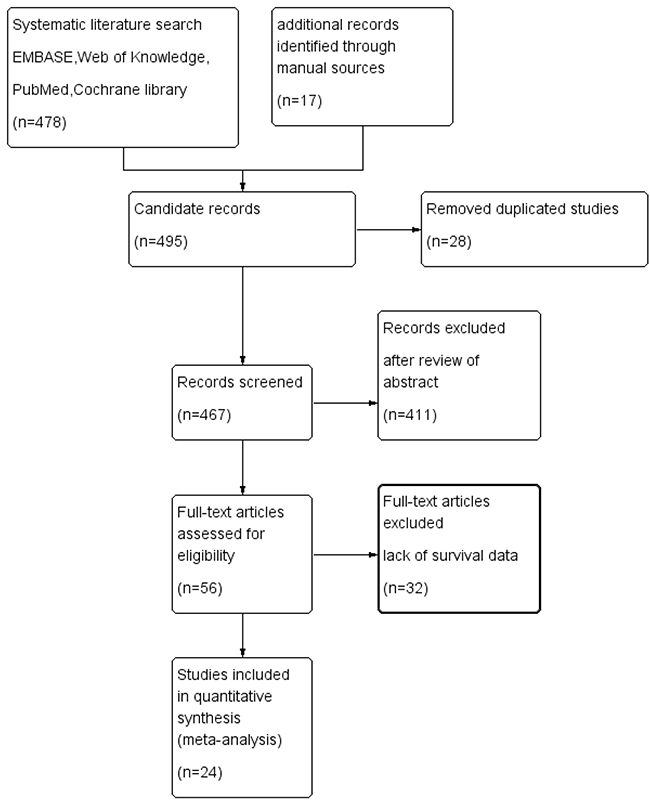
Figure 1: Flowchart of study selection in the present meta-analysis.
Study selection and characteristics
The characteristic of the included studies were summarized in Table 1. The publication time ranged from 1993 to 2016. The subject number of the included studies ranged from 30 to 950, with a mean sample size of 289. The mean length of follow-up period ranged from 11 to 96 months. The NOS score of 25 eligible studies varied from 7 to 8, with a mean value of 7.16. Twenty-five studies provided overall survival data and/or survival curves. Fifteen studies explored the association between EGFR expression and clinicopathologic parameters, such as invasion depth, tumor differentiation, tumor stage, and lymph node metastasis.
Table 1: Characteristics of studies included in the present meta analysis
Author |
Country |
Method |
Number |
Mean |
Male |
HR |
|||||
|---|---|---|---|---|---|---|---|---|---|---|---|
Year |
Language |
Cut-off value |
Study |
Positive |
Age range |
Female |
Tumor |
Follow-up |
95%CI |
P value |
NOS score |
Hirono |
Japan English |
IHC |
1983-1990 |
103 |
NR |
NR |
stage II–IV |
NR |
1.15 |
0.631 |
6 |
Jonjic |
Italy English |
IHC |
1987-1989 |
56 |
70 |
31/25 |
stage I–IV |
NR |
2.33 |
0.008 |
7 |
Song |
Korea English |
IHC |
1996-2001 |
739 |
59 |
495/244 |
stage I–III |
31(1-97) |
0.99 |
0.972 |
8 |
Langer |
Germany English |
IHC |
1991-2002 |
137 |
63 |
125/12 |
stage I–III |
36 |
1.01 |
0.039 |
7 |
Galizia |
Italy English |
IHC |
1996-2005 |
82 |
62 |
51/31 |
stage I–IV |
49(6-12) |
2.97 |
0.017 |
7 |
Matsubara |
Japan English |
IHC |
1997-2004 |
87 |
64 |
70/17 |
un-resectable or recurrent |
NR |
0.99 |
0.97 |
7 |
Kim |
Korea English |
IHC |
1999 |
511 |
55.4 |
NR |
stage I–IV |
68(1-108) |
1.84 |
0.001 |
7 |
Kim |
Korea English |
IHC |
1995-2003 |
153 |
52 |
108/45 |
stage III–IV |
72.9(2-135) |
0.605 |
0.045 |
8 |
Czyzewska |
Poland English |
IHC |
1996-1998 |
55 |
60 |
17/38 |
stage I–IV |
84 |
1.09 |
0.815 |
7 |
Inokuchi |
Japan English |
IHC |
1999-2002 |
126 |
NR |
88/38 |
stage I–IV |
73(2-135) |
2.2 |
0.053 |
7 |
Zhang |
China Chinese |
IHC |
2001-2008 |
84 |
55 |
47/37 |
stage II–IV |
11 |
1.33 |
0.37 |
7 |
Atmaca |
Germany English |
IHC |
NR |
357 |
NR |
214/143 |
stage IV |
18.2 |
0.91 |
0.464 |
8 |
Terashima |
Japan English |
IHC |
NR |
829 |
NR |
565/264 |
stage II–III |
60 |
1.64 |
0.008 |
7 |
Al-Moundhri et al 2012 |
Oman English |
IHC |
1995-2005 |
115 |
59.2 |
72/43 |
stage I–IV |
96 |
1.72 |
0.02 |
7 |
Gao |
China English |
IHC |
2000-2007 |
78 |
NR |
40/38 |
stage I–IV |
NR |
2.07 |
0.096 |
7 |
Li |
China Chinese |
IHC |
2006 |
161 |
61 |
124/37 |
stage I–IV |
39.6 |
1.01 |
0.974 |
7 |
Kandel |
France English |
IHC |
1999-2002 |
82 |
67 |
58/24 |
stage I–III |
40 |
1.68 |
0.158 |
7 |
Aydin |
Turkey English |
IHC |
2008-2011 |
30 |
34-85 |
20/10 |
stage II–IV |
12(2-25) |
0.36 |
0.118 |
7 |
Kurokawa |
Japan English |
IHC |
2000-2006 |
153 |
68 |
104/49 |
stage I–IV |
NR |
1.78 |
0.077 |
8 |
Fuse |
Japan English |
IHC |
2006-2010 |
293 |
≥20Y |
201/92 |
unresectable or recurrent |
58.4 |
1.12 |
0.401 |
7 |
Tang |
China English |
IHC |
2007-2010 |
121 |
NR |
85/36 |
stage II–IV |
NR |
1.41 |
0.306 |
7 |
Nagatsuma |
Japan English |
IHC |
2003-2007 |
950 |
63 |
734/316 |
stage I–IV |
60(1-120) |
0.58 |
0.007 |
7 |
Paliga |
Canada English |
IHC |
2002-2008 |
113 |
64 |
81/32 |
stage I–IV |
80(73-93) |
1.6 |
0.11 |
8 |
Seo |
Korea English |
HC |
2003-2010 |
879 |
NR |
NR |
stage I–IV |
NR |
0.66 |
0.377 |
7 |
Park |
Korea English |
IHC |
2000-2003 |
935 |
59 |
618/317 |
stage I–III |
NR |
0.92 |
0.57 |
7 |
* NOS, Newcastle-Ottawa Quality Assessment Scale; HR, hazard ratio; CI, confidence interval.
Association of EGFR expression with clinicopathologic parameters
The correlations between high EGFR expression and clinicopathologic parameters were presented in Figure 2. The random effects model was used for significant heterogeneity. As shown in Figure 2, high EGFR expression was found to be significantly related with lymph node metastasis (Figure 2A, present vs absent, OR=2.20, 95% CI: 1.63-2.96, Z=5.17, P=0.001), tumor differentiation (Figure 2B, poor vs well/moderate, OR=1.96, 95%CI: 1.14-3.34, Z=2.43, P=0.015), and tumor stage (Figure 2C, I-II vs III-IV, OR=2.13, 95% CI: 1.35-3.36, Z=3.25, P=0.001). However, high EGFR expression was not significantly associated with invasion depth (Figure 2D, present serosal invasion vs absent serosal invasion, OR=2.09,95% CI: 0.4-11.05, Z=0.87, P=0.385).
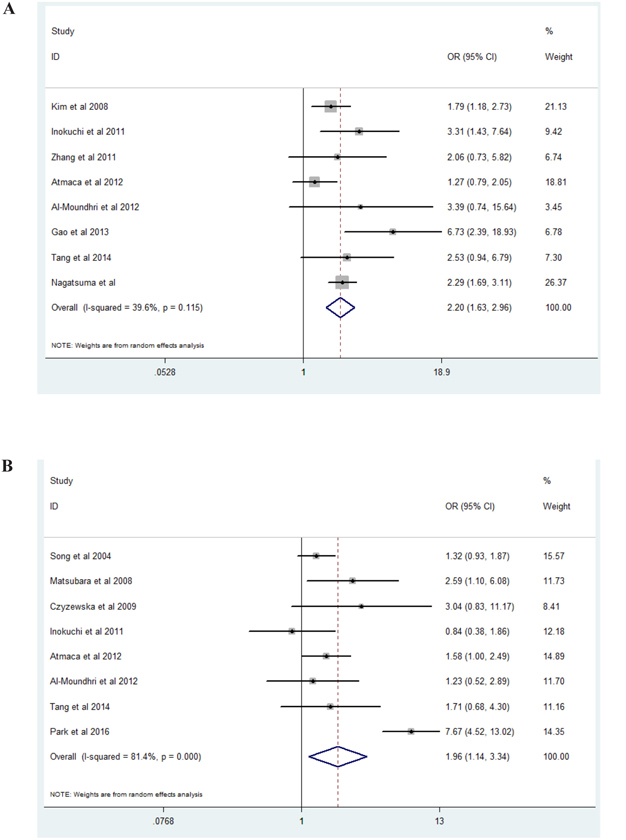
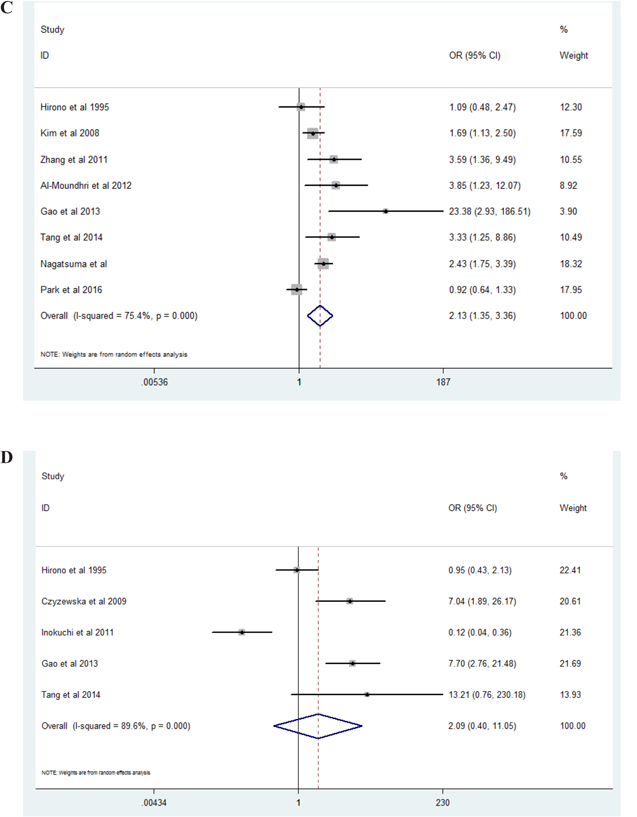
Figure 2: Forest plots of studies evaluating the correlation between EGFR expression and pathological parameters. A. Lymph node metastasis (present vs absent); B. Tumor differentiation (poor vs well/moderate); C. Tumor stage (I-II vs III-IV); D. Invasion depth (present serosal invasion vs absent serosal invasion).
Prognostic significance of EGFR expression in gastric cancer patients
A total of 7229 patients with GC from 25 eligible studies were collected and analyzed (Figure 3). The pooled HR was 1.19(95% CI 1.04-1.37, Z=2.44, P=0.015). The results demonstrated that high expression of EGFR significantly was related with poor prognosis for patients with GC.
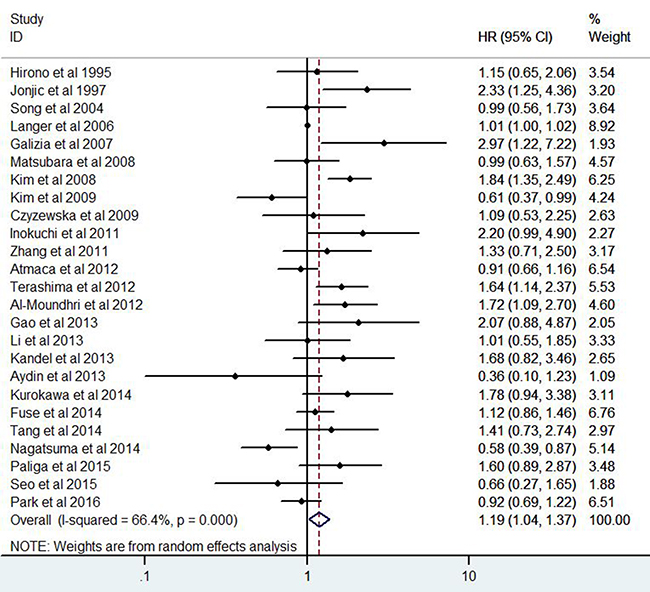
Figure 3: Forest plots of studies evaluating the hazard ratio of EGFR expression for overall survival.
Sensitivity analysis
All studies were sequentially removed to explore that whether any individual study had a significant influence to the pooled HR. The results of sensitivity analysis demonstrated that the pooled HR was not significantly affected by any study (Table 2).
Table 2: Effect of individual studies on the pooled HRs of EGFR expression and overall survival
Study omitted |
HR |
Lower value of 95% CI |
Upper value of 95% CI |
|---|---|---|---|
Hirono et al 1995 |
1.1928611 |
1.0328844 |
1.3776154 |
Jonjic et al 1997 |
1.1617202 |
1.0121113 |
1.3334442 |
Song et al 2004 |
1.1998487 |
1.0386479 |
1.3860684 |
Langer et al 2006 |
1.2199296 |
1.0275393 |
1.4483418 |
Galizia et al 2007 |
1.1671815 |
1.0171522 |
1.3393401 |
Matsubara et al 2008 |
1.2024842 |
1.0395564 |
1.3909475 |
Kim et al 2008 |
1.1484013 |
1.0027492 |
1.3152098 |
Kim et al 2009 |
1.2254386 |
1.063726 |
1.4117356 |
Czyzewska et al 2009 |
1.1940148 |
1.0348687 |
1.3776351 |
Inokuchi et al 2011 |
1.1723867 |
1.0195748 |
1.3481018 |
Zhang et al 2011 |
1.1865808 |
1.0283683 |
1.3691339 |
Atmaca et al 2012 |
1.2157478 |
1.0466765 |
1.4121294 |
Terashima et al 2012 |
1.1663924 |
1.0124791 |
1.3437031 |
Al-Moundhri et al 2012 |
1.1679779 |
1.0142503 |
1.3450057 |
Gao et al 2013 |
1.1759335 |
1.0220827 |
1.3529429 |
Li et al 2013 |
1.1981824 |
1.0376033 |
1.3836125 |
Kandel et al 2013 |
1.1790264 |
1.0234496 |
1.3582527 |
Aydin et al 2013 |
1.2049856 |
1.0482415 |
1.3851677 |
Kurokawa et al 2014 |
1.1744384 |
1.0198769 |
1.3524236 |
Fuse et al 2014 |
1.1992651 |
1.0315969 |
1.3941848 |
Tang et al 2014 |
1.1845405 |
1.0270487 |
1.3661827 |
Nagatsuma et al 2014 |
1.2351219 |
1.0736278 |
1.4209078 |
Paliga et al 2015 |
1.177506 |
1.0215301 |
1.3572975 |
Seo et al 2015 |
1.2041327 |
1.045177 |
1.387263 |
Park et al 2016 |
1.2147179 |
1.0458301 |
1.4108788 |
combined |
1.1901691 |
1.0350099 |
1.3685883 |
HR, hazard ratio; CI, confidence interval.
Publication bias
The funnel plot (Figure 4) was significantly asymmetry for overall survival. The Begg’s test did not find significant evidences for publication bias in terms of invasion depth(P=1.0), tumor stage(P=0.266), tumor differentiation(P=0.386), lymph node metastasis(P=0.711), and overall survival (P=0.266). The Egger’s test indicated that there were no evidences for publication bias in terms of invasion depth (P=0.613), tumor stage(P=0.192), tumor differentiation(P=0.803), and lymph node metastasis(P=0.216). However, the Egger’s test demonstrated that there might be potential publication bias (P=0.051) for overall survival.
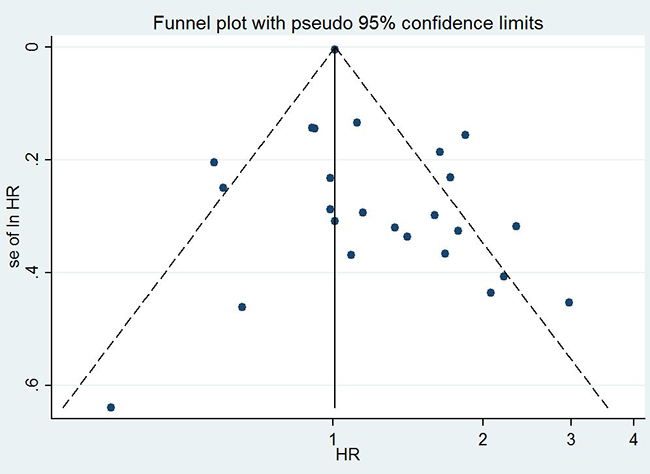
Figure 4: The funnel plot for all eligible studies provided HRs of EGFR expression for overall survival.
Explore the causes of the funnel plot asymmetry by Contour-enhanced funnel plot
The contour-enhanced funnel plot with the trim-and-fill method can help to determine whether or not the funnel plot asymmetry was caused by publication bias [18]. Contour lines which suggested conventional milestones in levels of statistical significance (0.01, 0.05, and 0.1) are added to conventional funnel plots. If the dummy studies lie in the areas with high statistical significance (P>0.05), this will suggest that the funnel plot asymmetry may be caused by factors other than publication bias, such as poor methodological quality or true heterogeneity. If the dummy studies lie in the areas with non-statistical significance, then this will indicate the possibility that the funnel plot asymmetry is due to publication bias. The dummy studies were indicated by red triangles and the genuine studies were indicated by green dots (Figure 5).
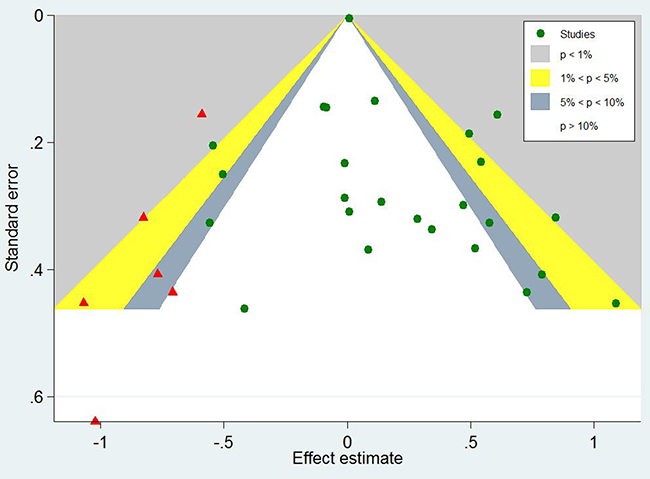
Figure 5: Contour-enhanced funnel plot with trim-and-fill method for OS in GC patients.
The contour-enhanced funnel plot with trim-and-fill method finally added 6 dummy studies to balance the funnel plot and 3 dummy studies lied in the areas with high statistical significance, indicating that the publication bias was not the only cause for the funnel plot asymmetry.
Stability assessment of EGFR expression for prognosis by cumulative meta-analysis method
We further performed cumulative meta-analysis to assess the stability of EGFR expression for prognosis of GC patients (Figure 6). The pooled HRs of cumulative meta-analysis ranged from 1.19(95%CI: 1.04-1.37) to 1.30 (95%CI: 1.08-1.55) for OS since 2012, demonstrating that performance of EGFR expression for prognosis in GC patients was stable and reliable.
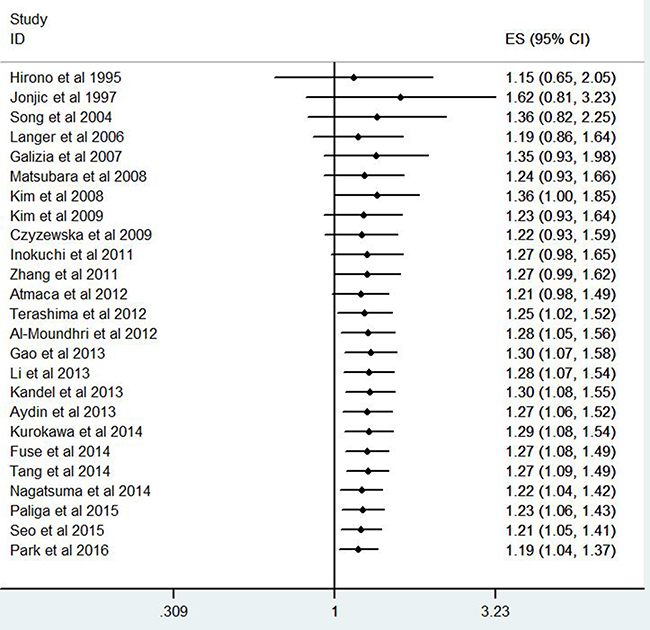
Figure 6: Cumulative meta-analysis for stability of EGFR expression for prognosis of GC patients.
Explore of sources of heterogeneity by meta-regression analysis and subgroup analysis
Meta-regression analysis and subgroup analysis were performed to explore the sources of heterogeneity. However, we did not find any significant source of heterogeneity using meta-regression analysis (data not shown) and subgroup analysis (Table 3).
Table 3: Subgroup analysis for association between EGFR expression and overall survival in GC patients
Overall survival |
95%CI |
Heterogeneity |
|||||
|---|---|---|---|---|---|---|---|
Group factors |
Subgroup |
HR |
P value |
Lower |
Upper |
I 2 |
P value |
Total |
Total |
1.19 |
0.015 |
1.04 |
1.37 |
66.4% |
0.001 |
Contain stage IV patients |
Yes |
1.11 |
0.302 |
0.91 |
1.37 |
55.9% |
0.059 |
No |
1.22 |
0.052 |
1.0 |
1.5 |
65.4% |
0.001 |
|
Chemistry therapy |
Yes |
1.21 |
0.291 |
0.85 |
1.71 |
65.4% |
0.008 |
No |
1.18 |
0.042 |
1.01 |
1.38 |
65.8% |
0.001 |
|
Patients number≥100 |
Yes |
1.13 |
0.113 |
0.97 |
1.31 |
68.5% |
0.001 |
No |
1.44 |
0.044 |
1.01 |
2.05 |
48.3% |
0.06 |
|
Positive rate≥50% |
Yes |
1.04 |
0.744 |
0.84 |
1.28 |
54.7% |
0.024 |
No |
1.29 |
0.012 |
1.06 |
1.59 |
63.1% |
0.001 |
|
HR, hazard ratio; CI, confidence interval.
Subsequently all studies were sequentially removed to explore that whether any individual study had a significant influence to the heterogeneity. The results showed that the study conducted by Kim et al. had the most significant impact in all 25 studies. The heterogeneity decreased from 66.4% to 59.4% after removing the study conducted by Kim et al.
DISCUSSION
Through the present meta analysis, we explored the clinicopathologic and prognostic significance of EGFR expression in GC patients. The combined ORs indicated that high EGFR expression was significantly correlated with tumor differentiation, lymph node metastasis, and tumor stage. The pooled HRs demonstrated that high EGFR expression significantly predicted poor OS compared with low EGFR expression. The results of sensitivity analysis and cumulative meta-analysis demonstrated that the performance of EGFR expression for prognosis in GC patients was stable and reliable.
It has been reported that the activation of EGFR leads to the phosphorylation of the intracellular tyrosine kinase and initiate a series of intracellular signal pathways such as the STAT, Ras-MAPK, and PI3K-AKT signaling pathway [8–9]. It has been found that these signaling pathways above can affect cell proliferation, angiogenesis, invasion, migration, metastasis, and apoptosis [41–42]. These studies provided reasonable interpretation of molecular biology for the prognostic role of EGFR expression in patients with GC.
The conclusion of the present meta analysis was different to that of two previous meta analyses. The differences in three different meta analyses might be caused by the following reasons. Firstly, the patient number in the present meta analysis was 7229, which was significantly more than that of two previous meta analyses (1289 and 1600, respectively). Secondly, the number of eligible studies included in two previous meta analyses were comparatively small (only five studies and seven studies, respectively), which might reduce the convincingness of the conclusions. Thirdly, selection bias might exist in these previous meta analyses for the reason that some eligible studies did not include in these two meta analyses. Fourthly, some studies with EGFR expression detected by Polymerase Chain Reaction (PCR) were included in meta analysis performed by Chen et al. [12] and might lead to clinical heterogeneity. Fifthly, Jácome AA et al. explored the association between EGFR expression and overall survival by Weibull model method [43], which was significantly different to COX regression model and might lead to statistical heterogeneity. To reduce clinical heterogeneity, the present meta analysis did not include the study performed by Jácome AA.
We detected significant heterogeneity in the current meta analysis. There might be some potential sources of heterogeneity such as cut-off values, tumor stages, treatments, and races. However, we did not find any significant source of heterogeneity using meta-regression analysis and subgroup analysis.
Publication bias is an important factor for interpretation of the conclusions. The funnel plot was asymmetry and the Egger’s test suggested that the existence of potential publication bias. The contour-enhanced funnel plot by using the trim-and-fill method was performed to explore the potential sources for the funnel plot asymmetry. There were 3 studies out of 6 added dummy studies lying in the areas with high statistical significance, meaning that the publication bias might not the only cause to the funnel plot asymmetry. The funnel plot asymmetry might be caused by the following factors such as language bias, location bias, citation bias, multiple publication bias, true heterogeneity, poor methodological quality of little sample studies, and selective reporting.
Although significant heterogeneity and publication bias were detected in the present meta-analysis, further sensitivity analyses ascertained that the prognostic significance of high EGFR expression in GC patients did not changed after removing any study. Meanwhile, cumulative meta-analyses also supported that the performance of high EGFR expression for prognosis of GC patients was stable and reliable.
The present meta analysis have several strengths: First, we first revealed that high EGFR expression is significantly correlated with tumor differentiation, lymph node metastasis, and tumor stage. Second, we included 25 eligible studies and 7229 GC patients through comprehensively search in several electronic databases and additional manual search. Third, all detection methods of EGFR expression were IHC, leading to less clinical heterogeneity. Fourth, studies published in Chinese were also included in the current meta analysis as English literature, increasing representation of the study population.
There were several limitations must be taken into account while interpreting the conclusions of the present meta analysis. First, high EGFR expression was defined according to different cut-off values in various studies, which might affect the stability of the conclusions in different studies. Second, different baseline characteristics, such as tumor stages, treatments, and races, might lead to clinical heterogeneity. Third, to reduce clinical heterogeneity, the studies with EGFR expression detected by Western blot (WB) or Polymerase Chain Reaction (PCR) were excluded from the present study, which might influence the clinical applicability. We recommend that the studies with EGFR expression detected by WB or PCR method should be included in future study to further explore the prognostic role of EGFR expression in GC patients. Fourth, the present meta analysis only provided evidences for correlation between high EGFR and clinicopathologic features, which could not be simply interpreted as causal relationship.
In conclusion, the present meta analysis demonstrated that high EGFR expression is correlated with poor OS, tumor differentiation, lymph node metastasis and tumor stage. Therefore, EGFR expression may serve as a valuable biomarker for predicting tumor prognosis in GC patients.
MATERIALS AND METHODS
Search strategy
A systematic search was performed in the following electronic databases: PubMed, EMBASE, Cochrane Library, and Wed of Knowledge database from Jan 1970 to May 2016 for eligible studies, which assessing the clinicopathologic and prognostic significance of EGFR expression for prognosis in GC patients. We performed literature search by strategy combined text word and MeSH (Emtree for EMBASE database accordingly) with the terms “EGFR” or “ErbB1” or “HER1” or “epidermal growth factor receptor” and “gastric cancer” or “gastric carcinoma” or “stomach tumor” and “survival” or “outcome” or “prognosis” or “prognostic”. The strategy was correspondingly adjusted in different databases. In the retrieval process, expanded search of hyponym was performed. Additional, we made a manual search using the reference lists of the included studies for including eligible studies. We even contacted the corresponding author to get necessary information if necessary. The search was restricted to human studies, but there were no restrictions on language or publication time. All clinical investigation and data achievement were conducted according to the principles of Declaration of Helsinki.
Criteria for inclusion and exclusion
The inclusion criteria were as follows: (1) proven pathological diagnosis of GC in humans; (2) EGFR expression evaluation using immunohistochemistry (IHC) method; (3) provided information on clinicopathological parameters and/or survival outcome such as hazard ratio (HR) and 95% confidence interval (CI). Studies not directly providing hazard ratio and 95% confidence interval were included if survival information were available from survival curves. Studies published in Chinese were included in the current meta-analysis as English literature. Only the most recent study was included in the current meta-analysis among duplicate studies. There were no restrictions on sample size or follow-up period.
The following studies were excluded: (1) reviews, letters, case reports, and conference abstracts without original data; (2) non-human experiments;(3) laboratory studies;(4) studies from which the necessary information could not be extracted.
Quality assessment of studies
Two reviewers (Zhiqiao Zhang and Jixin Lin) independently assessed the quality of the studies included in the present meta-analysis using the Newcastle-Ottawa Quality Assessment Scale (NOS) (Table 1). The NOS contains assessments of patient selection, study comparability, follow-up, and outcome of interest. The total scores were used to compare study quality. Disagreements in the literature assessment were resolved through consensus with the third reviewer (Hongfeng Tang).
Data extraction
Two investigators (Zhiqiao Zhang and Jixin Lin) independently extracted and examined the following data from the original studies: surname of the first author, publication year, country, sample size, disease stage, detection method of EGFR expression, clinical parameters, and survival outcome data (HR and CI). Information from each eligible study was extracted and recorded in a standardized form. All eligible studies were coded as surname of the first author + publish year in the standardized form. When it was necessary, study authors were contacted for necessary information. Disagreements between two investigators were resolved by discussion. When necessary, the third investigator (Hongfeng Tang) helped to reach a consensus.
Statistical analysis
The statistical analysis was executed according to the proposals of the Meta-Analysis of Observational Studies in Epidemiology group (MOOSE) [13]. The HRs and 95% CIs were used to summary survival information. We directly obtained pooled HRs and 95% CIs if the survival data were reported in the text. While the HRs and 95% CIs were not directly reported in the text, the survival information were extracted from Kaplan-Meier curve and used to estimate HR. The heterogeneity was assessed by using I2 statistic, which was defined according to the Cochrane Handbook [14]: 0% to 40%, negligible heterogeneity; 30% to 60%, moderate heterogeneity; 50% to 90%, substantial heterogeneity; 75% to 100%, considerable heterogeneity. The subsequently meta-analysis was performed using random effect model with DerSimonian and Laird method [15], which applying the inverse of variance as a weighing factor. Meta-regression analyses with REstricted Maximum Likelihood (REML) method and subgroup analyses were performed to explore the sources of heterogeneity. Funnel plot, Begg's test [16], and Egger's test [17] were used to assess the publication bias. The contour-enhanced funnel plot with the trim-and-fill methodwas performed to determine whether or not funnel plot asymmetry was caused by publication bias [18]. P value<0.05 was considered statistically significant. The statistical analyses were performed by STATA version 12.0 software (Stata Corporation, College Station, Texas, USA).
ACKNOWLEDGMENTS
This study was funded in part by Health Department and Finance Department of Guangdong Province.
CONFLICTS OF INTEREST
The authors have declared that they had no conflicts of interests.
FUNDING
This study was funded in part by Health Department and Finance Department of Guangdong Province. The Grant Numbers were No: A2013695 (Grant Recipient: Peng Wang) and No: A2016450 (Grant Recipient: Zhiqiao Zhang). The total funding account was RMB 15000.
The funders had no role in study design, data collection and analysis, decision to publish, or preparation of the manuscript.
Author contribution
Peng Wang, Hongfeng Tang, and Zhiqiao Zhang designed the study. Zhiqiao Zhang and Jixin Lin performed the research; Zhiqiao Zhang and Jixin Lin collected and analyzed the data; Zhiqiao Zhang and Jixin Lin wrote the paper; Yunzhao Hu, Guanying Luo, Zhaowen Luo, and Canchang Cheng amended the article. Peng Wang and Zhiqiao Zhang act as the submission's guarantor and takes responsibility for the integrity of the work as a whole, from inception to published article. All authors reviewed the manuscript.
REFERENCES
1. Ferlay J, Shin HR, Bray F, Forman D, Mathers C, Parkin M. Estimates of worldwide burden of cancer in 2008: GLOBOCAN 2008. Int J Cancer. 2010; 127:2893-17.
2. Siegel RL, Miller KD, Jemal A. Cancer statistics, 2015. CA Cancer J Clin. 2015; 65:5-29.
3. Dikken JL, van de Velde CJ, Coit DG, Shah MA, Verheji M, Cats A. Treatment of resectable gastric cancer. Ther Adv Gastroenterol. 2012; 5:49-69.
4. Schuhmacher C, Reim D, Novotny A. Neoadjuvant treatment for gastric cancer. J Gastric Cancer. 2013; 13:73-78.
5. Ferlay J, Soerjomataram I, Dikshit R, Eser S, Mathers C, Rebelo M, Parkin DM, Forman D, Bray F. Cancer incidence and mortality worldwide: sources, methods and major patterns in GLOBOCAN. 2012. Int J Cancer. 2015; 136:359-86.
6. Cunningham D, Starling N, Rao S, Iveson T, Nicolson M, Coxon F, Middleton G, Daniel F, Oates J, Norman AR. Capecitabine and oxaliplatin for advanced esophagogastric cancer. N Engl J Med. 2008; 358:36-46.
7. Inokuchi M, Murayama T, Hayashi M, Takagi Y, Kato K, Enjoji M, Kojima K, Kumagai J, Sugihara K. Prognostic value of co-expression of STAT3, mTOR and EGFR in gastric cancer. Exp Ther Med. 2011; 2:251-56.
8. Kim JW, Kim HP, Im SA, Kang S, Hur HS, Yoon YK, Oh DY, Kim JH, Lee DS, Kim TY, Bang YJ. The growth inhibitory effect of lapatinib, a dual inhibitor of EGFR and HER2 tyrosine kinase, in gastric cancer cell lines. Cancer Lett. 2009; 272:296-06.
9. Kim JS, Kim MA, Kim TM, Lee SH, Kim DW, Im SA, Kim TY, Kim WH, Yang HK, Heo DS, Bang YJ, Lee KU, Choe KJ, et al. Biomarker analysis in stage III-IV (M0) gastric cancer patientswho received curative surgery followed by adjuvant 5-fluorouracil and cisplatinchemotherapy: epidermal growth factor receptor (EGFR) associated withfavourable survival. Br J Cancer. 2009; 100:732-38.
10. Matsubara J, Yamada Y, Hirashima Y, Takahari D, Okita NT, Kato K, Hamaguchi T, Shirao K, Shimada Y, Shimoda T. Impact of insulin-like growth factor type 1 receptor, epidermal growth factor receptor, and HER2 expressions on outcomes of patients with gastric cancer. Clin Cancer Res. 2008; 14:3022-29.
11. Hong L, Han Y, Yang J, Zhang H, Jin Y, Brain L, Li M, Zhao Q. Prognostic value of epidermal growth factor receptor in patients with gastric cancer: A meta-analysis. Gene. 2013; 529:69-72.
12. Chen C, Yang JM, Hu TT, Xu TJ, Yan G, Hu SL, Wei W, Xu WP. Prognostic role of human epidermal growth factor receptor ingastric cancer: a systematic review and meta-analysis. Arch Med Res. 2013; 44:380-89.
13. Stroup DF, Berlin JA, Morton SC, Olkin I, Williamson GD, Rennie D, Moher D, Becker BJ, Sipe TA, Thacker SB. Meta-analysis of observational studies in epidemiology: a proposal for reporting. Meta-analysis Of Observational Studies in Epidemiology (MOOSE) group. JAMA. 2000; 283:2008-12.
14. Higgins JP, Green S. Cochrane Handbook for Systematic Reviews of Interventions. Version 5.1.0. The Cochrane Collaboration. 2011. Retrieved from: http://handbook.cochrane.org/.
15. DerSimonian R, Laird N. Meta-analysis in clinical trials. Control Clin Trials. 1986; 7:177-88.
16. Begg CB, Mazumdar M. Operating characteristics of a rank correlation test for publication bias. Biometrics. 1994; 50:1088-01.
17. Egger M, Davey SG, Schneider M, Minder C. Bias in meta-analysis detected by a simple, graphical test. BMJ. 1997; 315:629-34.
18. Peters JL, Sutton AJ, Jones DR, Abrams KR, Rushton L. Contour-enhanced meta-analyses funnel plots help distinguish publication bias from other causes of asymmetry. J Clin Epidemiol. 2008; 61:991-96.
19. Hirono Y, Tsugawa K, Fushida S, Ninomiya I, Yonemura Y, Miyazaki I, Endou Y, Tanaka M, Sasaki T. Amplification of epidermal growth factor receptor gene and its relationship to survival in human gastric cancer. Oncology. 1995; 52:182-88.
20. Jonjic N, Kovac K, Krasevic M, Valkovic T, Ernjak N, Sasso F, Melato M. Epidermal growth factor-receptor expression correlates with tumor cell proliferation and prognosis in gastric cancer. Anticancer Res.1997; 17:3883-88.
21. Song HS, Do YR, Kim IH, Sohn SS, Kwon KY. Prognostic significance of immunohistochemical expression of EGFR and C-erbB-2 oncoprotein in curatively resected gastric cancer. Cancer Res Treat. 2004; 36:240-45.
22. Langer R, Von Rahden BH, Nahrig J, Von Weyhern C, Reiter R, Feith M, Stein HJ, Siewert JR, Hofler H, Sarbia M. Prognostic significance of expression patterns of c-erbB-2, p53, p16INK4A, p27KIP1, cyclin D1 and epidermal growth factor receptor in oesophageal adenocarcinoma: a tissue microarray study. J Clin Pathol. 2006; 59:631-34.
23. Galizia G, Lieto E, Orditura M, Castellano P, Mura AL, Imperatore V, Pinto M, Zamboli A, De Vita F, Ferraraccio F. Epidermal growth factor receptor (EGFR) expression is associated with a worse prognosis in gastric cancer patients undergoing curative surgery. World J Surg. 2007; 31:1458-68.
24. Kim MA, Lee HS, Lee HE, Jeon YK, Yang HK, Kim WH. EGFR in gastric carcinomas: prognostic significance of protein overexpression and high gene copy number. Histopathology. 2008; 52:738-46.
25. Czyzewska J, Guzinska-Ustymowicz K, Kemona A. Correlation of c-erbB-2, EGF and EGFR expression with postoperative survival of patients with advanced carcinoma of the stomach. Folia Histochem Cytobiol. 2009; 47:653-61.
26. Zhang HY, Tao HM, Chen HT. Expression and clinical significance of epidermal growth factor receptor and protein kinase B in gastric carcinoma. [Article in Chinese]. Zhonghua Wei Chang Wai Ke Za Zhi. 2011; 14:140-42.
27. Atmaca A, Werner D, Pauligk C, Steinmetz K, Wirtz R, Altmannsberger HM, Jager E, Al-Batran SE. The prognostic impact of epidermal growth factor receptor in patients with metastatic gastric cancer. BMC Cancer. 2012; 12:524.
28. Terashima M, Kitada K, Ochiai A, Ichikawa W, Kurahashi I, Sakuramoto S, Katai H, Sano T, Imamura H, Sasako M. Impact of expression of human epidermal growth factor receptors EGFR and ERBB2 on survival in stage II/III gastric cancer. Clin Cancer Res. 2012; 18:5992-00.
29. Al-Moundhri MS, Al-Hadabi I, Al-Mawaly K, Kumar S, Al-Lawati FA, Bhatnager G, Kuruvila S, Al-Hamdani A, El-Sayed SM, Al-Bahrani B. Prognostic significance of cyclooxygenase-2, epidermal growth factor receptor 1, and microvascular density in gastric cancer. Med Oncol. 2012; 29:1739-47.
30. Gao M, Liang XJ, Zhang ZS, Ma W, Chang ZW, Zhang MZl. Relationship between expression of EGFR in gastric cancer tissue and clinicopathological features. Asian Pac J Trop Med. 2013; 6:260-64.
31. Li G, Gu RM, Wen X, Ming XZ, Xia L, Xu XY, Zhang J, Chen HQ. Clinical significance of human epidermal growth factor receptor family molecules expression in gastric cancer. [Article in Chinese]. Zhonghua Wei Chang Wai Ke Za Zhi. 2013; 16:668-72.
32. Kandel C, Leclair F, Bou-Hanna C, Laboisse CL, Mosnier JF. Association of HER1 amplification with poor prognosis in well differentiated gastric carcinomas. J Clin Pathol. 2014; 67:307-12.
33. Aydin K, Okutur SK, Bozkurt M, Turkmen I, Namal E, Pilanci K, Ozturk A, Akcali Z, Dogusoy G, Demir OG. Effect of epidermal growth factor receptor status on the outcomes of patients with metastatic gastric cancer: A pilot study. Oncol Lett. 2014; 7:255-59.
34. Kurokawa Y, Matsuura N, Kawabata R, Nishikawa K, Ebisui C, Yokoyama Y, Shaker MN, Hamakawa T, Takahashi T, Takiguchi S, Mori M, Doki Y. Prognostic impact of major receptor tyrosine kinase expression in gastric cancer. Ann Surg Oncol. 2014; 21:584-90.
35. Fuse N, Kuboki Y, Kuwata T, Nishina T, Kadowaki S, Shinozaki E, Machida N, Yuki S, Ooki A, Kajiura S, Kimura T, Yamanaka T, Shitara K, Nagatsuma AK, Yoshino T, Ochiai A, Ohtsu A. Prognostic impact of HER2, EGFR, and c-MET status on overall survival of advanced gastric cancer patients. Gastric Cancer. 2016; 19:183-91.
36. Tang D, Liu CY, Shen D, Fan S, Su X, Ye P, Gavine PR, Yin X. Assessment and prognostic analysis of EGFR, HER2, and HER3 protein expression in surgically resected gastric adenocarcinomas. Onco Targets Ther. 2015; 8:7-14.
37. Nagatsuma AK, Aizawa M, Kuwata T, Doi T, Ohtsu A, Fujii H. Expression profiles of HER2, EGFR, MET and FGFR2 in a large cohort of patients with gastric adenocarcinoma. Gastric Cancer. 2015; 18:227-38.
38. Paliga A, Marginean H, Tessier-Cloutier B, Purgina B, Jonker D, Marginean EC. The Prognostic Significance of c-MET and EGFR Overexpression in Resected Gastric Adenocarcinomas. Am J Clin Oncol. 2015.
39. Seo JY, Jin EH, Jo HJ, Yoon H, Shin CM, Park YS, Kim N, Jung HC, Lee DH. Clinicopathologic and molecular features associated with patient age in gastric cancer. World J Gastroenterol. 2015; 21:6905-13.
40. Park JS, Kim HS, Bae YS, Cheong JH, Rha SY, Noh SH, Kim H. Prognostic significance and frequency of EGFR expression and amplification in surgically resected advanced gastric cancer. Jpn J Clin Oncol.2016; 46:507-16.
41. Troiani T, Martinelli E, Capasso A, Morgillo F, Orditura M, De Vita F, Ciardiello F. Targeting EGFR in pancreatic cancer treatment. Curr Drug Targets. 2012; 13:802-10.
42. Seshacharyulu P, Ponnusamy MP, Haridas D, Jain M, Ganti AK, Batra SK. Targeting the EGFR signaling pathway in cancer therapy. Expert Opin Ther Targets. 2012; 16:15-31.
43. Jácome AA, Wohnrath DR, Scapulatempo Neto C, Carneseca EC, Serrano SV, Viana LS, Nunes JS, Martinez EZ, Santos JS. Prognostic value of epidermal growth factor receptors in gastric cancer: a survival analysis by Weibull model incorporating long-term survivors. Gastric Cancer. 2014; 17:76-86.