
INTRODUCTION
Malignant cells are known to reprogram their metabolism to boost the rapid growth, proliferation and long-lasting maintenance [1, 2]. The common features of this increased metabolism are elevated glucose uptake and lactic fermentation of glucose even under aerobic condition, which is termed “the Warburg effect” [2, 3]. The increased glucose uptake in malignant tumors is largely dependent on specific transmembranous glucose transporter proteins (GLUTs). Glucose transporter 1 (GLUT1), also named facilitates glucose transporter member 1 or solute carrier family 2 (SLC2A1), is a uniporter protein in humans encoded by the SLC2A1 gene [4]. In normal tissues, GLUT1 is limited to be expressed on erythrocytes and endothelial cells in the blood-brain barriers [5]. Recently, GLUT1 has been demonstrated to be a pivotal rate-limiting element in the transport of glucose in malignancy cells and overexpressed in different types of human cancers [6–10]. A plenty of researches showed that GLUT1 is involved in the progression and metastasis of cancer cell [11, 12] In addition, overexpression of GLUT1 is correlated with vascular invasion, microvessel density and depth of invasion in carcinomas [13]. In light of the promoting role of GLUT1 in tumor metabolism and development, targeting GLUT1 for therapeutics and prevention might be conducive.
The correlation between GLUT1 expression and prognosis in cancer patients has been investigated. A myriad of studies showed that elevated expression level of GLUT1 in malignant tumors was correlated with poor clinical outcomes in patients with diverse types of solid tumors such as lung cancer [14, 15], breast cancer [16, 17], esophageal cancer [18], hepatocellular carcinoma [10], gallbladder carcinoma [19], colorectal cancer [20–23], oral squamous cell carcinoma [24–28], bladder cancer [29], ovarian cancer [30], head and neck squamous cell carcinoma [31], and salivary gland tumor [32]. However, some other researches showed overexpression of GLUT1 was related to favorable clinical outcome [33]. In addition, several researches revealed that the expression of GLUT1 was not significantly associated with prognosis of patients [19, 34–37]. Taken together, the exact clinical and prognostic merit of GLUT1 overexpression in various solid tumors remains unclear.
We herein performed an exhaustive meta-analysis to appraise the prognostic significance of GLUT1 overexpression in solid tumors. The objective of our analysis was to value the relationship of elevated GLUT1 expression status with prognostic outcomes in solid human tumors, and illustrate the clinical value of GLUT1 as a prognostic indicator and potential therapeutic target for malignant tumor patients.
RESULTS
Search results and study characteristics
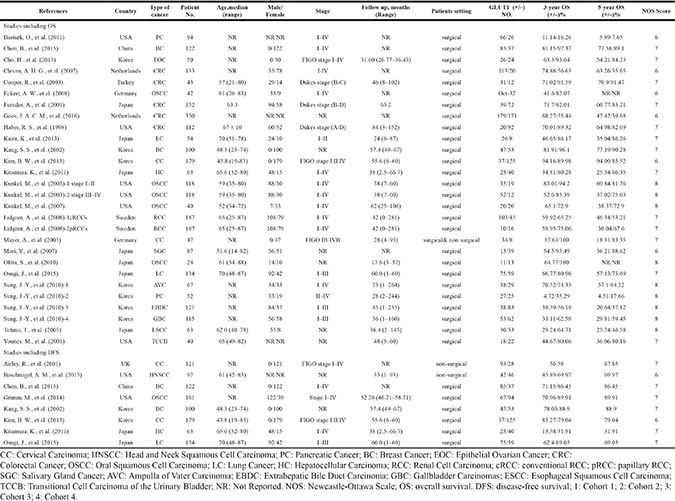
26 researches with a total of 2948 patients were ultimately involved (Figure 1). The main characteristics of included researches were presented in Table 1. Five researches appraised colorectal cancer [20–23, 33], five evaluated orals squamous cell carcinoma [24–28], three evaluated cervical cancer [35, 36, 38], two studies evaluated lung cancer [14, 15], two evaluated breast cancer [16, 17], two studies evaluated pancreatic cancer [19, 34] and one each evaluated esophageal cancer [18], hepatocellular carcinoma[10], gallbladder carcinoma [19], bladder cancer [29], ovarian cancer [30], head and neck squamous cell carcinoma [31], renal cancer [37], and salivary gland tumor [32]. All these 26 studies evaluated GLUT1. As for the region, 12 studies were conducted in Asia, seven studies in America, and seven studies in Europe.
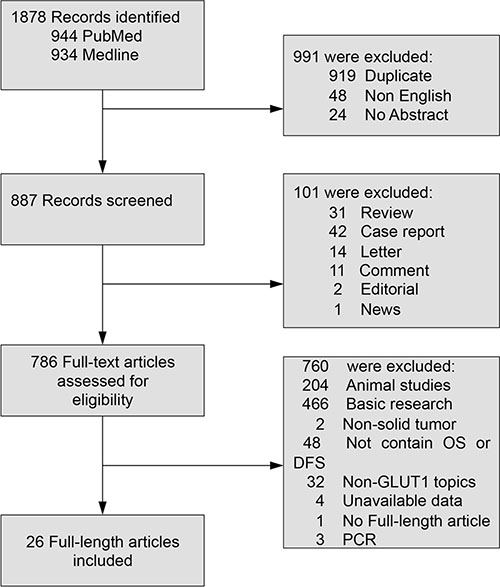
Figure 1: Flowchart of study selection in the meta-analysis. OS: overall survival; DFS: disease-free survival.
Table 1: Characteristics of studies included in the meta-analysis
Assessment and expression status of GLUT1
A depiction of primary antibodies, and cut-off values of GLUT1 utilized in the eligible researches was presented in Table 2. Different antibodies were utilized for the appraisement of GLUT1 expression by immunohistochemistry (IHC). For anti-GLUT1 antibody, five researches utilized clone MYM, four researches utilized clone A3536, one research each used clone AB15309, SPM498, OH-217, and fourteen researches did not mention the antibody clone. Among the groups identified as GLUT1 positive, the median expression of GLUT1 in solid tumors was 50.00%, range from 17.87% to 84.96%.
Table 2: Evaluation of human GLUT1 by IHC in the selected studies
References |
Type of tumor |
Cutoff |
Antibody (Clone) |
|---|---|---|---|
Airley, R., et al. (2001) |
CC |
IHC score ≥ 1 |
anti-GLUT1(NR); Alpha Diagnostic International |
Baschnagel, A. M., et al. (2015) |
HNSCC |
IHC score ≥ 3 |
anti-GLUT1(NR); Abcam |
Basturk, O., et al. (2011) |
PC |
IHC score ≥ 1 |
anti-GLUT1(NR); polyclonal antibody; DAKO |
Chen, B., et al. (2015) |
BC |
IHC score ≥ 2 |
NR |
Cho, H., et al. (2013) |
EOC |
IHCscore > 3.85 |
anti-GLUT1(NR); monoclonal antibody; R&D Systems |
Cleven, A. H. G., et al. (2007) |
CRC |
IHC >5% |
anti-GLUT1(A3536); polyclonal antibody; DAKO |
Cooper, R., et al. (2003). |
CRC |
IHC >1% |
anti-GLUT1(NR); Alpha Diagnostic International |
Eckert, A. W., et al. (2008). |
OSCC |
IHC score ≥ 9 |
anti-GLUT1(NR); Acris antibodies |
Furudoi, A., et al. (2001) |
CRC |
IHC > 30% |
anti-GLUT1(MYM); polyclonal antibody; DAKO |
Goos, J. A. C. M., et al. (2016) |
CRC |
NR |
anti-GLUT1(NR); polyclonal antibody; Abcam |
Grimm, M., et al. (2014) |
OSCC |
IHC > 10% |
anti-GLUT1(NR); polyclonal antibody; Dako |
Haber, R. S., et al. (1998) |
CRC |
IHC > 50% |
NR |
Kaira, K., et al. (2013) |
LC |
IHC > 25% |
anti-GLUT1(AB15309); polyclonal antibody; Abcam |
Kang, S. S., et al. (2002) |
BC |
IHC > 0 |
anti-GLUT1(NR); polyclonal antibody; DAKO |
Kim, B. W., et al. (2013) |
CC |
IHCscore ≥ 8 |
anti-GLUT1(SPM498); NeoMarkers |
Kitamura, K., et al. (2011) |
HC |
IHC score > 0 |
anti-GLUT1(A3536); DAKO |
Kunkel, M., et al. (2003) |
OSCC |
IHC > 50% |
anti-GLUT1(MYM); polyclonal antibody; Chemicon |
Kunkel, M., et al. (2007) |
OSCC |
IHC > 65% |
anti-GLUT1(MYM); polyclonal antibody; Chemicon |
Lidgren, A., et al. (2008) |
RCC |
NR |
anti-GLUT1(NR); monoclonal antibody; Alpha Diagnostic International |
Mayer, A., et al. (2005) |
CC |
IHC score ≥ 1 |
anti-GLUT1(MYM); polyclonal antibody; DakoCytomation |
Mori, Y., et al. (2007) |
SGC |
IHC ≥ 15% |
anti-GLUT1(A3536); polyclonal antibody; DAKO |
Ohba, S., et al. (2010) |
OSCC |
IHC score ≥ 6 |
anti-GLUT-1(OH-217); polyclonal antibody; IBL, Co., Ltd |
Osugi, J., et al. (2015) |
LC |
IHC > 50% |
anti-GLUT1(A3536); polyclonal antibody; DAKO |
Sung, J.-Y., et al. (2010)-1 |
AVC |
IHC ≥ 5% |
anti-GLUT1(NR); polyclonal antibody; DAKO |
Sung, J.-Y., et al. (2010)-2 |
PC |
IHC ≥ 5% |
anti-GLUT1(NR); polyclonal antibody; DAKO |
Sung, J.-Y., et al. (2010)-3 |
EBDC |
IHC ≥ 5% |
anti-GLUT1(NR); polyclonal antibody; DAKO |
Sung, J.-Y., et al. (2010)-4 |
GBC |
IHC ≥ 5% |
anti-GLUT1(NR); polyclonal antibody; DAKO |
Tohma, T., et al. (2005) |
ESCC |
IHC > 30% |
anti-GLUT1(NR); polyclonal antibody; DAKO |
Younes, M., et al. (2001) |
TCCB |
IHC > 10% |
anti-GLUT1(MYM); polyclonal antibody; Chemicon |
CC: Cervical Carcinoma; HNSCC: Head and Neck Squamous Cell Carcinoma; PC: Pancreatic Cancer; BC: Breast Cancer; EOC: Epithelial Ovarian Cancer; CRC: Colorectal Cancer; OSCC: Oral Squamous Cell Carcinoma; LC: Lung Cancer; HC: Hepatocellular Carcinoma; RCC: Renal Cell Carcinoma; SGC: Salivary Gland Cancer; AVC: Ampulla of Vater Carcinoma; EBDC: Extrahepatic Bile Duct Carcinoma; GBC: Gallbladder Carcinomas; ESCC: Esophageal Squamous Cell Carcinoma; TCCB: Transitional Cell Carcinoma of the Urinary Bladder; NR: Not Reported.
Association of GLUT1 with OS
There were 23 studies reporting data for 3-year OS. Results revealed that GLUT1 overexpression in the tumor tissue was correlated with poor survival outcome of cancer patients (OR: 2.86; 95% CI, 1.90–4.32, P < 0.00001) (Figure 2). In light of high degree heterogeneity among these 23 included researches (P < 0.00001, I2 = 68%), we proceeded to perform a subgroup analysis to explore if different cancer types lead to the heterogeneity. Five researches indicated 3-year OS for colorectal carcinoma, five for oral squamous cell carcinoma, two for lung cancer, two for cervical cancer, two for breast cancer and two for pancreatic carcinoma. In the stratified analysis, expression status of GLUT1 was associated with unfavorable clinical results of oral squamous cell carcinoma (OR: 3.79; 95% CI, 1.74–8.24, P = 0.0008) (Figure 3A), and breast carcinoma (OR: 2.32; 95% CI, 1.02–5.30, P = 0.04) (Figure 3B). whereas, no association was found between high expression of GLUT1 and survival of colorectal carcinoma (OR: 1.50; 95% CI, 0.53–4.22, P = 0.45) (Supplementary Figure 1A), lung carcinoma (OR: 2.77; 95% CI, 1.02–7.51, P = 0.05) (Supplementary Figure 1B), cervical carcinoma (OR: 3.03; 95% CI, 0.05–176.64, P = 0.59) (Supplementary Figure 1C) and pancreatic carcinoma (OR: 4.04; 95% CI, 0.43–38.08, P = 0.22) (Supplementary Figure 1D).
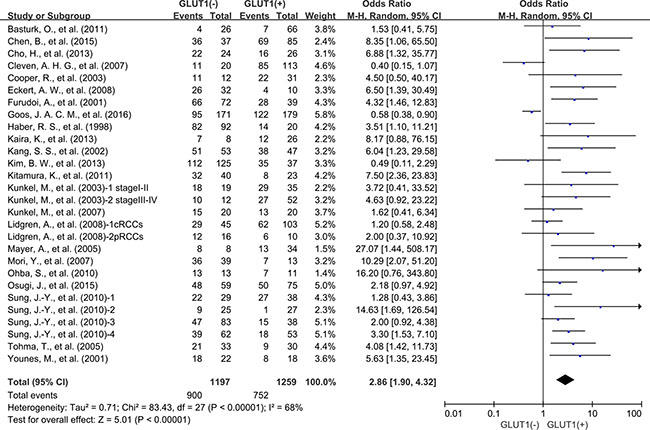
Figure 2: The association between expression level of GLUT1 and 3-year overall survival (OS).
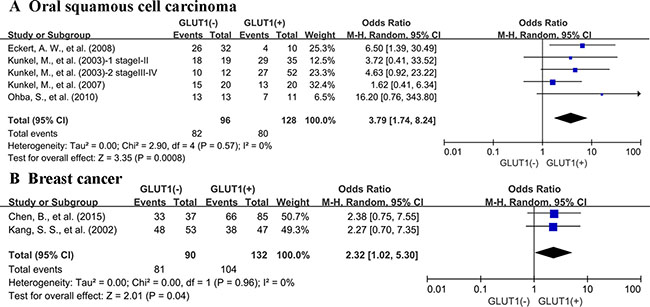
Figure 3: Subgroup analysis of 3-year OS by expression level of GLUT1 in different cancer types. (A) oral squamous cell carcinoma; (B) breast cancer.
There are 21 studies presenting data for 5-years OS of cancer patients. Similar to the condition in 3-year OS, high GLUT1 expression was also correlated with unfavorable OS at 5 years (OR: 2.52; 95% CI, 1.75–3.61, P < 0.0000, I2 = 65%) (Figure 4). Because of the high degree of heterogeneity detected among these researches, we performed subgroup analysis based on various cancer types. Five researches offered 5-year OS for colorectal carcinoma, three for oral squamous cell carcinoma, two for lung cancer, two for breast cancer and two for pancreatic carcinoma. High expression status of GLUT1 was related to poor 5-year OS of oral squamous cell carcinoma (OR: 2.70; 95% CI, 1.57–4.65, P = 0.0003) (Figure 5A), and breast carcinoma (OR: 6.81; 95% CI, 1.94-23.98, P = 0.003) (Figure 5B). However, there was no correlation between overexpression level of GLUT1 and prognosis of colorectal carcinoma (OR: 1.46; 95% CI, 0.74–2.88, P = 0.27) (Supplementary Figure 2A), lung carcinoma (OR: 3.78; 95% CI, 0.65–22.01, P = 0.14) (Supplementary Figure 2B), and pancreatic carcinoma (OR: 2.14; 95% CI, 0.53–8.61, P = 0.28) (Supplementary Figure 2C).
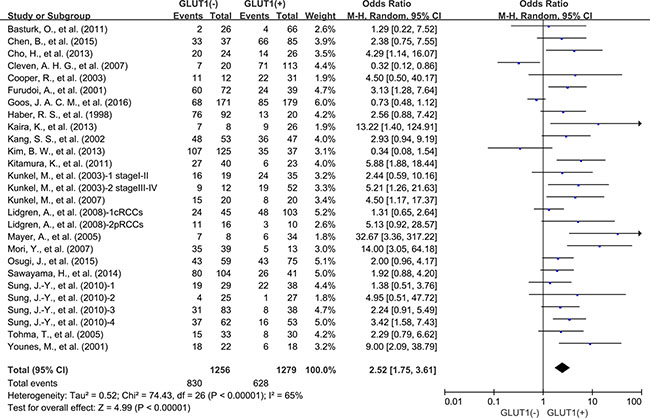
Figure 4: 5-year OS by GLUT1 expression.
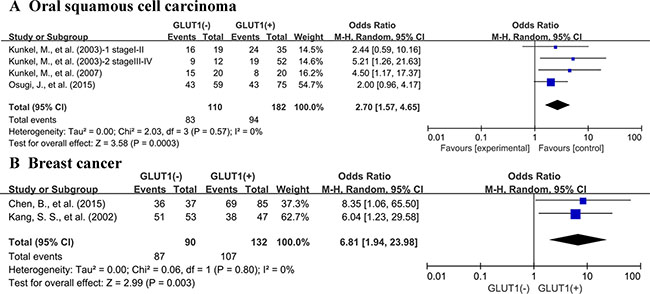
Figure 5: Subgroup analysis of 5-year OS by GLUT1 expression in various tumor types. (A) oral squamous cell carcinoma; (B) breast cancer.
Next, we performed a subgroup analysis based on GLUT1 expression level. Results showed expression status of GLUT1 was related to unfavorable OS at 3 years in the researches using cutoff values of 10%–30% (OR: 5.24; 95% CI, 2.89–9.50, P < 0.00001), and 50% (OR: 2.65; 95% CI, 1.47–4.77, P = 0.001) (Figure 6) to determine GLUT1 positivity. Similar results were also observed in 5-year OS (Supplementary Figure 3). However, the researches used the cutoff value of 1%–5% was not correlated with 3-year OS and 5-year OS.
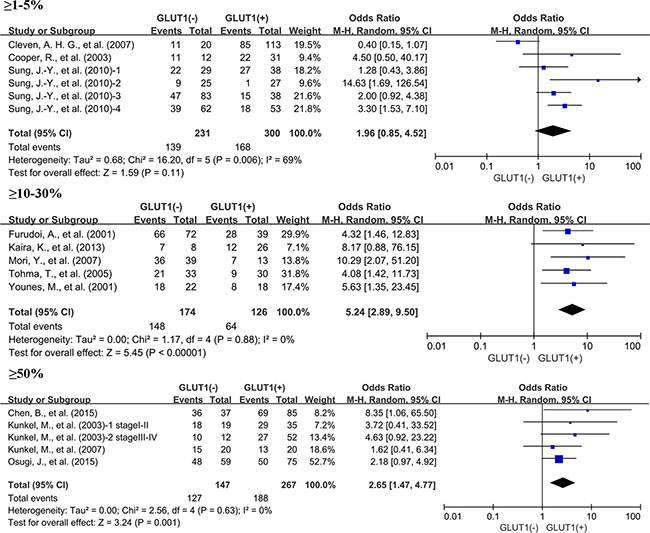
Figure 6: Subgroup analysis of the relationship between GLUT1 overexpression and 3-year OS of patients with solid tumors according to cut-off values identifying GLUT1 positivity.
We have also compared the OS among studies from Asian countries and Caucasian countries based on the expression status of GLUT1. The elevated expression of GLUT1 was correlated with poor 3-year OS (OR: 3.53; 95% CI, 2.35–5.30, P < 0.00001) and 5-year OS (OR: 2.66; 95% CI, 1.90–3.73, P < 0.00001) in Asian countries. Similar results were observed when analysis of studies from Caucasian countries was performed.
In addition, analysis of four studies revealed that no correlation between GLUT1 overexpression status and 10-year OS was discovered (OR: 2.08; 95% CI, 0.83–5.20, P = 0.12) (Supplementary Figure 4). We also assessed the relationship between high expression of GLUT1 and the TNM stage of solid tumors. But the expression status of GLUT1 was not significantly related to TNM stage (OR: 0.72; 95% CI, 0.39–1.33, P = 0.30) (Supplementary Figure 5).
Meta-regression analysis showed that publication year, country, age, gender, and NOS score did not contribute to the heterogeneity (data not shown).
Association of GLUT1 with DFS
Meta-analysis of eight studies showed that GLUT1 expression was correlated with poor 3-year DFS (OR: 1.94; 95% CI, 1.30–2.90, P = 0.001) (Figure 7A) and poor 5-year DFS (OR: 2.07; 95% CI, 1.26–3.40, P = 0.004) (Figure 7B).
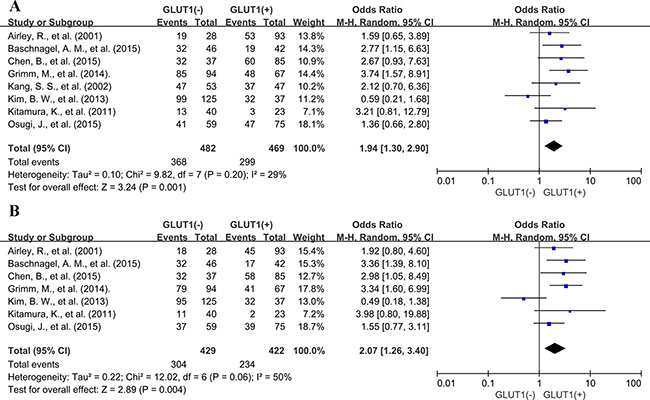
Figure 7: Three and five-year DFS by GLUT1 expression. (A) 3-year DFS; (B) 5-year DFS.
Interestingly, no association was found between GLUT1 overexpression and 3-year, 5-year DFS (OR: 1.59; 95% CI, 0.92–2.75, P = 0.10; OR: 1.59; 95% CI, 0.70–3.62, P = 0.27) (Supplementary Figure 6) in Asian countries, whereas elevated expression of GLUT1 was significantly correlated with unfavorable DFS at 3 years (OR: 2.57; 95% CI, 1.55–4.26, P = 0.0003) and 5-year DFS (OR: 2.84; 95% CI, 1.77–4.57, P < 0.0001) in Caucasian countries. (Figure 8).
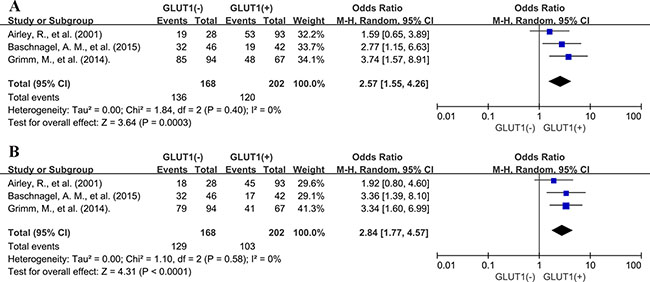
Figure 8: Subgroup analysis of association between GLUT1 overexpression and 3-year DFS. (A) and 5-year DFS (B) in Caucasian countries.
Sensitivity analyses
Removal of the studies that was an outlier (IRS ≥ 6 or IHC > 50%) or no report (NR) with regard to the cutoff of GLUT1 overexpression by IHC did not affect outcomes for OS and heterogeneity at 3 or 5 years (OR: 3.62; 95% CI, 2.24–5.84, P < 0.00001, I2 = 54%; OR: 2.99; 95% CI, 1.94–4.60, P < 0.00001, I2 = 55%).
Exclusion of the three studies that patients did not undergo surgical treatment did not change results of OS and heterogeneity at 3 or 5 years (OR: 2.76; 95% CI, 1.83–4.15, P < 0.00001, I2 = 68%; OR: 2.38; 95% CI, 1.67–3.39, P < 0.00001, I2 = 68%, respectively). Similar results were observed when analysis of DFS was performed.
Among studies containing only surgical cases, removal of the two studies that patients received preoperative treatment and eight studies that patients underwent adjuvant therapy such as chemotherapy, radiotherapy, interferon or hormones after curative operation, did not affect consequences for OS and heterogeneity at 3 or 5 years (OR: 3.10; 95% CI, 1.82–5.28, P < 0.0001, I2 = 74%; OR: 2.54; 95% CI, 1.63–3.96, P < 0.0001, I2 = 70%, respectively). Similar results were observed when analysis of DFS was performed.
Removal of studies with NOS score 6 failed to impose impact of the results for OS at 3 years (OR: 3.30; 95% CI, 2.45–4.45, P < 0.00001). Omission of these studies improved heterogeneity for 3-year OS (P = 0.22, I2 = 18%). Similar results were observed in the analysis of 5-year OS.
Publication bias
Funnel plot analysis and Begg’s tests about OS and DFS at 3 and 5 years were performed to assess publication bias (Supplementary Figures 7–10). Although 5-year OS showed publication bias under Begg’s test (P = 0.008), but no other evidences of publication bias for the studies contained in our meta-analysis were observed (3-year OS, P = 0.061; 3-year DFS, P = 1.000; 5-year DFS, P = 1.000). And we strictly followed inclusion criteria and criteria for protection of bias. Therefore, we considered our results is credible.
DISCUSSION
Numerous studies have reported that GLUT1 is dysregulated in various types of human cancers [20, 23, 38], and implicated in the cancer progression and metastasis [11, 12]. But it remains unclear about the effect of GLUT1 on clinical outcomes and if the outcomes are unanimous among diverse cancer types. Our comprehensive meta-analysis of 2948 patients contained in 26 different studies indicates that the expression status of GLUT1 is a promising biomarker of unfavorable prognosis, with consistent results of OS at 3- and 5-years. Among the tumor types evaluated, overexpression of GLUT1 in tumor tissues was related with adverse OS at 3 and 5 years of oral squamous cell carcinoma and breast cancer. Our analysis found there was no significant correlation between GLUT1 overexpression and OS of colorectal cancer, lung cancer, cervical cancer and pancreatic cancer. The discordance among different types of solid tumors reveals that further researches are warranted to clarify the underlying mechanism and role of GLUT1 in pathogenesis and prognostic merit in various tumor settings.
GLUT1, one of the GLUT family, is restrictively expressed in erythrocytes and the endothelial cells of barrier tissues like blood-brain barriers, and responsible for the passive transport of glucose through the cell membrane. The full-length GLUT1 protein, with a canonical major facilitator superfamily fold, is captured in an inward-open formation [39]. Overexpression of GLUT1 is transcriptionally activated by hypoxia and hypoxia-inducible factors in glucose metabolism [40, 41]. A growing body of study has revealed that GLUT1 is dysregulated in various solid tumors, and is implicated in cancer progression and metastasis. Researches also revealed that GLUT1 expression status was correlated with 18F-FDG uptake [42], suggesting GLUT1 as a potential prognostic indicator for tumor progression or occurrence. The expression of GLUT1 in positron emission tomography (PET)-positive lesions was higher than in PET-negative ones of primary tumors as well as metastatic lymph nodes. Apart from being a potential biomarker, GLUT1 also plays a pivotal role in anticancer treatment. In light of GLUT1 as a major receptor for uptake of Vitamin C, an interesting study discovered that cultured human colorectal cancer cells with BRAF or KRAS mutations are selectively exterminated after high dose of vitamin C treatment, as a result of elevated GLUT1-facilitated uptake of the oxidized form of vitamin C, namely dehydroascorbate, which indicates a potentially novel therapy for KRAS or BRAF mutant colorectal cancers [43]. In addition, some inhibitors of GLUT1 such as fasentin [44] and histone deacetylase inhibitors [45] are potential therapeutic drugs for cancer. However, the relationship between overexpression of GLUT1 and clinical prognosis in human solid tumors remains unknown. Considering the vital role of GLUT1 both in biology mechanism and clinical application, we conducted the first meta-analysis to assess the clinical and prognostic merit of GLUT1 expression status in solid tumors.
Our meta-analysis results involve several important implications. First, it shows that GLUT1 expression is correlated to the unfavorable outcome of most solid tumors, which indicates that GLUT1 may serve as a promising therapeutic target. Second, it identifies a subgroup of tumors with adverse outcome in oral squamous cell carcinoma and breast cancer. Finally, it highlights the potential clinical application of GLUT1 as a valuable prognostic biomarker.
Several limitations also exist in our study. First, the methods and cut-off values for assessing expression status of GLUT1 are inconsistent. Second, some studies with negative results may not be published, which could cause publication bias. Lastly, substantial heterogeneity observed across eligible studies cannot be completely clarified despite appropriate meta-analytic techniques with random-effects models are used.
In this meta-analysis performed, our results show that GLUT1 overexpression in solid cancers, as evaluated by IHC, is correlated with an unfavorable prognosis in various types of tumors, suggesting that directly targeting GLUT1 could be promising therapeutic approaches for solid malignancies.
MATERIALS AND METHODS
This meta-analysis was conducted in light of the Preferred Reporting Items for Systematic Reviews and Meta-Analyses (PRISMA) statement [46]. This study was based on the analysis and summary of the results of previously published studies, so there is no need for the ethical approval.
Search protocol
We conducted a thorough search of Pubmed and Web of Science for studies measuring expression of GLUT1 and survival in patients with solid tumors from 1993 to April 2016. The search terms “GLUT1” and “neoplasms” were used and the results were restricted to human studies of solid tumors. A total of 944 and 934 entries were identified, respectively. Inclusion criteria were the measurement of GLUT1 by immunohistochemistry (IHC), availability of survival data for at least 3 years, and publication in English. Studies assessing gene expression of GLUT1 measured by polymerase chain reaction were excluded. We reviewed the citation lists of retrieved articles to ensure sensitivity of the search strategy. Study selection was based on the correlation of GLUT1 and clinical outcome. Inter-reviewer agreement was assessed by Cohen’s kappa coefficient. Any disagreements between assessors were resolved by consulting a third assessor until a final consensus was reached.
Endpoints of interest
Overall survival (OS) at 3, 5 and 10 years was recorded as the primary outcome of interest, and disease-free survival (DFS) at 3 and 5 years was recorded as the secondary clinical outcomes. Tumors were classified by GLUT1 expression status using cut-offs as defined by each study.
Data extraction process and quality assessment
The following details were independently extracted by two authors (JW and CYY): name of first author, publication year, country, type of cancer, the number of patients, median age, gender, time of follow-up, cut-off value to determine GLUT1 positivity, and antibody used for the evaluation. OS data were extracted from the tables or Kaplan-Meier curves for both GLUT1 negative and GLUT1 positive group. The studies included in this meta-analysis were all cohort studies. Two authors independently measured the quality of each included study by Newcastle-Ottawa Scale (NOS) [47]. A consensus NOS score for each study was achieved by discussion. 6 scores or more were taken to denote studies of high quality.
Data synthesis
The relative frequency of OS at 3-, 5-, 10-year and DFS at 3-, 5-year between GLUT1 negative and GLUT1 positive group was reported as an odds ratio (OR) and its 95% confidence interval (CI). Sensitivity analysis was performed for different analytical methods and NOS scores for quality evaluation of included studies.
Statistical analysis
Data extracted from the primary publications were analysed by RevMan 5.3 analysis software (Cochrane Collaboration, Copenhagen, Denmark). Estimates of ORs were weighted and pooled using the Mantel–Haenszel random effect model. Statistical heterogeneity was evaluated with the Cochran’s Q and I2 statistics. Differences between subgroups were assessed in accordance with the Cochrane Handbook for Systematic Reviews of Interventions [48]. Meta-regression analysis was performed by Stata 12.0 software (StataCorp LP, College Station, TX). All statistical tests were two-sided, and statistical significance was defined as P less than 0.05.
ACKNOWLEDGMENTS AND FUNDING
We thank all the group members for helpful discussions. The work is supported by National Natural Science Foundation of China (No. 81602471 and No. 81672729) and by grant from Sub project of China National Program on Key Basic Research Project (973 Program) (No. 2014CB744505).
CONFLICTS OF INTEREST
The authors declare no competing financial interest.
REFERENCES
1. Furuta E, Okuda H, Kobayashi A, Watabe K. Metabolic genes in cancer: their roles in tumor progression and clinical implications. Biochim Biophys Acta. 2010; 1805:141–152.
2. Liberti MV, Locasale JW. The Warburg Effect: How Does it Benefit Cancer Cells? Trends Biochem Sci. 2016; 41:211–218.
3. Warburg O. On the origin of cancer cells. Science. 1956; 123:309–314.
4. Mueckler M, Caruso C, Baldwin SA, Panico M, Blench I, Morris HR, Allard WJ, Lienhard GE, Lodish HF. Sequence and structure of a human glucose transporter. Science. 1985; 229:941–945.
5. Pardridge WM, Boado RJ, Farrell CR. Brain-type glucose transporter (GLUT-1) is selectively localized to the blood-brain barrier. Studies with quantitative western blotting and in situ hybridization. J Biol Chem. 1990; 265:18035–18040.
6. Macheda ML, Rogers S, Best JD. Molecular and cellular regulation of glucose transporter (GLUT) proteins in cancer. J Cell Physiol. 2005; 202:654–662.
7. Medina RA, Owen GI. Glucose transporters: expression, regulation and cancer. Biol Res. 2002; 35:9–26.
8. Higashi T, Tamaki N, Torizuka T, Nakamoto Y, Sakahara H, Kimura T, Honda T, Inokuma T, Katsushima S, Ohshio G, Imamura M, Konishi J. FDG uptake, GLUT-1 glucose transporter and cellularity in human pancreatic tumors. J Nucl Med. 1998; 39:1727–1735.
9. Higashi T, Saga T, Nakamoto Y, Ishimori T, Mamede MH, Wada M, Doi R, Hosotani R, Imamura M, Konishi J. Relationship between retention index in dual-phase F-FDG PET, and hexokinase-II and glucose transporter-1 expression in pancreatic cancer. J Nucl Med. 2002; 43:173–180.
10. Kitamura K, Hatano E, Higashi T, Narita M, Seo S, Nakamoto Y, Yamanaka K, Nagata H, Taura K, Yasuchika K, Nitta T, Uemoto S. Proliferative activity in hepatocellular carcinoma is closely correlated with glucose metabolism but not angiogenesis. J Hepatol. 2011; 55:846–857.
11. Younes M, Lechago LV, Lechago J. Overexpression of the human erythrocyte glucose transporter occurs as a late event in human colorectal carcinogenesis and is associated with an increased incidence of lymph node metastases. Clin Cancer Res. 1996; 2:1151–1154.
12. de Wit M, Jimenez CR, Carvalho B, Belien JA, Delis-van Diemen PM, Mongera S, Piersma SR, Vikas M, Navani S, Ponten F, Meijer GA, Fijneman RJ. Cell surface proteomics identifies glucose transporter type 1 and prion protein as candidate biomarkers for colorectal adenoma-to-carcinoma progression. Gut. 2012; 61:855–864.
13. Sawayama H, Ishimoto T, Watanabe M, Yoshida N, Baba Y, Sugihara H, Izumi D, Kurashige J, Baba H. High expression of glucose transporter 1 on primary lesions of esophageal squamous cell carcinoma is associated with hematogenous recurrence. Ann Surg Oncol. 2014; 21:1756–1762.
14. Kaira K, Murakami H, Endo M, Ohde Y, Naito T, Kondo H, Nakajima T, Yamamoto N, Takahashi T. Biological correlation of 8F-FDG uptake on PET in pulmonary neuroendocrine tumors. Anticancer Res. 2013; 33:4219–4228.
15. Osugi J, Yamaura T, Muto S, Okabe N, Matsumura Y, Hoshino M, Higuchi M, Suzuki H, Gotoh M. Prognostic impact of the combination of glucose transporter 1 and ATP citrate lyase in node-negative patients with non-small lung cancer. Lung cancer. 2015; 88:310–318.
16. Chen B, Tang H, Liu X, Liu P, Yang L, Xie X, Ye F, Song C, Xie X, Wei W. miR-22 as a prognostic factor targets glucose transporter protein type 1 in breast cancer. Cancer Lett. 2015; 356:410–417.
17. Kang SS, Chun YK, Hur MH, Lee HK, Kim YJ, Hong SR, Lee JH, Lee SG, Park YK. Clinical significance of glucose transporter 1 (GLUT1) expression in human breast carcinoma. Jpn J Cancer Res. 2002; 93:1123–1128.
18. Tohma T, Okazumi S, Makino H, Cho A, Mochizuki R, Shuto K, Kudo H, Matsubara K, Gunji H, Matsubara H, Ochiai T. Overexpression of glucose transporter 1 in esophageal squamous cell carcinomas: a marker for poor prognosis. Dis Esophagus. 2005; 18:185–189.
19. Sung JY, Kim GY, Lim SJ, Park YK, Kim YW. Expression of the GLUT1 glucose transporter and p53 in carcinomas of the pancreatobiliary tract. Pathol Res Pract. 2010; 206:24–29.
20. Cooper R, Sarioglu S, Sokmen S, Fuzun M, Kupelioglu A, Valentine H, Gorken IB, Airley R, West C. Glucose transporter-1 (GLUT-1): a potential marker of prognosis in rectal carcinoma? Br J Cancer. 2003; 89:870–876.
21. Furudoi A, Tanaka S, Haruma K, Yoshihara M, Sumii K, Kajiyama G, Shimamoto F. Clinical significance of human erythrocyte glucose transporter 1 expression at the deepest invasive site of advanced colorectal carcinoma. Oncology. 2001; 60:162–169.
22. Goos JACM, de Cuba EMV, Coupe VMH, Diosdado B, Delis-Van Diemen PM, Karga C, Belien JAM, Menke-Van der Houven van Oordt CW, Geldof AA, Meijer GA, Hoekstra OS, Fijneman RJA. Glucose Transporter 1 (SLC2A1) and Vascular Endothelial Growth Factor A (VEGFA) Predict Survival After Resection of Colorectal Cancer Liver Metastasis. Ann Surg. 2016; 263:138–145.
23. Haber RS, Rathan A, Weiser KR, Pritsker A, Itzkowitz SH, Bodian C, Slater G, Weiss A, Burstein DE. GLUT1 glucose transporter expression in colorectal carcinoma: a marker for poor prognosis. Cancer. 1998; 83:34–40.
24. Eckert AW, Lautner MHW, Taubert H, Schubert J, Bilkenroth U. Expression of Glut-1 is a prognostic marker for oral squamous cell carcinoma patients. Oncol Rep. 2008; 20:1381–1385.
25. Grimm M, Munz A, Teriete P, Nadtotschi T, Reinert S. GLUT-1(+)/TKTL1(+) coexpression predicts poor outcome in oral squamous cell carcinoma. Oral Surg Oral Med Oral Pathol Oral Radiol. 2014; 117:743–753.
26. Kunkel M, Moergel M, Stockinger M, Jeong JH, Fritz G, Lehr HA, Whiteside TL. Overexpression of GLUT-1 is associated with resistance to radiotherapy and adverse prognosis in squamous cell carcinoma of the oral cavity. Oral Oncol. 2007; 43:796–803.
27. Kunkel M, Reichert TE, Benz P, Lehr H-A, Jeong J-H, Wieand S, Bartenstein P, Wagner W, Whiteside TL. Overexpression of Glut-1 and increased glucose metabolism in tumors are associated with a poor prognosis in patients with oral squamous cell carcinoma. Cancer. 2003; 97:1015–1024.
28. Ohba S, Fujii H, Ito S, Fujimaki M, Matsumoto F, Furukawa M, Yokoyama J, Kusunoki T, Ikeda K, Hino O. Overexpression of GLUT-1 in the invasion front is associated with depth of oral squamous cell carcinoma and prognosis. J Oral Pathol Med. 2010; 39:74–78.
29. Younes M, Juarez D, Lechago LV, Lerner SP. Glut 1 expression in transitional cell carcinoma of the urinary bladder is associated with poor patient survival. Anticancer Res. 2001; 21:575–578.
30. Cho H, Lee YS, Kim J, Chung J-Y, Kim J-H. Overexpression of glucose transporter-1 (GLUT-1) predicts poor prognosis in epithelial ovarian cancer. Cancer Invest. 2013; 31:607–615.
31. Baschnagel AM, Wobb JL, Dilworth JT, Williams L, Eskandari M, Wu D, Pruetz BL, Wilson GD. The association of F-FDG PET and glucose metabolism biomarkers GLUT1 and HK2 in p16 positive and negative head and neck squamous cell carcinomas. Radiother Oncol. 2015; 117:118–124.
32. Mori Y, Tsukinoki K, Yasuda M, Miyazawa M, Kaneko A, Watanabe Y. Glucose transporter type 1 expression are associated with poor prognosis in patients with salivary gland tumors. Oral Oncol. 2007; 43:563–569.
33. Cleven AHG, van Engeland M, Wouters BG and de Bruine AP. Stromal expression of hypoxia regulated proteins is an adverse prognostic factor in colorectal carcinomas. Cell Oncol. 2007; 29:229–240.
34. Basturk O, Singh R, Kaygusuz E, Balci S, Dursun N, Culhaci N, Adsay NV. GLUT-1 expression in pancreatic neoplasia: implications in pathogenesis, diagnosis, and prognosis. Pancreas. 2011; 40:187–192.
35. Airley R, Loncaster J, Davidson S, Bromley M, Roberts S, Patterson A, Hunter R, Stratford I, West C. Glucose transporter glut-1 expression correlates with tumor hypoxia and predicts metastasis-free survival in advanced carcinoma of the cervix. Clin Cancer Res. 2001; 7:928–934.
36. Kim BW, Cho H, Chung JY, Conway C, Ylaya K, Kim JH, Hewitt SM. Prognostic assessment of hypoxia and metabolic markers in cervical cancer using automated digital image analysis of immunohistochemistry. J Transl Med. 2013; 11:185.
37. Lidgren A, Bergh A, Grankvist K, Rasmuson T, Ljungberg B. Glucose transporter-1 expression in renal cell carcinoma and its correlation with hypoxia inducible factor-1 alpha. BJU Int. 2008; 101:480–484.
38. Mayer A, Hockel M, Wree A, Vaupel P. Microregional expression of glucose transporter-1 and oxygenation status: lack of correlation in locally advanced cervical cancers. Clin Cancer Res. 2005; 11:2768–2773.
39. Deng D, Xu C, Sun P, Wu J, Yan C, Hu M, Yan N. Crystal structure of the human glucose transporter GLUT1. Nature. 2014; 510:121–125.
40. Semenza GL. Targeting HIF-1 for cancer therapy. Nat Rev Cancer. 2003; 3:721–732.
41. Chen C, Pore N, Behrooz A, Ismail-Beigi F, Maity A. Regulation of glut1 mRNA by hypoxia-inducible factor-1. Interaction between H-ras and hypoxia. J Biol Chem. 2001; 276:9519–9525.
42. Hiyoshi Y, Watanabe M, Imamura Y, Nagai Y, Baba Y, Yoshida N, Toyama E, Hayashi N, Baba H. The relationship between the glucose transporter type 1 expression and F-fluorodeoxyglucose uptake in esophageal squamous cell carcinoma. Oncology. 2009; 76:286–292.
43. Yun J, Mullarky E, Lu C, Bosch KN, Kavalier A, Rivera K, Roper J, Chio, II, Giannopoulou EG, Rago C, Muley A, Asara JM, et al. Vitamin C selectively kills KRAS, BRAF mutant colorectal cancer cells by targeting GAPDH. Science. 2015; 350:1391–1396.
44. Wood TE, Dalili S, Simpson CD, Hurren R, Mao X, Saiz FS, Gronda M, Eberhard Y, Minden MD, Bilan PJ, Klip A, Batey RA, Schimmer AD. A novel inhibitor of glucose uptake sensitizes cells to FAS-induced cell death. Mol Cancer Ther. 2008; 7:3546–3555.
45. Wardell SE, Ilkayeva OR, Wieman HL, Frigo DE, Rathmell JC, Newgard CB, McDonnell DP. Glucose metabolism as a target of histone deacetylase inhibitors. Mol Endocrinol. 2009; 23:388–401.
46. Liberati A, Altman DG, Tetzlaff J, Mulrow C, Gotzsche PC, Ioannidis JPA, Clarke M, Devereaux PJ, Kleijnen J, Moher D. The PRISMA Statement for Reporting Systematic Reviews and Meta-Analyses of Studies That Evaluate Health Care Interventions: Explanation and Elaboration. PLoS Med. 2009; 6.
47. Stang A. Critical evaluation of the Newcastle-Ottawa scale for the assessment of the quality of nonrandomized studies in meta-analyses. Eur J Epidemiol. 2010; 25:603–605.
48. Deeks JJ HJ, Altman DG. Analysing and presenting results. In: Higgins JPT, Green S, ed. Cochrane Handbook for Systematic Reviews of Interventions 425 Chichester, UK: John Wiley & Sons. 2006.