
INTRODUCTION
Colon adenocarcinoma (COAD) is one of the most frequently diagnosed cancers and a top cause of cancer death globally. Approximately 1.2 million new cases are diagnosed, causing 0.6 million deaths per year all over the world. Cancer metastasis remains the key cause of COAD death [1–6]. The five-year overall survival (OS) rate of patients with primary COAD can be up to 80–90%, but it is reduced to 5–10% in patients with metastatic tumor [7–12]. Rectal adenocarcinoma (READ), which shares similar molecular mechanism with COAD, has a comparable high incidence and poor prognosis [1–4, 6–8, 10]. Therefore, the assessment of prognostic factors is pivotal for the management of unresectable colorectal cancer patients. Several underlying mechanisms have been described in the past decades, including multiple molecular alterations, which confer the tumorigenesis and progression of colorectal cancer [13–18]. However, the exact underlying molecular markers for survival assessment of colorectal cancer remain largely unknown.
Long non-coding RNAs (lncRNAs) are a class of non-protein coding RNAs of more than 200 nucleotides, which are broadly distributed in the genome and can modulate gene expression [19–22]. Recent accumulating evidence has demonstrated that lncRNA expression profiles are frequently changed in tumors compared to that of the adjacent non-tumorous tissues in numerous cancers [23–27]. The altered lncRNA expression profile has been proposed to correlate with the progression and survival in patients with various cancers, including colorectal cancer, which reveals the potential of lncRNAs to act as cancer biomarkers [28–35]. However, most of the previous studies explored a limited number of lncRNAs in a small number of cases [36–39].
Previous studies have verified that a lncRNA expression signature could be obtained from the database of The Cancer Genome Atlas (TCGA), which offers a platform for researchers to download and assess free public datasets [40–45]. Towards this, in the current study, the TCGA database was first applied to gather lncRNA gene expression profiles in COAD. By performing a comprehensive lncRNA expression profile assessment, we identified a lncRNA signature in COAD with four lncRNAs (LINC01555, RP11-610P16.1, RP11-108K3.1, and LINC01207), as a new candidate indicator with the potential to predict the OS in COAD patients. Furthermore, the prognostic value of this four-lncRNA-signature was validated in a READ cohort (Supplementary Figure 1).
RESULTS
Differentially expressed lncRNAs (DELs)
We initially performed differential expression analysis by comparing the expression of 7589 lncRNAs in COAD and normal colon tissue. The edgeR package identified 1430 differentially expressed lncRNAs (DELs, Figure 1A) and the DEseq package identified 584 DELs (Figure 1B). We combined these two groups of DELs together and 578 DELs showed a consistent direction of differential expression across the two methods (Figure 1C, Figure 2). Next, we excluded those cases without sufficient survival data, leaving 224 DELs that were selected for further survival analysis (Supplementary Table 1).
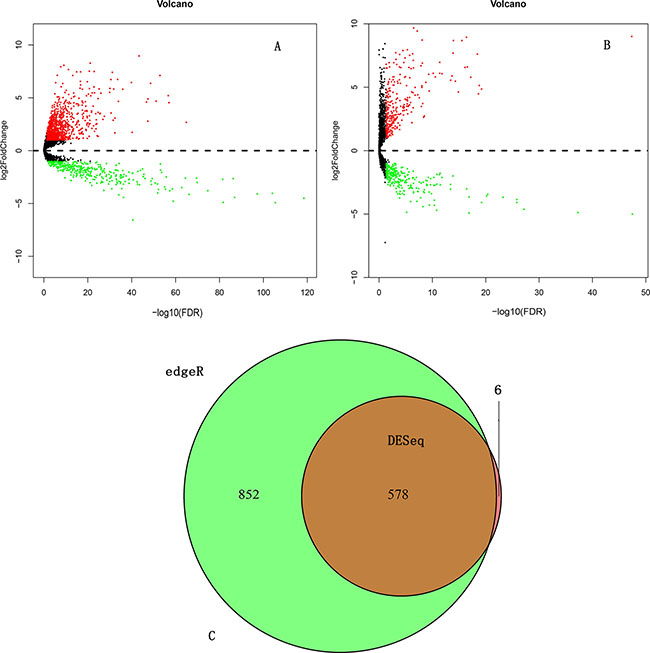
Figure 1: Differentially expressed lncRNAs (DELs) analysis. (A) DELs identified using the edgeR package; (B) DELs identified using the DESeq package; (C) Overlapping DELs.
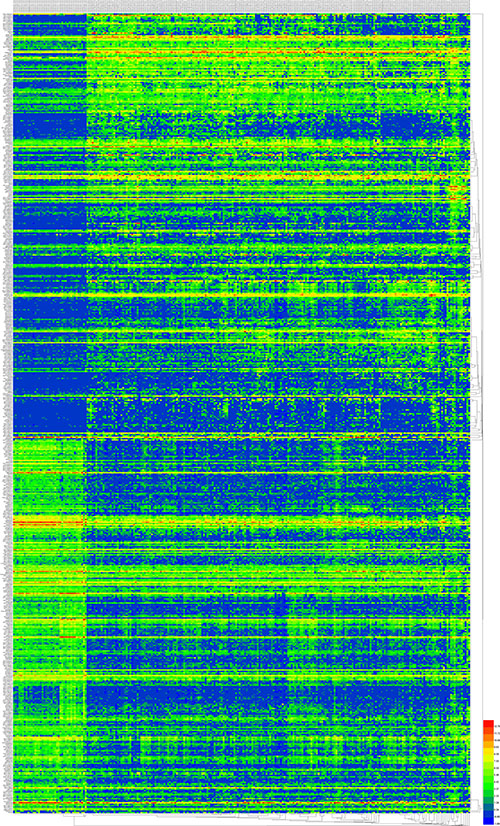
Figure 2: The 578 differentially expressed lncRNAs (DELs) in COAD. A heatmap was drawn to show the DELs.
Construction of the DEL-based prognostic signature
First, a univariate Cox proportional hazards regression showed that a total of 20 among the 224 DELs were identified to maintain a significant prognostic value (Table 1). Second, a multivariate Cox proportional hazards regression analysis indicated that only four DELs exhibited a significant prognostic value for COAD, including LINC01555, RP11-610P16.1, RP11-108K3.1 and LINC01207 (Figure 3). Afterwards, the risk score for predicting the OS was constructed with the formula: Risk score = exp LINC01555*(-0.191) + exp RP11-610P16.1*(-0.338) + exp RP11-108K3.1*(0.318) + exp LINC01207*(-0.163).
Table 1: Prognostic value of the DELs by univariate cox regression analysis
Estimate |
StdErr |
ChiSq |
ProbChiSq* |
HazardRatio |
|
|---|---|---|---|---|---|
AC016831.7 |
–0.209 |
0.065 |
10.521 |
0.001 |
0.811 |
LINC01555 |
–0.177 |
0.056 |
9.985 |
0.002 |
0.838 |
RP11-610P16.1 |
–0.306 |
0.104 |
8.592 |
0.003 |
0.736 |
AC006273.5 |
0.239 |
0.083 |
8.412 |
0.004 |
1.271 |
RP11-108K3.1 |
0.252 |
0.091 |
7.760 |
0.005 |
1.287 |
RP1-193H18.2 |
–0.217 |
0.082 |
7.078 |
0.008 |
0.805 |
LINC00675 |
–0.179 |
0.069 |
6.753 |
0.009 |
0.836 |
CTD-2619J13.17 |
–0.226 |
0.093 |
5.925 |
0.015 |
0.797 |
RP11-449D8.1 |
–0.154 |
0.064 |
5.838 |
0.016 |
0.857 |
AF064858.6 |
–0.154 |
0.064 |
5.791 |
0.016 |
0.857 |
RP11-150O12.3 |
–0.138 |
0.059 |
5.504 |
0.019 |
0.871 |
TP53TG1 |
–0.234 |
0.101 |
5.419 |
0.020 |
0.791 |
LINC00959 |
–0.248 |
0.111 |
4.983 |
0.026 |
0.780 |
SUCLG2-AS1 |
–0.189 |
0.088 |
4.647 |
0.031 |
0.827 |
LINC01315 |
–0.180 |
0.086 |
4.408 |
0.036 |
0.836 |
RP11-474D1.3 |
–0.066 |
0.032 |
4.340 |
0.037 |
0.936 |
MAFTRR |
–0.184 |
0.088 |
4.331 |
0.037 |
0.832 |
KBTBD11-OT1 |
–0.172 |
0.084 |
4.174 |
0.041 |
0.842 |
LINC01207 |
–0.120 |
0.059 |
4.099 |
0.043 |
0.887 |
LINC01132 |
–0.214 |
0.106 |
4.055 |
0.044 |
0.808 |
*ProbChiSq equal P-value.
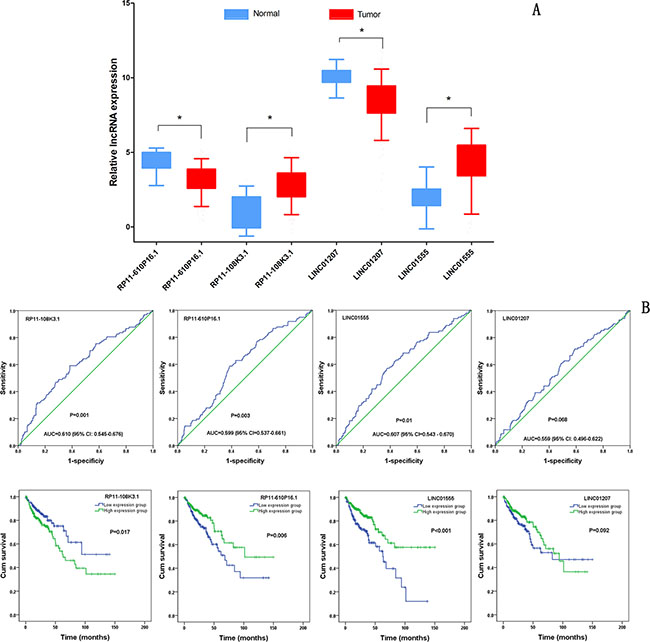
Figure 3: Clinical significance of four differentially expressed lncRNAs (DELs). (A) The expression levels of four DELs in the tumor group compared with that in the normal group; (B) ROC curves of the four DELs to distinguish COAD tissue from normal colon tissue; (C) The Kaplan-Meier curves showing the relationship between the four DELs and the overall survival. The cases were divided into a high and low expression group by the mean DEL level. *P < 0.001.
The COAD patients were divided into two groups of low-risk and high-risk based on the individual inflection point of the prognostic risk score (Figure 4). The risk score could largely predict the 5-year survival of COAD patients, as the area under ROC curve (AUC) was 0.706 (Figure 5A). Furthermore, K-M curves confirmed that the survival time of patients in the high-risk group was 72.935 ± 7.398 months, predominantly shorter than that of the low-risk group (103.402 ± 8.679 months, P < 0.001, Figure 5B).
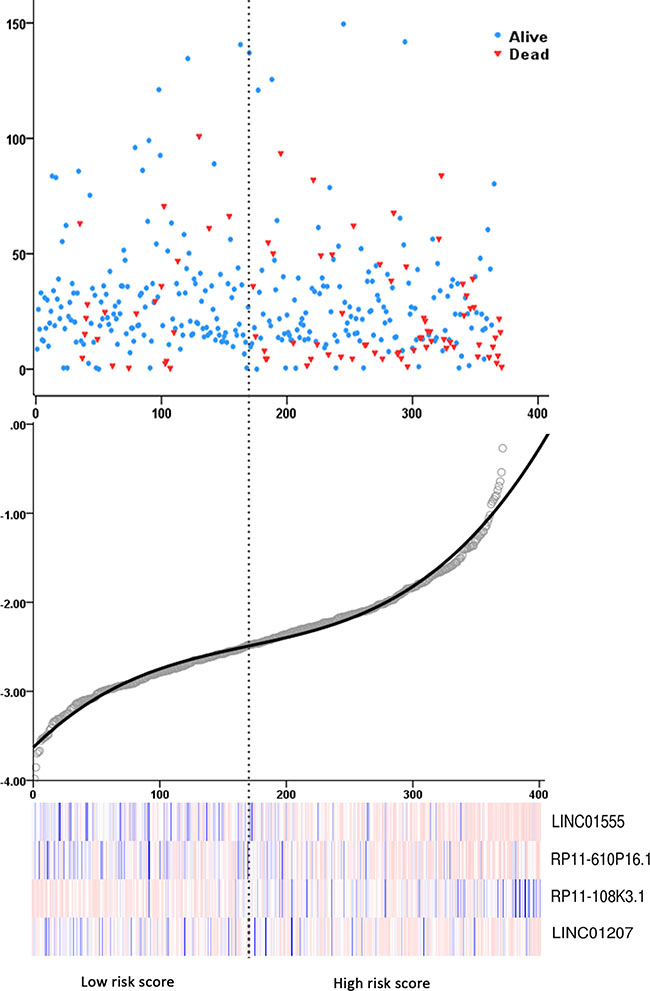
Figure 4: Risk score analysis of the differentially expressed lncRNA (DEL) signature of COAD. (A) Patient survival status and time distributed by risk score; (B) Risk score curve of the four-DEL-signature; (C) Heatmap of four DELs from COAD patients. Color from blue to red indicates the expression level from low to high. The dotted line represents the individual inflection point of the risk score curve, by which the COAD patients were classified in the low-risk or high-risk group.
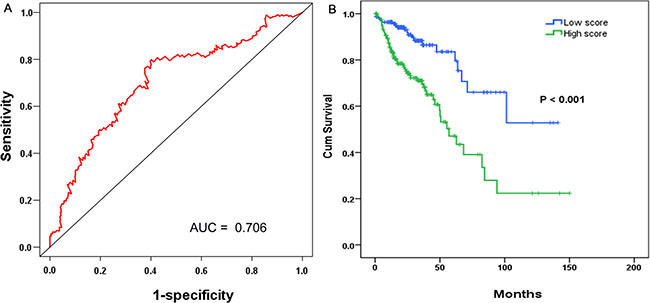
Figure 5: The prognostic performance of the four-differentially expressed lncRNA (DEL) signature of COAD. (A) The prognostic performance of the risk score showed by the time-dependent receiver operating characteristic (ROC) curve for predicting the 5-years survival. (B) The Kaplan-Meier test of the risk score for the overall survival.
Meanwhile, the prognostic value of different clinical parameters was also compared to that of the risk score. The univariate Cox proportional hazards regression showed that a number of parameters could predict poorer survival of COAD (Table 2). However, when analyzed by multivariate Cox proportional hazards regression test, only neoplasm recurrence together with the risk score from the DELs, was independent prognostic indictor of COAD (Table 2). The K-M curves of the above clinical features are shown in Figure 6.
Table 2: The predictive values of related clinical parameters and risk score
Variables |
Patient |
Univariate analysis |
Multivariate analysis |
P |
||
|---|---|---|---|---|---|---|
HR (95% CI) |
P |
HR (95% CI) |
||||
Sex |
Female |
170 |
1 (reference) |
|||
Male |
201 |
1.180 (0.761–1.831) |
0.459 |
|||
Age |
<= 65 years |
162 |
1 (reference) |
|||
> 65 years |
209 |
1.284 (0.816–2.022) |
0.280 |
|||
Disease stage |
I |
67 |
1 (reference) |
1 (reference) |
||
II |
146 |
2.187 (0.759–6.304) |
0.147 |
1.225E4 (0.000–1.976E86) |
0.922 |
|
III |
99 |
3.904 (1.354–11.257) |
0.012 |
8.180E4 (0.000–1.328E87) |
0.907 |
|
IV |
52 |
9.645 (3.351–27.758) |
< 0.001 |
2.394E5 (0.000–3.875E87) |
0.989 |
|
T stage |
T1 |
10 |
1 (reference) |
|||
T2 |
68 |
0.452 (0.087–2.352) |
0.345 |
|||
T3 |
249 |
1.052 (0.256–4.332) |
< 0.944 |
|||
T4 |
44 |
4.078 (0.937–17.747) |
< 0.061 |
|||
N stage |
N0 |
227 |
1 (reference) |
1 (reference) |
||
N1 |
82 |
1.827 (1.059–3.151) |
0.030 |
0.624 (0.096–4.049) |
0.621 |
|
N2-N3 |
61 |
4.348 (2.577–7.337) |
< 0.001 |
0.868 (0.136–5.555) |
0.881 |
|
M stage |
M0 |
269 |
1 (reference) |
|||
M1 |
51 |
4.601 (2.773–7.636) |
< 0.001 |
|||
Lymphatic invasion |
NO |
211 |
1 (reference) |
1 (reference) |
||
YES |
120 |
1.960 (1.219–3.150) |
0.005 |
0.380 (0.121–1.189) |
0.096 |
|
Venous invasion |
NO |
248 |
1 (reference) |
1 (reference) |
||
YES |
74 |
2.490 (1.547–4.006) |
< 0.001 |
1.331 (0.438–4.048) |
0.614 |
|
Treatment outcome |
CR+PR |
123 |
1 (reference) |
|||
SD+PD |
29 |
7.320 (3.491–15.347) |
<0.001 |
|||
Radiotherapy |
NO |
308 |
1 (reference) |
|||
YES |
8 |
0.740 (0.102–5.355) |
0.765 |
|||
Neoplasm recurrence |
NO |
256 |
1 (reference) |
1 (reference) |
||
YES |
60 |
2.990 (1.855–4.819) |
< 0.001 |
3.030 (1.234–7.440) |
0.016 |
|
Residual tumor |
R0 |
263 |
1 (reference) |
1 (reference) |
||
R1+R2 |
20 |
3.953 (1.933–8.082) |
< 0.001 |
1.660 (0.607–4.537) |
0.323 |
|
Dimession |
<=10 mm |
137 |
1 (reference) |
|||
> 10 mm |
124 |
0.944 (0.537–1.659) |
0.840 |
|||
Risk score |
Low |
170 |
1 (reference) |
1 (reference) |
||
High |
201 |
2.948 (1.779 – 4.886) |
< 0.001 |
9.389 (2.737–32.213) |
<0.001 |
HR: hazard ratio; CI: confidence interval; SD: stable disease; PD: progressive disease; CR: complete response; PR: partial response.
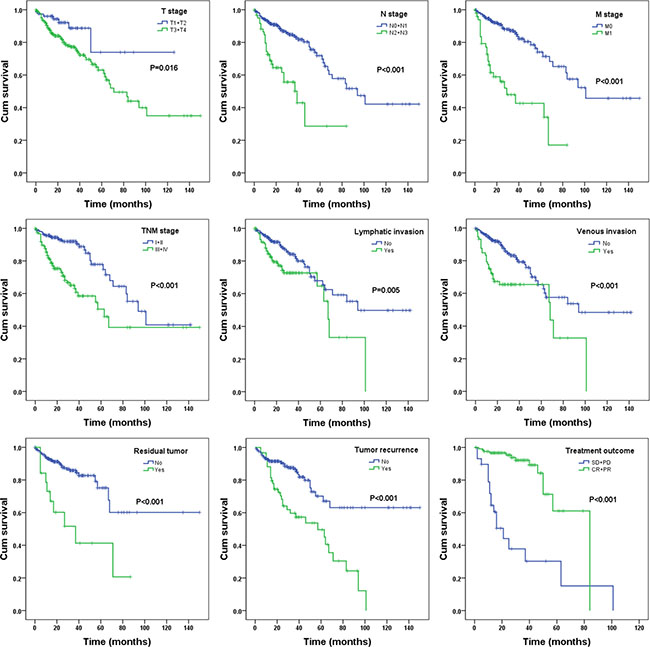
Figure 6: The prognostic value of different parameters for survival of COAD patients. Kaplan-Meier curves of nine independent prognostic indictors, including pathologic tumor stage, pathologic node stage, pathologic metastasis, pathologic stage, lymphatic invasion, venous invasion, residual tumor, tumor recurrence and treatment outcome. CR, complete response; PR, partial response; SD, stable disease; PD, progressive disease.
We also assessed the relationship between the risk score based on the DELs signature and various clinical features, and the risk score showed moderate prognostic value for predicting the status of tumor stage, metastasis and lymphatic invasion (Figure 7). The expression pattern of these four DELs in the low- and high-risk group is also presented in Figure 8.
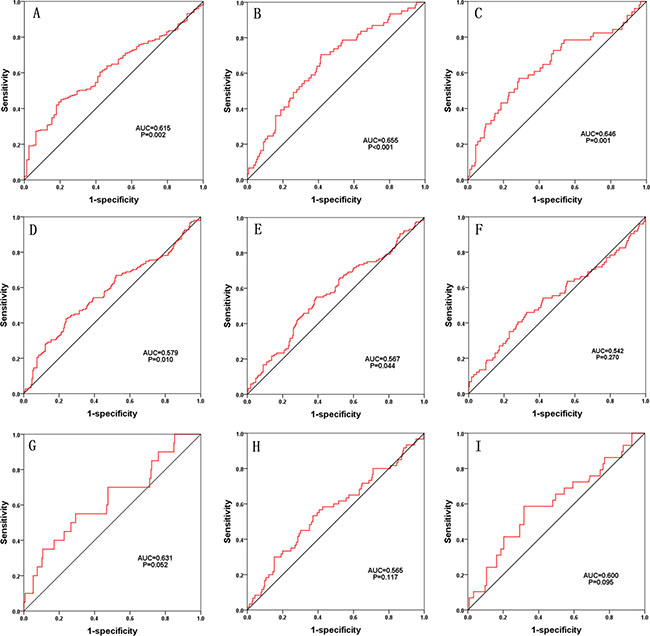
Figure 7: The predictive value of the risk score for the clinical status. characteristic (ROC) curve predicting the different clinical parameters: pathologic tumor stage, pathologic node stage, pathologic metastasis, pathologic stage, lymphatic invasion, venous invasion, residual tumor, tumor recurrence and treatment outcome.
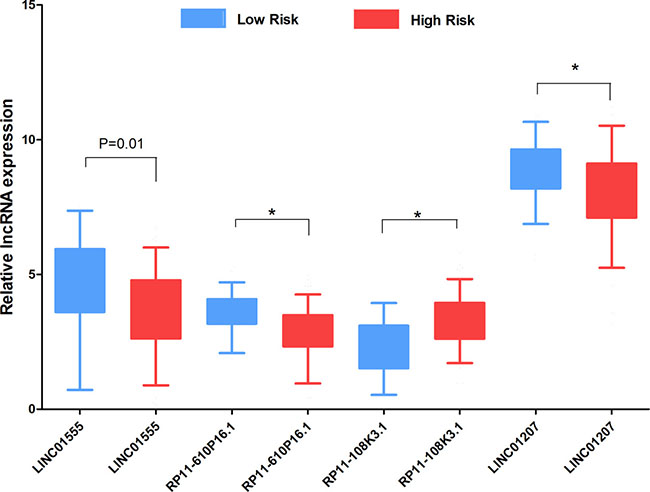
Figure 8: The expression level of the four lncRNAs in the low- and high-risk groups. The difference in the expression level of LINC01555, RP11-610P16.1, RP11-108K3.1 and LINC01207 between the low-risk group and high-risk group. *P < 0.001.
Validation of the four-DEL-signature in READ
For validation, the READ patients were also divided into low-risk and high-risk groups on the basis of the prognostic risk score (Figure 9A). Though the AUC of ROC to predict 5-year survival was slightly less than that in COAD patients (Figure 9B), K-M curves did show a close relationship between the four-DEL-signature and survival (P = 0.014, Figure 9C). Additionally, both univariate (HR: 3.006, 95% CI: 1.192 - 7.586, P = 0.020) and multivariate Cox proportional hazards regression tests (HR: 8.602, 95% CI: 1.159–63.839, P = 0.035) revealed that the risk score of four-DEL-signature was an independent prognostic indictor of READ (Supplementary Table 2).
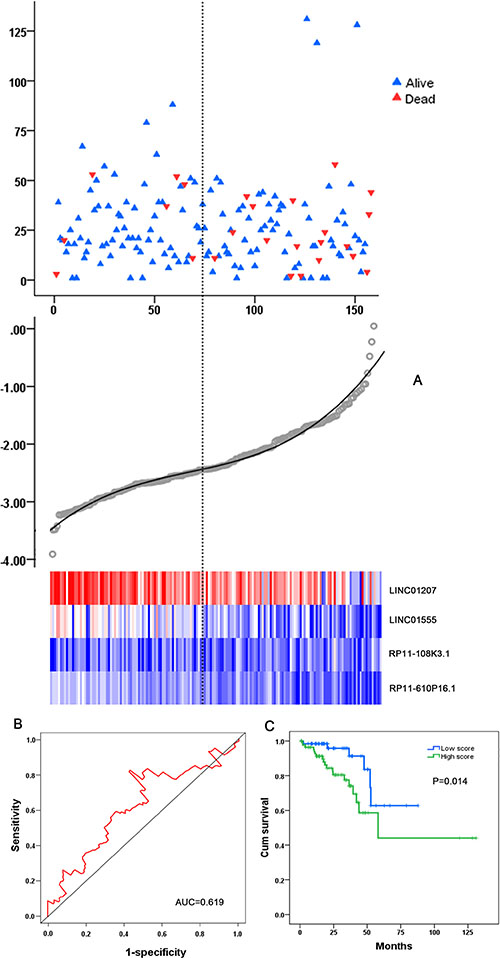
Figure 9: Validation of the four-DEL-signature in READ. (A) READ patients were divided into high- and low-risk groups using the risk score generated from the four-DEL-signature. The relationship between survival and risk score is presented (top); The risk score curve is drawn to classify the READ patients into low- and high- risk groups (middle); The risk scores of the READ patients are shown in a heatmap (bottom). (B) ROC curve for predicting 5-year survival in READ patients by the risk score. (C) Kaplan-Meier curves of the four-lncRNA signature for READ patients.
Functional assessment of the prognostic DELs
Only correlative genes for LINC01555 and LINC01207 could be determined using the Multi-Experiment Matrix (MEM, Figure 10 and Figure 11). Forty genes were collected for LINC01555 and 78 genes for LINC01207. Using kyoto encyclopedia of genes and genomes (KEGG) pathway analysis, the correlative genes of LINC01555 were found to be enriched in the cAMP signaling pathway and the neuroactive ligand-receptor interaction pathways, while genes related to LINC01207 were enriched in mucin type O-Glycan biosynthesis pathway, the - lacto/neolacto-series glycosphingolipid biosynthesis pathway and metabolic pathway. Similarly, some Gene Ontology (GO) terms were also enriched (Table 3, Figure 12). For construction of the protein-protein interaction (PPI) network, there were 3 genes with more than 3 nodes for LINC01207 (GALNT4, GALNT7, MUC13), which were regarded as hub genes. However, we failed to observe similar hub genes for LINC01555.
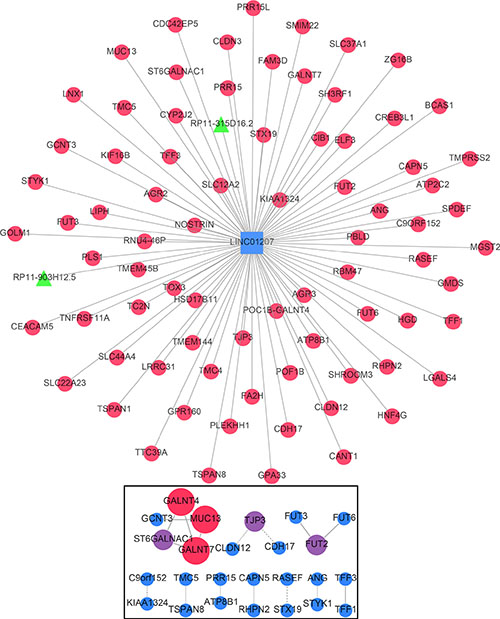
Figure 10: Gene network of the correlative genes of LINC01207. The network of genes co-expressed with LINC01207. LncRNAs are shown as green nodes and mRNAs as red nodes. We measured LINC01207 co-expression using the Multi Experiment Matrix (MEM) software. The Affymetrix GeneChip Human Genome U133 Plus 2.0 platform type was selected for further analysis. The top 100 genes were used to draw the network schematic. The bottom box displays the protein-protein interaction (PPI) network of related genes.
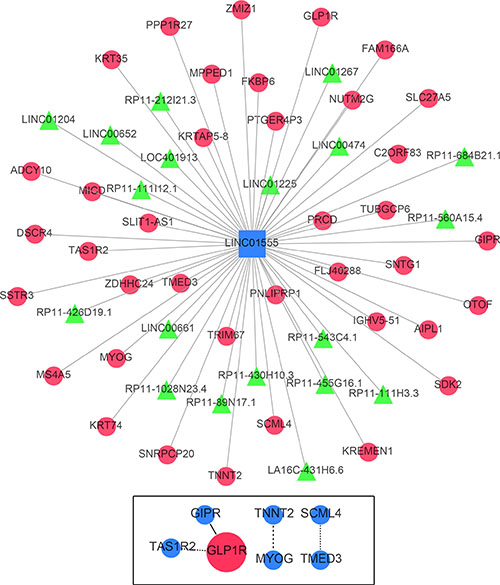
Figure 11: Gene network of the correlative genes of LINC01555. The network of genes co-expressed with LINC01555. LncRNAs are shown as green nodes and mRNAs are shown as red nodes. We detected the co-expression of LINC01555 using Multi Experiment Matrix (MEM) software. The Affymetrix GeneChip Human Genome U133 Plus 2.0 platform type was applied for further examination. The top 100 genes were used to draw the network schematic. The bottom box displays the protein-protein interaction (PPI) network of related genes.
Table 3: GO terms and pathway analyses with the correlative genes of LINC01555 and LINC01207
Category |
Term |
P value |
Genes |
|---|---|---|---|
LINC01555 |
|||
KEGG pathway |
cAMP signaling pathway |
0.016 |
GIPR, ADCY10, GLP1R |
Neuroactive ligand-receptor interaction |
0.029 |
SSTR3, GIPR, GLP1R |
|
Biological process |
Meiotic nuclear division |
0.034 |
TUBGCP6, FKBP6 |
Regulation of heart contraction |
0.043 |
TNNT2, GLP1R |
|
Cellular response to estradiol stimulus |
0.049 |
SSTR3, MYOG |
|
Cellular component |
Basal part of cell |
0.021 |
OTOF, ADCY10 |
Molecular function |
Structural molecule activity |
0.047 |
KRT74, SNTG1, KRT35 |
LINC01207 |
|||
KEGG pathway |
Mucin type O-Glycan biosynthesis |
< 0.001 |
GCNT3, GALNT7, POC1B-GALNT4, ST6GALNAC1 |
Glycosphingolipid biosynthesis - lacto and neolacto series |
0.003 |
FUT6, FUT3, FUT2 |
|
Metabolic pathways |
0.007 |
GCNT3, CYP2J2, GALNT7, GMDS, POC1B-GALNT4, FUT6, FUT3, HGD, FUT2, ST6GALNAC1 |
|
Biological process |
Protein glycosylation |
< 0.001 |
GALNT7, POC1B-GALNT4, FUT6, FUT3, FUT2, ST6GALNAC1 |
L-fucose catabolic process |
0.001 |
FUT6, FUT3, FUT2 |
|
Fucosylation |
0.001 |
FUT6, FUT3, FUT2 |
|
Maintenance of gastrointestinal epithelium |
0.001 |
TFF1, MUC13, PBLD |
|
O-glycan processing |
0.002 |
GCNT3, GALNT7, POC1B-GALNT4, MUC13 |
|
Carbohydrate metabolic process |
0.005 |
GCNT3, GALNT7, POC1B-GALNT4, TFF1, FUT2 |
|
Positive regulation of establishment of protein localization to plasma membrane |
0.006 |
PLS1, AGR2, CIB1 |
|
Lung goblet cell differentiation |
0.012 |
SPDEF, AGR2 |
|
Oligosaccharide biosynthetic process |
0.042 |
FUT3, ST6GALNAC1 |
|
Cellular component |
Extracellular exosome |
< 0.001 |
GCNT3, TSPAN1, CYP2J2, GALNT7, CLDN3, SLC44A4, POC1B-GALNT4, FUT6, KIAA1324, TSPAN8, PBLD, CANT1, ZG16B, ANG, PLS1, FUT3, TFF3, CEACAM5, FUT2, MUC13, GOLM1, CIB1, BCAS1, TMPRSS2, CAPN5, SLC12A2, GMDS, TMC5, TMC4, HGD, GPA33 |
Golgi cisterna membrane |
0.003 |
FUT6, FUT3, FUT2, CANT1 |
|
Golgi apparatus |
0.006 |
SH3RF1, POC1B-GALNT4, FUT6, KIAA1324, ATP8B1, FUT3, FUT2, GOLM1, ST6GALNAC1, CIB1 |
|
Integral component of plasma membrane |
0.008 |
TMPRSS2, ATP2C2, TNFRSF11A, TSPAN1, SLC12A2, CLDN3, SLC22A23, KIAA1324, ATP8B1, GPA33, TSPAN8, CEACAM5, GOLM1 |
|
Integral component of membrane |
0.009 |
GCNT3, GPR160, FAM3D, GALNT7, CLDN3, SLC44A4, POC1B-GALNT4, FUT6, KIAA1324, CLDN12, CANT1, TMEM144, STX19, ATP8B1, FUT3, CREB3L1, FUT2, MUC13, TMPRSS2, TMEM45B, SLC12A2, FA2H, TMC5, SLC22A23, TMC4, ST6GALNAC1, STYK1, ATP2C2, CDH17, SMIM22, MGST2 |
|
Bicellular tight junction |
0.010 |
CLDN3, POF1B, CLDN12, TJP3 |
|
Golgi membrane |
0.028 |
ATP2C2, GCNT3, GALNT7, POC1B-GALNT4, FUT6, FUT3, ST6GALNAC1 |
|
Apical plasma membrane |
0.030 |
SHROOM3, SLC12A2, ATP8B1, MUC13, CIB1 |
|
Perinuclear region of cytoplasm |
0.040 |
SH3RF1, ATP2C2, TSPAN1, RASEF, POC1B-GALNT4, RHPN2, CIB1 |
|
Organelle membrane |
0.044 |
CYP2J2, FA2H, MGST2 |
|
Molecular function |
Fucosyltransferase activity |
< 0.001 |
FUT6, FUT3, FUT2 |
3-galactosyl-N-acetylglucosaminide |
0.011 |
FUT6, FUT3 |
|
Alpha-(1->3)-fucosyltransferase activity |
0.030 |
FUT6, FUT3 |
|
Dystroglycan binding |
0.034 |
AGR3, AGR2 |
|
carbohydrate binding |
0.040 |
ZG16B, GALNT7, LGALS4, POC1B-GALNT4 |
|
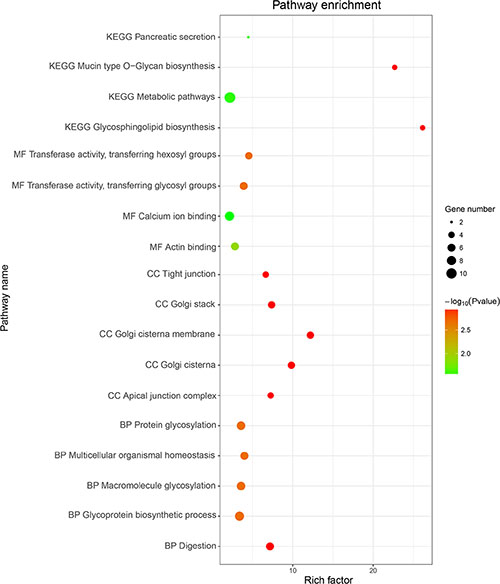
Figure 12: GO and KEGG term analysis of potential genes related to LINC01555 and LINC01207. The Rich factor shows the degree of enrichment, which was calculated by the formula: (the number of selected genes in a term/total number of selected genes)/(the total number of genes in a term of the database/ the total number of genes in the database). The Node size represents the number of selected genes, and color represents the p-value of the enrichment analysis. CC, cellular component; MF, molecular function; BP, biological process.
DISCUSSION
In the current study, to define lncRNAs significantly related to OS, a univariate Cox proportional hazards regression with the significance level set at 0.05 was first performed on 7589 lncRNAs from 371 COAD patients according to the defined criterion in a large number of COAD patients based on the data downloaded from the TCGA database. A total of four lncRNAs were identified. We then developed a risk score by combining the four lncRNAs and found that this four-lncRNA signature could independently predict OS in COAD patients, which was further validated in READ patients. As far as we know, this is the first study to construct a risk score by mining TCGA data for the survival assessment of colorectal cancer patients.
Colorectal cancer is one of the deadliest solid malignancies, and the involvement of noncoding RNAs in the development, diagnosis, and prognosis of colorectal cancer has been widely investigated [33–35]. In addition to the aggressive properties of colorectal cancer, the lack of specific biomarkers for its diagnosis, therapeutic effect monitoring and prognosis might also be responsible for the low survival rate. Hence, there is a critical need for reliable prognostic factors pinpointing a poor outcome. Recent large-scale genomic analyses have made it possible to reveal a catalogue of molecular characteristics associated with colorectal cancer outcome [44, 46–53]. However, most of the existing studies have focused on mRNA and microRNA expression [54–56]. Knowledge is now rapidly emerging on the functional roles of lncRNAs in cancer initiation and progression, representing a significant untapped molecular resource for cancer prognosis as well.
The relationship between aberrant lncRNAs and survival of colorectal cancer has been studied in small samples using distinct approaches. Li et al. [57] analyzed the prognostic value of 21 lncRNAs by PCR array in 30 colorectal cancer patients and reported that higher levels of AFAP1-AS1, BCAR4, H19, HOXA-AS2, MALAT1 or PVT1 and a lower level of ADAMTS9-AS2 could predict a poor prognosis of colorectal cancer patients. Similarly, Wang et al. [58] studied lncRNA expression profiling using microarray in six cases of colorectal cancer patients. Multivariate Cox analysis revealed that lncRNA NR_029373 and NR_034119 were both independently related to the disease-specific survival rate. Furthermore, Sun et al. [25] searched in GEO datasets and achieved five studies: GSE8671, GSE22598, GSE23878, GSE9348, and GSE37364, that studied lncRNAs in 150 cases of colorectal cancer patients. They found that one lncRNA, AK098081 could be considered an independent risk factor for colorectal cancer patients (HR = 1.896, 95% CI = 1.393–2.579, P < 0.001). Surprisingly, no consistent lncRNA has been verified by different groups, potentially due, at least in part, to the limited sample size and differing detection methods. Compared with previous studies, our study uses data from the TCGA database with high-throughput analysis of lncRNAs from a larger sample size. Herein, we report that expression of four novel lncRNAs (LINC01555, RP11-610P16.1, RP11-108K3.1 and LINC01207) could also become a new independent risk factor for colorectal cancer patients. Moreover, the risk score constructed from these four lncRNAs could be an indicator for the colorectal cancer patients in the clinical setting.
No study as of yet has investigated the function of the aforementioned four lncRNAs. Here, we performed MEM to gather the correlative genes of these four lncRNAs. However, the correlative genes were only found for LINC01555 and LINC01207 in this step. Interestingly, the correlative genes of LINC01555 were enriched in cAMP signaling pathway and neuroactive ligand-receptor interaction pathway, whereas the genes correlative to LINC01207 were enriched in mucin type O-Glycan biosynthesis pathway, – the lacto/neolacto-series glycosphingolipid biosynthesis pathway and metabolic pathway, which are all classical signaling pathways closely related to the tumorigenesis and progression of malignancies. For instance, intracellular cAMP has been proposed to impact the biological behavior, namely to suppress the growth of colorectal cancer cells [59, 60]. Most likely, LINC01555 could play substantial roles in the tumorigenesis and development of colorectal cancer via influencing cAMP signaling pathway. Therefore, the functional enrichment analysis may offer a clue for elucidating the role of LINC01555 and LINC01207 in carcinogenesis of colorectal cancer and the specific underlying molecular mechanisms. However, since the research on the clinical and biological function of LINC01555, RP11-610P16.1, RP11-108K3.1, and LINC01207 is still nonexistent in colorectal cancer patients, there is a lot of research that needs to be accomplished.
The findings of the current study may have substantial clinical significance or implications; however, some limitations should be considered. First, the mean time of follow-up was 29.375 months for COAD and 26.965 months for READ patients, and a study including a longer follow-up time is warranted to validate our findings in the future. Second, the data from TCGA were based on the RNA-seq technique; other experimental methods are needed to verify the current finding. Third, the roles of LINC01555, RP11-610P16.1, RP11-108K3.1, and LINC01207 in colorectal cancer are unknown; in vitro and in vivo experiments are expected to answer this question.
In conclusion, by analyzing the genome-wide lncRNA expression profiles in a large cohort from TCGA, we identified a four-lncRNA signature, which could act as an indicator for patient outcome and could be a potential independent biomarker for prognosis prediction of colorectal cancer. We will gather clinical samples and validated these findings experimentally in our future work.
MATERIALS AND METHODS
Differentially expressed lncRNAs
RNA sequencing (RNA-Seq) data from 521 individuals with COAD were obtained from TCGA data portal (https://tcga-data.nci.nih.gov/docs/publications/tcga/?), including data from 480 COAD tissue samples and 41 non-tumorous adjacent-normal colon tissue samples up to November 9, 2016. Since the data were provided by TCGA, additional approval by an ethics committee was not needed. Data processing was performed in line with the TCGA human subject protection and data access policies. This dataset consisted of called gene counts for 60,244 mRNAs, which were assessed on the IlluminaHiSeq RNA-Seq platform. In the current paper, only lncRNAs with description from NCBI or Ensemble were selected for further study. Finally, we obtained the expression profiles of 7581 lncRNAs. We then filtered the differentially expressed lncRNAs (DELs) using two individual R packages: edgeR [61, 62] and DEseq [63, 64], with Padj < 0.05 and logFC > 1 of expression level between comparison of tumor and adjacent normal colon tissue. Since a strategy that combines edgeR and DESeq is proposed for large sample sizes from TCGA [65], here in the current study, this combination of edgeR and DESeq was adopted. The overlapping DELs obtained using both edgeR and DEseq were sent for further survival analysis. For validation, the relevant data including lncRNA levels and clinicopathological parameters were also downloaded for 158 READ tissues and 10 non-tumorous controls.
Construction of the DEL-based prognostic signature and statistical analysis
The DELs that were 0 in greater than 10% of all subjects were eliminated. The expression level of each DEL was log2-transformed for further analysis. Meanwhile, clinicopathological parameters and survival data were also downloaded from TCGA. The subjects without clinical data were excluded, which resulted in a 371-sample cohort with 224 DELs enrolled in the survival analysis (Supplementary Table 1). The end-point in our study was OS. The average follow-up time was 29.375 months in this COAD cohort and 26.965 months in READ cases.
The univariate Cox proportional hazards regression with a significance level set at 0.05 was performed to obtain the DELs that are closely correlated with the OS. A total of four DELs were identified. The multivariate cox regression model was further performed to test the prognostic value of the DELs. A prognosis risk score for predicting OS was established on the basis of a linear combination of the expression level multiplied by the regression coefficient derived from the multivariate cox regression model (β) with the following formula as previously reported:
Risk score = expDEL1*βDEL1 + expDEL2*βDEL2 + … expDELn*βDELn.
COAD and READ patients were divided into two groups: high-score and low-score, with the cut-off of the individual inflection point of the prognostic risk score [66]. Univariate Cox proportional hazards regression analyses were further conducted to investigate the effects of various clinical characteristics and the risk score on the OS of COAD and READ patients. Each predictor identified via the univariate analysis was further evaluated by a multivariate Cox proportional hazards regression analysis to determine whether the lncRNA prognostic model was independent of other clinical variables, adjusting for age, tumor stage, grade, surgical debulking status, and risk scores. Hazard ratio (HR) and 95% confidence intervals (CIs) were assessed. The time-dependent receiver operating characteristic (ROC) curve analysis within 5 years as the defining point was also performed using the R package “survivalROC”, to evaluate the predictive accuracy of the prognostic model for time-dependent disease outcomes [67]. Kaplan-Meier survival curves were used to estimate the OS time for COAD and READ patients with predicted high- or low-risk scores, and the survival differences between the high-risk group and low-risk group were assessed by a two-sided log-rank test using SPSS 22.0 software (SPSS Inc., Chicago, IL, USA) [68].
The relationship between the DEL signature and clinical features were examined using a Chi-square test. An ROC curve was drawn to assess the predictive significance of the risk score for the patient outcome after the first course of treatment. If a two-sided P-value was less than 0.05, statistical significance was determined. The statistical analyses were conducted with SPSS22.0 software (SPSS Inc., Chicago, IL, USA).
Functional assessment of prognostic DELs
The correlative genes of the DELs were collected using the Multi-Experiment Matrix (MEM) (http://biit.cs.ut.ee/mem/index.cgi) [69]. Given a gene as an input, the MEM ranks other genes by similarity in each separable data set. In essence, this analysis is a new rank aggregation method that takes the individual rankings and determines a score of significance, and then, a ranking across all datasets at the same time. Functional enrichment analysis at the GO and KEGG pathway levels and PPI assessments were employed to infer the lncRNA function with the DAVID Bioinformatics Tool (https://david.ncifcrf.gov/, version 6.7) and STRING database. The enriched GO terms and the KEGG pathways with p-value < 0.05 were regarded as potential function of the prognostic lncRNAs. The DELs and the correlative genes were visualized as a network using Cytoscape. A selection of protein pairs from the PPI assessment with an association score greater than 0.4 and a number of nodes beyond 3 were the final products of the correlative genes.
Abbreviations
lncRNAs, long non-coding RNAs; COAD, colon adenocarcinoma; READ, rectal adenocarcinoma; OS, overall survival; TCGA, The Cancer Genome Atlas; DELs, differentially expressions lncRNAs; MEM, Multi-Experiment Matrix; RNA-Seq, RNA sequencing; HR, hazard ratio; ROC, receiver operating characteristic; GO, Gene ontology; KEGG, Kyoto encyclopedia of genes and genomes; PPI, protein-protein interaction; SDV, standard deviation; CR, complete response; PR, partial response; SD, stable disease; PD, progressive disease; AUC, area under the curve; CI, confidence interval
ACKNOWLEDGMENTS AND FUNDING
The authors thank TCGA for providing the data. The study is funded by the National Natural Science Foundation of China (NSFC 81560448).
CONFLICTS OF INTEREST
The authors declare no competing financial interests.
REFERENCES
1. Heinemann V, von Weikersthal LF, Decker T, Kiani A, Vehling-Kaiser U, Al-Batran SE, Heintges T, Lerchenmuller C, Kahl C, Seipelt G, Kullmann F, Stauch M, Scheithauer W, et al. FOLFIRI plus cetuximab versus FOLFIRI plus bevacizumab as first-line treatment for patients with metastatic colorectal cancer (FIRE-3): a randomised, open-label, phase 3 trial. The Lancet Oncology. 2014; 15:1065–1075.
2. Edwards BK, Noone AM, Mariotto AB, Simard EP, Boscoe FP, Henley SJ, Jemal A, Cho H, Anderson RN, Kohler BA, Eheman CR, Ward EM. Annual Report to the Nation on the status of cancer, 1975–2010, featuring prevalence of comorbidity and impact on survival among persons with lung, colorectal, breast, or prostate cancer. Cancer. 2014; 120:1290–1314.
3. Garborg K. Colorectal Cancer Screening. Surg Clin North Am. 2015; 95:979–989.
4. Brenner H, Stock C, Hoffmeister M. Colorectal cancer screening: the time to act is now. BMC medicine. 2015; 13:262.
5. El Zoghbi M, Cummings LC. New era of colorectal cancer screening. World J Gastrointest Endosc. 2016; 8:252–258.
6. Williams CD, Grady WM, Zullig LL. Use of NCCN Guidelines, Other Guidelines, and Biomarkers for Colorectal Cancer Screening. J Natl Compr Canc Netw. 2016; 14:1479–1485.
7. Shibutani M, Maeda K, Nagahara H, Noda E, Ohtani H, Nishiguchi Y, Hirakawa K. Prognostic significance of the preoperative serum C-reactive protein level in patients with stage IV colorectal cancer. Surgery today. 2015; 45:315–321.
8. Park JS, Huh JW, Park YA, Cho YB, Yun SH, Kim HC, Lee WY, Chun HK. Prognostic comparison between mucinous and nonmucinous adenocarcinoma in colorectal cancer. Medicine. 2015; 94:e658.
9. Chen L, Zhang C, Gui Q, Chen Y, Yang Y. Ultraperformance liquid chromatography coupled with quadrupole timeofflight mass spectrometrybased metabolic profiling of human serum prior to and following radical resection of colorectal carcinoma. Molecular medicine reports. 2015; 12:6879–6886.
10. Park EJ, Baik SH, Kang J, Hur H, Min BS, Lee KY, Kim NK. The Impact of Postoperative Complications on Long-term Oncologic Outcomes After Laparoscopic Low Anterior Resection for Rectal Cancer. Medicine. 2016; 95:e3271.
11. Corvaisier M, Bauzone M, Corfiotti F, Renaud F, El Amrani M, Monte D, Truant S, Leteurtre E, Formstecher P, Van Seuningen I, Gespach C, Huet G. Regulation of cellular quiescence by YAP/TAZ and Cyclin E1 in colon cancer cells: Implication in chemoresistance and cancer relapse. Oncotarget. 2016; 7:56699–56712. doi: 10.18632/oncotarget.11057.
12. Pita-Fernandez S, Gonzalez-Saez L, Lopez-Calvino B, Seoane-Pillado T, Rodriguez-Camacho E, Pazos-Sierra A, Gonzalez-Santamaria P, Pertega-Diaz S. Effect of diagnostic delay on survival in patients with colorectal cancer: a retrospective cohort study. BMC cancer. 2016; 16:664.
13. Arora H, Qureshi R, Rizvi MA, Shrivastava S, Parihar MS. Study of apoptosis-related interactions in colorectal cancer. Tumour Biol. 2016; 37:14415–14425.
14. Gao D, Herman JG, Guo M. The clinical value of aberrant epigenetic changes of DNA damage repair genes in human cancer. Oncotarget. 2016; 7:37331–37346. doi: 10.18632/oncotarget.7949.
15. Gulbake A, Jain A, Jain A, Jain A, Jain SK. Insight to drug delivery aspects for colorectal cancer. World J Gastroenterol. 2016; 22:582–599.
16. Panagi M, Georgila K, Eliopoulos AG, Apidianakis Y. Constructing personalized longitudinal holo’omes of colon cancer-prone humans and their modeling in flies and mice. Oncotarget. 2015 Dec 4. doi: 10.18632/oncotarget.6463. [Epub ahead of print].
17. Nagaraju GP, Madanraj AS, Aliya S, Rajitha B, Alese OB, Kariali E, Alam A, El-Rayes BF. MicroRNAs as biomarkers and prospective therapeutic targets in colon and pancreatic cancers. Tumour Biol. 2016; 37:97–104.
18. Wang J, Du Y, Liu X, Cho WC, Yang Y. MicroRNAs as Regulator of Signaling Networks in Metastatic Colon Cancer. Biomed Res Int. 2015; 2015:823620.
19. Cao D, Ding Q, Yu W, Gao M, Wang Y. Long noncoding RNA SPRY4-IT1 promotes malignant development of colorectal cancer by targeting epithelial-mesenchymal transition. Onco Targets Ther. 2016; 9:5417–5425.
20. Guo XB, Hua Z, Li C, Peng LP, Wang JS, Wang B, Zhi QM. Biological significance of long non-coding RNA FTX expression in human colorectal cancer. Int J Clin Exp Med. 2015; 8:15591–15600.
21. Yang XD, Xu HT, Xu XH, Ru G, Liu W, Zhu JJ, Wu YY, Zhao K, Wu Y, Xing CG, Zhang SY, Cao JP, Li M. Knockdown of long non-coding RNA HOTAIR inhibits proliferation and invasiveness and improves radiosensitivity in colorectal cancer. Oncology reports. 2016; 35:479–487.
22. Shan TD, Xu JH, Yu T, Li JY, Zhao LN, Ouyang H, Luo S, Lu XJ, Huang CZ, Lan QS, Zhong W, Chen QK. Knockdown of linc-POU3F3 suppresses the proliferation, apoptosis, and migration resistance of colorectal cancer. Oncotarget. 2016; 7:961–975. doi: 10.18632/oncotarget.5830.
23. Ye LC, Chen T, Zhu DX, Lv SX, Qiu JJ, Xu J, Yuan FL, Wei Y. Downregulated long non-coding RNA CLMAT3 promotes the proliferation of colorectal cancer cells by targeting regulators of the cell cycle pathway. Oncotarget. 2016; 7:58931–58938. doi: 10.18632/oncotarget.10431.
24. Zhao W, Song M, Zhang J, Kuerban M, Wang H. Combined identification of long non-coding RNA CCAT1 and HOTAIR in serum as an effective screening for colorectal carcinoma. Int J Clin Exp Pathol. 2015; 8:14131–14140.
25. Sun X, Hu Y, Zhang L, Hu C, Guo G, Mao C, Xu J, Ye S, Huang G, Xue X, Guo A, Shen X. Mining, Validation, and Clinical Significance of Colorectal Cancer (CRC)-Associated lncRNAs. PloS one. 2016; 11:e0164590.
26. Huang G, Zhu H, Shi Y, Wu W, Cai H, Chen X. cir-ITCH plays an inhibitory role in colorectal cancer by regulating the Wnt/beta-catenin pathway. PloS one. 2015; 10:e0131225.
27. Shi Y, Liu Y, Wang J, Jie D, Yun T, Li W, Yan L, Wang K, Feng J. Downregulated Long Noncoding RNA BANCR Promotes the Proliferation of Colorectal Cancer Cells via Downregualtion of p21 Expression. PloS one. 2015; 10:e0122679.
28. Liu T, Zhang X, Yang YM, Du LT, Wang CX. Increased expression of the long noncoding RNA CRNDE-h indicates a poor prognosis in colorectal cancer, and is positively correlated with IRX5 mRNA expression. Onco Targets Ther. 2016; 9:1437–1448.
29. Han D, Gao X, Wang M, Qiao Y, Xu Y, Yang J, Dong N, He J, Sun Q, Lv G, Xu C, Tao J, Ma N. Long noncoding RNA H19 indicates a poor prognosis of colorectal cancer and promotes tumor growth by recruiting and binding to eIF4A3. Oncotarget. 2016; 7:22159–22173. doi: 10.18632/oncotarget.8063.
30. Liu Y, Zhang M, Liang L, Li J, Chen YX. Over-expression of lncRNA DANCR is associated with advanced tumor progression and poor prognosis in patients with colorectal cancer. Int J Clin Exp Pathol. 2015; 8:11480–11484.
31. Qiu JJ, Yan JB. Long non-coding RNA LINC01296 is a potential prognostic biomarker in patients with colorectal cancer. Tumour Biol. 2015; 36:7175–7183.
32. Yin DD, Liu ZJ, Zhang E, Kong R, Zhang ZH, Guo RH. Decreased expression of long noncoding RNA MEG3 affects cell proliferation and predicts a poor prognosis in patients with colorectal cancer. Tumour Biol. 2015; 36:4851–4859.
33. Weng M, Wu D, Yang C, Peng H, Wang G, Wang T, Li X. Noncoding RNAs in the development, diagnosis, and prognosis of colorectal cancer. Transl Res. 2016.
34. Kita Y, Yonemori K, Osako Y, Baba K, Mori S, Maemura K, Natsugoe S. Noncoding RNA and colorectal cancer: its epigenetic role. J Hum Genet. 2017; 62:41–47.
35. Xie X, Tang B, Xiao YF, Xie R, Li BS, Dong H, Zhou JY, Yang SM. Long non-coding RNAs in colorectal cancer. Oncotarget. 2016; 7:5226–5239. doi: 10.18632/oncotarget.6446.
36. Li C, Zhou L, He J, Fang XQ, Zhu SW, Xiong MM. Increased long noncoding RNA SNHG20 predicts poor prognosis in colorectal cancer. BMC cancer. 2016; 16:655.
37. Sun Y, Zheng ZP, Li H, Zhang HQ, Ma FQ. ANRIL is associated with the survival rate of patients with colorectal cancer, and affects cell migration and invasion in vitro. Mol Med Rep. 2016; 14:1714–1720.
38. Ren YK, Xiao Y, Wan XB, Zhao YZ, Li J, Li Y, Han GS, Chen XB, Zou QY, Wang GC, Lu CM, Xu YC, Wang YC. Association of long non-coding RNA HOTTIP with progression and prognosis in colorectal cancer. Int J Clin Exp Pathol. 2015; 8:11458–11463.
39. Li Y, Li Y, Chen W, He F, Tan Z, Zheng J, Wang W, Zhao Q, Li J. NEAT expression is associated with tumor recurrence and unfavorable prognosis in colorectal cancer. Oncotarget. 2015; 6:27641–27650. doi: 10.18632/oncotarget.4737.
40. He ZC, Ping YF, Xu SL, Lin Y, Yu SC, Kung HF, Bian XW. Lower MGMT expression predicts better prognosis in proneural-like glioblastoma. Int J Clin Exp Med. 2015; 8:20287–20294.
41. Bou Zgheib N, Marchion DC, Bush SH, Judson PL, Wenham RM, Apte SM, Lancaster JM, Gonzalez-Bosquet J. Molecular determinants for lymph node metastasis in clinically early-stage endometrial cancer. Oncology letters. 2016; 11:323–329.
42. Wang M, Wen TF, He LH, Li C, Zhu WJ, Trishul NM. A six-microRNA set as prognostic indicators for bile duct cancer. Int J Clin Exp Med. 2015; 8:17261–17270.
43. Chen C, Zhao KN, Masci PP, Lakhani SR, Antonsson A, Simpson PT, Vitetta L. TGFbeta isoforms and receptors mRNA expression in breast tumours: prognostic value and clinical implications. BMC cancer. 2015; 15:1010.
44. An N, Yang X, Cheng S, Wang G, Zhang K. Developmental genes significantly afflicted by aberrant promoter methylation and somatic mutation predict overall survival of late-stage colorectal cancer. Scientific reports. 2015; 5:18616.
45. Myers JS, von Lersner AK, Robbins CJ, Sang QX. Differentially Expressed Genes and Signature Pathways of Human Prostate Cancer. PloS one. 2015; 10:e0145322.
46. Cui R, Shi XY. Expression of pyruvate kinase M2 in human colorectal cancer and its prognostic value. Int J Clin Exp Pathol. 2015; 8:11393–11399.
47. Hechtman JF, Zehir A, Yaeger R, Wang L, Middha S, Zheng T, Hyman DM, Solit D, Arcila ME, Borsu L, Shia J, Vakiani E, Saltz L, et al. Identification of Targetable Kinase Alterations in Patients with Colorectal Carcinoma That are Preferentially Associated with Wild-Type RAS/RAF. Mol Cancer Res. 2016; 14:296–301.
48. Bao L, Messer K, Schwab R, Harismendy O, Pu M, Crain B, Yost S, Frazer KA, Rana B, Hasteh F, Wallace A, Parker BA. Mutational Profiling Can Establish Clonal or Independent Origin in Synchronous Bilateral Breast and Other Tumors. PloS one. 2015; 10:e0142487.
49. Guinney J, Dienstmann R, Wang X, de Reynies A, Schlicker A, Soneson C, Marisa L, Roepman P, Nyamundanda G, Angelino P, Bot BM, Morris JS, Simon IM, et al. The consensus molecular subtypes of colorectal cancer. Nature medicine. 2015; 21:1350–1356.
50. Ke J, Lou J, Chen X, Li J, Liu C, Gong Y, Yang Y, Zhu Y, Zhang Y, Gong J. Identification of a Potential Regulatory Variant for Colorectal Cancer Risk Mapping to Chromosome 5q31.1: A Post-GWAS Study. PloS one. 2015; 10:e0138478.
51. Hung RJ, Ulrich CM, Goode EL, Brhane Y, Muir K, Chan AT, Marchand LL, Schildkraut J, Witte JS, Eeles R, Boffetta P, Spitz MR, Poirier JG, et al. Cross Cancer Genomic Investigation of Inflammation Pathway for Five Common Cancers: Lung, Ovary, Prostate, Breast, and Colorectal Cancer. J Natl Cancer Inst. 2015; 107.
52. Yin X, Zhang Y, Guo S, Jin H, Wang W, Yang P. Large scale systematic proteomic quantification from non-metastatic to metastatic colorectal cancer. Scientific reports. 2015; 5:12120.
53. Neapolitan R, Horvath CM, Jiang X. Pan-cancer analysis of TCGA data reveals notable signaling pathways. BMC cancer. 2015; 15:516.
54. Shimamoto Y, Nukatsuka M, Takechi T, Fukushima M. Association between mRNA expression of chemotherapy-related genes and clinicopathological features in colorectal cancer: A large-scale population analysis. Int J Mol Med. 2016; 37:319–328.
55. Chen X, Shi K, Wang Y, Song M, Zhou W, Tu H, Lin Z. Clinical value of integrated-signature miRNAs in colorectal cancer: miRNA expression profiling analysis and experimental validation. Oncotarget. 2015; 6:37544–37556. doi: 10.18632/oncotarget.6065.
56. Jung Y, Jun Y, Lee HY, Kim S, Jung Y, Keum J, Lee YS, Cho YB, Lee S, Kim J. Characterization of SLC22A18 as a tumor suppressor and novel biomarker in colorectal cancer. Oncotarget. 2015; 6:25368–25380. doi: 10.18632/oncotarget.4681.
57. Li Q, Dai Y, Wang F, Hou S. Differentially expressed long non-coding RNAs and the prognostic potential in colorectal cancer. Neoplasma. 2016; 63:977–983.
58. Wang R, Du L, Yang X, Jiang X, Duan W, Yan S, Xie Y, Zhu Y, Wang Q, Wang L, Yang Y, Wang C. Identification of long noncoding RNAs as potential novel diagnosis and prognosis biomarkers in colorectal cancer. J Cancer Res Clin Onco. 2016; 142:2291–2301.
59. Tsukahara T, Matsuda Y, Haniu H. Cyclic phosphatidic acid stimulates cAMP production and inhibits growth in human colon cancer cells. PloS one. 2013; 8:e81139.
60. Wang Z, Zhang L, Ni Z, Sun J, Gao H, Cheng Z, Xu J, Yin P. Resveratrol induces AMPK-dependent MDR1 inhibition in colorectal cancer HCT116/L-OHP cells by preventing activation of NF-kappaB signaling and suppressing cAMP-responsive element transcriptional activity. Tumour Biol. 2015; 36:9499–9510.
61. Robinson MD, McCarthy DJ, Smyth GK. edgeR: a Bioconductor package for differential expression analysis of digital gene expression data. Bioinformatics. 2010; 26:139–140.
62. Shen L, Zhao L, Tang J, Wang Z, Bai W, Zhang F, Wang S, Li W. Key Genes in Stomach Adenocarcinoma Identified via Network Analysis of RNA-Seq Data. Pathol Oncol Res. 2017.
63. Vallega KA, Liu N, Myers JS, Yu K, Sang QX. Elevated Resistin Gene Expression in African American Estrogen and Progesterone Receptor Negative Breast Cancer. PloS one. 2016; 11:e0157741.
64. Anders S, Huber W. Differential expression analysis for sequence count data. Genome biology. 2010; 11:R106.
65. Yang S, Guo L, Shao F, Zhao Y, Chen F. A Systematic Evaluation of Feature Selection and Classification Algorithms Using Simulated and Real miRNA Sequencing Data. Comput Math Methods Med. 2015; 2015:178572.
66. Zhou X, Huang Z, Xu L, Zhu M, Zhang L, Zhang H, Wang X, Li H, Zhu W, Shu Y, Liu P. A panel of 13-miRNA signature as a potential biomarker for predicting survival in pancreatic cancer. Oncotarget. 2016; 7:69616–69624. doi: 10.18632/oncotarget.11903.
67. Heagerty PJ, Lumley T, Pepe MS. Time-dependent ROC curves for censored survival data and a diagnostic marker. Biometrics. 2000; 56:337–344.
68. Zhou M, Sun Y, Sun Y, Xu W, Zhang Z, Zhao H, Zhong Z, Sun J. Comprehensive analysis of lncRNA expression profiles reveals a novel lncRNA signature to discriminate nonequivalent outcomes in patients with ovarian cancer. Oncotarget. 2016; 7:32433–32448. doi: 10.18632/oncotarget.8653.
69. Adler P, Kolde R, Kull M, Tkachenko A, Peterson H, Reimand J, Vilo J. Mining for coexpression across hundreds of datasets using novel rank aggregation and visualization methods. Genome biology. 2009; 10:R139.