
INTRODUCTION
Metabolic syndrome (MetS) is a cluster of multiple metabolic disorders including abdominal obesity, hypertension, glucose intolerance and dyslipidemia [1]. The prevalence of MetS is increasing at alarming rates threatening people’s health by placing them at a higher risk of cardiovascular diseases, stroke and kidney diseases. Although physical inactivity, overweight/obesity and insulin resistance are definite risk factors for MetS [2], the underlying causes remain inconclusive.
Betatrophin, also known as lipasin, angiopoietin-like protein 8 (ANGPTL8) and refeeding induced fat and liver (RIFL), is a newly identified circulating adipokine predominantly synthesized in the liver and adipose tissue [3-6]. Betatrophin was supposed to be a regulatory mediator of glucose homeostasis and lipid metabolism in previous studies [7, 8]. Yi and colleagues showed that betatrophin promotes beta cell proliferation and expansion in insulin resistant mice [9]. However, several studies failed to prove its anti-diabetic effect [10, 11]. Therefore, controversy remains concerning the role of betatrophin in glucose homeostasis and insulin sensitivity [12-14]. However, it is well accepted that betatrophin operates as a blood lipid regulator by inhibiting lipoprotein lipase activity either directly or indirectly through promoting ANGPTL3 cleavage [3, 5, 8, 10].
Since the discovery of betatrophin has raised new hope for therapeutic approaches or identification of a potential biomarker for metabolic disorders, there is an increasing interest in measurement of the circulating level of betatrophin in humans. However, their results are conflicting. Some studies reported increased circulating betatrophin levels in patients with type 2 diabetes mellitus (T2DM) [15-20] and obesity [15, 21, 22], whereas others found no difference [23, 24] or even a decrease [25] in these metabolic disorders. Our previous meta-analysis has shown that the association between circulating betatrophin level and T2DM was diverse in different body mass groups [26]. There are also many discrepancies in results regarding the association between betatrophin and various metabolic parameters related to metabolic diseases [15-25, 27, 28].
A recent prospective cohort study has demonstrated that decreased levels of circulating betatrophin were related to the development of MetS [29]. However, it remains unknown whether betatrophin metabolism is altered in patients with MetS, we aimed to evaluate the circulating betatrophin levels in MetS patients in the current study.
RESULTS
Characteristics of study participants
As shown in Figure 1, we identified 47 MetS patients who met the inclusion criteria out of 1,245 cases approached in the Outpatient Clinic, and 47 age and sex matched healthy controls were recruited among 301 subjects approached in the Physical Examination Center during the enrollment period. The baseline characteristics of the two groups (MetS and healthy control) were summarized in Table 1. Since participants were matched for age and gender distribution, both were similar between the two groups. There was no statistically significant difference in low-density lipoprotein cholesterol (LDL-C), creatinine, estimated glomerular filtration rate (eGFR), alkaline phosphatase (ALP), total bilirubin (TBIL), direct bilirubin (DBIL), indirect bilirubin (IBIL) between groups. Body mass index (BMI), waist-to-hip ratio (WHR), fasting plasma glucose (FPG), hemoglobin A1c (HbA1c), triglyceride (TG), total cholesterol (TC), uric acid (UA), alanine transaminase (ALT), aspartate transaminase (AST) and γ-glutamyl transpeptidase (GGT) in MetS group were significantly higher than those in control group (P < 0.01, respectively), while high-density lipoprotein cholesterol (HDL-C) and albumin (ALB) were significantly lower (P < 0.05). The mean HOMA-1IR and HOMA-2IR in patients with MetS were 4.90 ± 3.57 and 2.26 ± 1.42, respectively.
Table 1: Clinical and biochemical characteristics in control subjects and in patients with metabolic syndrome
Variables |
Healthy Control (n= 47) |
MetS (n= 47) |
P value |
Age (years) |
43.72 ± 9.04 |
43.70 ± 11.75 |
- |
Sex, male/female |
36:11 |
36:11 |
- |
BMI (kg/m2) |
23.49 ± 3.15 |
28.70 ± 3.54 |
<0.001 |
Waist circumference (cm) |
79.68 ± 10.08 |
96.52 ± 7.72 |
<0.001 |
Hip circumference (cm) |
93.78 ± 5.21 |
101.51 ± 6.12 |
<0.001 |
WHR |
0.85 ± 0.07 |
0.95 ± 0.05 |
<0.001 |
Total betatrophin (ng/ml) |
1.31 ± 1.08 |
1.20 ± 0.79 |
0.524 |
Full-length betatrophin (pg/ml) |
356.64 ± 287.92 |
694.84 ± 365.51 |
<0.001 |
HbA1c (%) |
5.49 ± 0.34 |
6.54 ± 1.33 |
<0.001 |
FPG (mmol/L) & |
5.13 ± 1.10 |
6.31 ± 1.32 |
<0.001 |
TG (mmol/L) & |
1.35 ± 1.78 |
2.57 ± 1.91 |
<0.001 |
TC (mmol/L) |
4.89 ± 0.77 |
5.48 ± 1.23 |
0.006 |
HDL-C (mmol/L) |
1.49 ± 0.56 |
1.19 ± 0.35 |
0.003 |
LDL-C (mmol/L) |
2.67 ± 0.52 |
2.90 ± 0.95 |
0.114 |
Creatinine (umol/L) |
79.66 ± 13.79 |
79.87 ± 18.73 |
0.926 |
eGFR (mL/min/1.73 m2) |
96.87 ± 11.61 |
97.82 ± 19.28 |
0.694 |
UA (μmol/L) |
348.70 ± 92.38 |
440.55 ± 119.13 |
<0.001 |
ALT (IU/L) |
23.80 ± 11.64 |
51.62 ± 38.40 |
<0.001 |
AST (IU/L) |
23.39 ± 4.83 |
37.96 ± 21.42 |
<0.001 |
ALP (IU/L) |
77.06 ± 20.58 |
79.47 ± 20.31 |
0.597 |
ALB (g/L) |
47.71 ± 2.44 |
46.47 ± 3.22 |
0.012 |
TBIL (umol/L) & |
14.13 ± 1.45 |
13.18 ± 1.45 |
0.376 |
DBIL (umol/L) |
4.78 ± 2.01 |
4.06 ± 1.60 |
0.054 |
IBIL (umol/L) |
10.33 ± 4.61 |
10.07 ± 4.67 |
0.773 |
GGT (IU/L)& |
22.91 ± 2.09 |
46.77 ± 2.19 |
<0.001 |
All values are given as mean ± SD.
& indicates variables been log-transformed before paired-samples t test.
Abbreviations: IU, international unit.
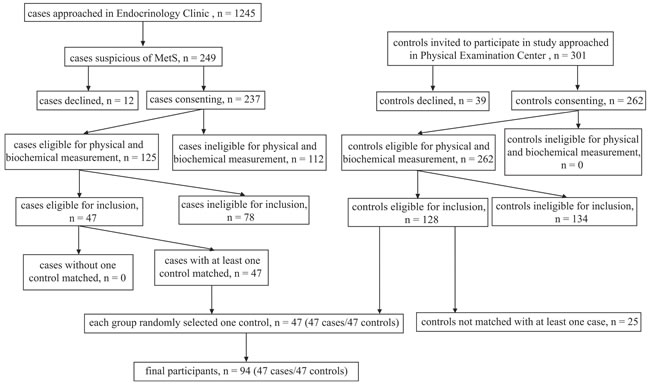
Figure 1: Flow chart of recruitment.
Circulating betatrophin levels
As shown in Figure 2, full-length betatrophin levels were higher in patients with MetS compared to those of controls with statistical significance (694.84 ± 365.51 pg/ml versus 356.64 ± 287.92 pg/ml; P < 0.001). While there was no significant difference of total betatrophin levels between the two groups (1.20 ± 0.79 ng/ml versus 1.31 ± 1.08 ng/ml; P = 0.524).
As shown in Figure 3, binary logistic regression analysis of full-length betatrophin indicated subjects in the highest tertile and the intermediate tertile of betatrophin had significantly higher risks for developing MetS compared with those in the lowest tertile (highest versus lowest: OR, 8.6, 95% CI 2.8-26.8, P < 0.001; intermediate versus lowest: OR, 3.2, 95% CI 1.1-9.3, P < 0.05, respectively). The SPSS binary logistic regression output is shown in Supplementary Table 1.
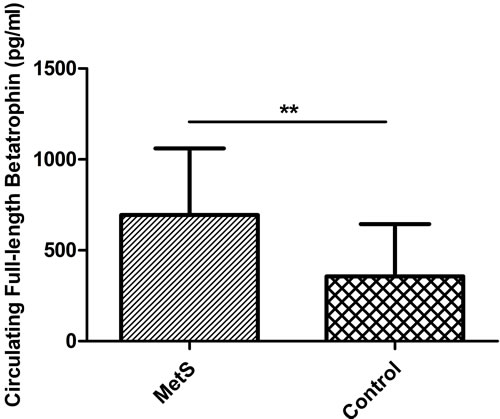
Figure 2: Circulating full-length betatrophin levels in patients with metabolic syndrome (n = 47) and healthy controls (n = 47). Error bar refers to standard deviation. ** < 0.001.
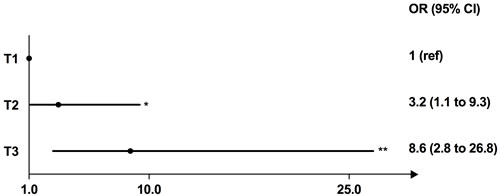
Figure 3: Association of betatrophin with metabolic syndrome. Odds ratio (OR) for having metabolic syndrome according to the tertiles of the rank orders of circulating full-length betatrophin levels (reference: the lowest tertile). Abbreviations: T, tertile. * < 0.05; ** < 0.001.
Correlations of betatrophin with clinical parameters
Among the patients with MetS, a significant correlation was found between full-length betatrophin and FPG (r = 0.357, P = 0.014) and 2-hour plasma glucose (2hPG) (r = 0.38, P = 0.008). Both correlations remain significant even after adjustment for age, sex and BMI (FPG, adjusted r = 0.350, P = 0.020; 2hPG, adjusted r = 0.372, P = 0.013, respectively) (Table 2). No significant correlation between full-length betatrophin and any other clinical parameters was detected (Table 2). Circulating total betatrophin was not correlated with these variables among the patients with MetS (Supplementary Table 2).
Table 2: Univariate and partial correlations with circulating full-length betatrophin levels in patients with metabolic syndrome
Betatrophin r |
P value |
Betatrophin (age, sex and BMI adjusted) r |
P value |
|
Age |
-0.039 |
0.797 |
- |
- |
BMI |
-0.064 |
0.670 |
- |
- |
Waist circumference |
0.003 |
0.981 |
0.049 |
0.750 |
Hip circumference |
-0.127 |
0.396 |
-0.115 |
0.456 |
WHR |
0.151 |
0.311 |
0.139 |
0.368 |
HbA1c |
0.246 |
0.095 |
0.239 |
0.118 |
FPG& |
0.357 |
0.014 |
0.350 |
0.020 |
TG& |
0.204 |
0.168 |
0.177 |
0.251 |
TC |
-0.089 |
0.553 |
-0.124 |
0.424 |
HDL-C |
-0.19 |
0.200 |
-0.180 |
0.242 |
LDL-C |
-0.200 |
0.178 |
-0.210 |
0.171 |
Creatinine |
0.136 |
0.361 |
0.105 |
0.496 |
eGFR |
-0.127 |
0.396 |
-0.171 |
0.268 |
UA |
0.050 |
0.739 |
-0.002 |
0.988 |
ALT |
-0.089 |
0.554 |
-0.117 |
0.450 |
AST |
-0.114 |
0.447 |
-0.144 |
0.350 |
ALP |
0.212 |
0.153 |
0.219 |
0.154 |
GGT& |
0.233 |
0.115 |
0.234 |
0.126 |
ALB |
-0.207 |
0.162 |
-0.267 |
0.079 |
TBIL& |
0.053 |
0.607 |
0.089 |
0.397 |
DBIL |
0.058 |
0.699 |
0.078 |
0.613 |
IBIL |
0.163 |
0.275 |
0.167 |
0.280 |
HOMA1-IR |
0.208 |
0.16 |
0.235 |
0.124 |
1/ HOMA1-IR |
-0.141 |
0.343 |
-0.155 |
0.314 |
HOMA1-β (%) |
-0.014 |
0.927 |
-0.006 |
0.969 |
HOMA2-%B |
-0.095 |
0.523 |
-0.097 |
0.531 |
HOMA2-%S |
-0.077 |
0.609 |
-0.086 |
0.578 |
HOMA2-IR |
0.125 |
0.403 |
0.154 |
0.317 |
1/ HOMA2-IR |
-0.078 |
0.605 |
-0.087 |
0.572 |
Glucose120 |
0.38 |
0.008 |
0.372 |
0.013 |
Insulin0& |
0.070 |
0.640 |
0.090 |
0.563 |
Insulin120 |
-0.037 |
0.805 |
-0.051 |
0.741 |
& indicates log-transformed variables.
Abbreviations: HOMA1-IR, homeostasis model assessment 1 to estimate insulin resistance; HOMA1-β, homeostasis model assessment 1 to estimate β-cell function; HOMA2-%B, homeostasis model assessment 2 to estimate β-cell function; HOMA2-IR, homeostasis model assessment 2 to estimate insulin resistance; HOMA2-%S, homeostasis model assessment 2 to estimate insulin sensitivity.
DISCUSSION
In the current study, we detected the circulating betatrophin levels by using ELISA kits from two different manufacturers, and compared the data between MetS patients and age-, sex-matched controls. We have demonstrated that serum full-length but not total betatrophin levels were higher in patients with MetS than those in healthy controls.
Our data were supported by the work of Abu-Farha et al [30]. This unmatched nested case-control study with large sample size in West and South Asia indicated a 2.4 fold increased risk of MetS in subjects of the highest full-length betatrophin level tertile compared to those of the lowest tertile. To be noted, we used a group of strictly matched “super healthy” controls, when they used mixed controls with one or more metabolic disorders which did not meet the criteria of MetS. The difference of control selection may help explain their slighter association compared with our study.
Nevertheless, our findings were not consistent with another recent published study performed by Crujeiras et al [22] in which serum total betatrophin levels of obese-MetS subjects were higher than those of normal-weight subjects, while our study did not detect a significant difference between MetS patients and healthy controls. The disparity may be due to differences in anthropometric characters and medication usage. All MetS patients enrolled in Crujeiras’ study were obese Caucasian and some of the patients were receiving anti-diabetic medications. Our MetS were all drug-naïve Chinese Han population, 53% of which were not obese. Whether oral hypoglycemic agents will affect serum betatrophin concentration remains unclear. Based on our findings, we hypothesized that full-length and total betatrophin may exert different effects under various physiological and pathological conditions, which needs to be validated by further studies.
Our results also showed that fasting serum full-length betatrophin levels were positively correlated with FPG and 2hPG. Consistent with our finding, previous studies conducted by different groups also showed positive correlation between full-length betatrophin and FPG or 2hPG [17, 18]. The association between full-length betatrophin and glucose parameters confirmed the potential role of betatrophin in the development of T2DM, which was the dominant component of MetS. To be noted, circulating total betatrophin level was not found to be associated with any of these parameters in our study. It is different from Crujeiras et al.’s results [22]. Apparently, it was the cleavage of circulating betatrophin that contributed to the pathogenesis of these metabolic disorders. Further investigations are required to illustrate these mechanisms.
Our data did not find the association between circulating full-length betatrophin level with lipid profiles, transaminases and other parameters, which were suggested by previous reports [17, 31]. In a recent study, urine albumin / creatinine ratio (uACR) was considered to be associated with the circulating betatrophin level [32]. However, uACR was not measured in our study, and could be investigated in the future analysis.
Our study had several strengths. Firstly, both full-length and total betatrophin concentrations were measured in the same study population. Secondly, our study used age- and sex- matched controls making two groups more comparable. Thirdly, “super-healthy” criteria made a homogenous control group. Fourthly, all participants in our study were drug-naïve, and potential confounding factors were adjusted.
We also have some limitations. Firstly, this study cannot prove causality due to its cross-sectional study design. Secondly, despite the number of included participants reached the calculated sample size, it did not allow further subgroup analysis due to the limited power. Nevertheless, “super-healthy” matching controls and drug naïve patients had adjusted major confounding factors during the study design.
In conclusion, our study has demonstrated that circulating full-length betatrophin concentration but not total betatrophin concentration was higher in drug-naïve MetS patients and positively correlated with both fasting and postprandial blood glucose. Further studies are required to explore the potential role of circulating betatrophin and its cleavage in the pathogenesis of MetS.
MATERIALS AND METHODS
Study design and subjects
We recruited patients with MetS from the Outpatient Clinic by the Department of Endocrinology and Metabolism of West China Hospital and healthy volunteers as controls from the West China Hospital Physical Examination Center. All participants were enrolled between July 2015 and December 2015. General inclusion criteria for both groups were as follows: (1) aged between 18 and 70 years old; (2) informed consent to participate in the study; (3) adequate serum was collected for this study. A specific inclusion criterion for the MetS group was being diagnosed with MetS based on clinical and laboratory assessments according to the 1998 WHO consensus criteria [33]. Age and sex matched healthy subjects were recruited reaching the following criteria: normal body weight (BMI ranged from 18.5 to 23.9 kg/m2) without self-reported metabolic disorders of MetS, such as hypertension, dyslipidemia, diabetes mellitus, impaired glucose tolerance or impaired fasting glucose. Based on self-reported information, the participants with following conditions were excluded from both groups: (1) presence of acute infectious diseases, such as acute upper respiratory tract infection; (2) hepatic cirrhosis or ongoing dialysis; (3) congestive heart failure; (4) known malignancy; (5) psychological disorders; (6) pregnancy; (7) taking medications for dyslipidemia, hyperglycemia, hypertension, insulin resistance or obesity.
All subjects enrolled gave their informed consent to participate in this study. The protocol for this study was approved by the ethics committee at our hospital.
Sample size calculation
The sample size was calculated for a 1:1 paired sample study with a power of 90% and a two-sided statistical significance level of 0.05. The standard deviation of circulating full-length betatrophin concentration was based on a previous publication of T2DM [26]. Setting a non-response rate of 20% resulted in a total sample size of 44 required for this study.
Anthropometric measurements
All participants provided their medical history and received physical examination. Anthropometric and body composition measurements were performed within two days when blood samples were collected. Weight and height were measured when the participants were required to wear light clothes and barefooted after defecation. BMI was calculated as body weight in kilograms divided by the square of the height in meters. Waist circumference was measured at the narrowest point between the rib cage and the iliac crest. Hip circumference was measured at the widest point over the hipshot. WHR was calculated as waist circumference in centimeters divided by hip circumference in centimeters.
Biochemical measurements
All blood samples were collected after overnight fasting for at least 8 hours. Oral glucose tolerance test (OGTT) with 75g glucose was performed in MetS patients. Insulin levels were measured by electrochemiluminescence immunoassay (ECLIA) method (Elecsys 2010, Roche Diagnostics, Mannheim, Germany); HbA1c was determined by a method based on high-performance liquid chromatography (HPLC) which was approved by National Glycohemoglobin Standardization Program (NGSP) (HLC-723 G8, Tosoh Corporation, Japan); Plasma glucose, TC, TG, LDL-C, HDL-C, ALT, AST, GGT, ALP, ALB, TBIL, DBIL, IBIL, creatinine, UA were measured on an automatic biochemistry analyzer (Modular P800, Roche Diagnostics GmbH, Germany) according to standard laboratory procedures. The homeostatic model assessment (HOMA) is used to quantify insulin resistance and beta-cell function. The HOMA1-IR index was calculated by the following formula:
HOMA1-IR = fasting plasma insulin (µU/mL) × fasting plasma glucose (mmol/L) / 22.5, ![]() [34]. The HOMA2-IR index was calculated by the program HOMA Calculator v2.2.3 [35]. The estimated glomerular filtration rate (eGFR) was calculated by Modification of Diet in Renal Disease (MDRD) equation.
[34]. The HOMA2-IR index was calculated by the program HOMA Calculator v2.2.3 [35]. The estimated glomerular filtration rate (eGFR) was calculated by Modification of Diet in Renal Disease (MDRD) equation.
Circulating betatrophin measurement
Circulating full-length betatrophin concentration was determined using a commercially available ELISA kit (catalog number E11644h; Wuhan Eiaab Science, Wuhan, China) with the intra- and inter-assay coefficient of variance (CV) ≤4.8% and ≤7.2% respectively. Total betatrophin level (including full-length and C-terminal fragment of betatrophin) was assessed by another ELISA kit (catalog number EK-051-55, Phoenix Pharmaceuticals, Phoenix, USA) [36]. The intra- and inter-assay CV were < 10% and < 15% respectively. All samples were analyzed in duplicates according to the manufacturer’s instructions. Samples with CV > 15% were measured repeatedly.
Statistical analysis
Distribution of the data was tested by the Kolmogorov-Smirnov test. FPG, TG, GGT, TBIL and insulin (0 min) values were logarithmically transformed before analysis due to their non-normal distribution. After transformation, all data were normally distributed and presented as mean ± standard deviation (SD). Comparisons of quantitative variables among groups were performed by paired-samples t test. Categorical variables were examined by χ2 test. Correlations between variables were analyzed by Pearson’s correlation coefficients (r) among patients with MetS. Participants were stratified into tertiles according to the rank orders of their serum full-length betatrophin levels in the overall population. Odds ratios (ORs) with 95% confidence intervals (CIs) were estimated by performing binary logistic regression analysis to assess circulating betatrophin tertile on the risk of MetS. SPSS software version 20.0 (SPSS Inc., Chicago, IL) was used for all statistical analysis. A P value < 0.05 was considered statistically significant.
CONFLICTs OF INTEREST
The authors declare that they have no conflict of interest.
GRANT SUPPORT
This study was funded by the National Natural Science Foundation of China (Grant No. 81400811 and 21534008), National Basic Research Program of China (Grant No. 2015CB942800) and Scientific Research Project of Health and Family Planning Commission of Sichuan Province (Grant No. 130029 and 150149).
Author contributions
SL, HT and ZA conceived the study. DL, SL, CY and XS designed the study and analyzed the data. JWL and ZA recruited the patients. DL, HH, LL and YC performed the clinical evaluation and anthropometric measurements of the participants. DL, HH, JWL and JSL performed biochemical and betatrophin measurements. DL, SL and XL drafted the manuscript. All authors discussed and revised the manuscript for submission for publication.
REFERENCES
1. Eckel RH, Grundy SM, Zimmet PZ. The metabolic syndrome. Lancet. 2005; 365: 1415-28.
2. Gallagher EJ, Leroith D, Karnieli E. Insulin resistance in obesity as the underlying cause for the metabolic syndrome. Mt Sinai J Med. 2010; 77: 511-23.
3. Zhang R. Lipasin, a novel nutritionally-regulated liver-enriched factor that regulates serum triglyceride levels. Biochem Biophys Res Commun. 2012; 424: 786-92.
4. Ren G, Kim JY, Smas CM. Identification of RIFL, a novel adipocyte-enriched insulin target gene with a role in lipid metabolism. Am J Physiol Endocrinol Metab. 2012; 303: E334-51.
5. Quagliarini F, Wang Y, Kozlitina J, Grishin NV, Hyde R, Boerwinkle E, Valenzuela DM, Murphy AJ, Cohen JC, Hobbs HH. Atypical angiopoietin-like protein that regulates ANGPTL3. Proc Natl Acad Sci U S A. 2012; 109: 19751-6.
6. Dong XY, Pang XW, Yu ST, Su YR, Wang HC, Yin YH, Wang YD, Chen WF. Identification of genes differentially expressed in human hepatocellular carcinoma by a modified suppression subtractive hybridization method. Int J Cancer. 2004; 112: 239-48.
7. Zhang R, Abou-Samra AB. A dual role of lipasin (betatrophin) in lipid metabolism and glucose homeostasis: consensus and controversy. Cardiovasc Diabetol. 2014; 13: 133.
8. Zhang R, Abou-Samra AB. Emerging roles of Lipasin as a critical lipid regulator. Biochem Biophys Res Commun. 2013; 432: 401-5.
9. Yi P, Park JS, Melton DA. Betatrophin: a hormone that controls pancreatic beta cell proliferation. Cell. 2013; 153: 747-58.
10. Wang Y, Quagliarini F, Gusarova V, Gromada J, Valenzuela DM, Cohen JC, Hobbs HH. Mice lacking ANGPTL8 (Betatrophin) manifest disrupted triglyceride metabolism without impaired glucose homeostasis. Proc Natl Acad Sci U S A. 2013; 110: 16109-14.
11. Gusarova V, Alexa CA, Na E, Stevis PE, Xin Y, Bonner-Weir S, Cohen JC, Hobbs HH, Murphy AJ, Yancopoulos GD, Gromada J. ANGPTL8/betatrophin does not control pancreatic beta cell expansion. Cell. 2014; 159: 691-6.
12. Kaestner KH. Betatrophin—promises fading and lessons learned. Cell Metab. 2014; 20: 932-3.
13. Stewart AF. Betatrophin versus bitter-trophin and the elephant in the room: time for a new normal in beta-cell regeneration research. Diabetes. 2014; 63: 1198-9.
14. Espes D, Martinell M, Liljeback H, Carlsson PO. Betatrophin in Diabetes Mellitus: the Epidemiological Evidence in Humans. Curr Diab Rep. 2015; 15: 104.
15. Fu Z, Berhane F, Fite A, Seyoum B, Abou-Samra AB, Zhang R. Elevated circulating lipasin/betatrophin in human type 2 diabetes and obesity. Sci Rep. 2014; 4: 5013.
16. Espes D, Martinell M. Increased circulating betatrophin concentrations in patients with type 2 diabetes. 2014; 2014: 323407.
17. Hu H, Sun W, Yu S, Hong X, Qian W, Tang B, Wang D, Yang L, Wang J, Mao C, Zhou L, Yuan G. Increased circulating levels of betatrophin in newly diagnosed type 2 diabetic patients. Diabetes Care. 2014; 37: 2718-22.
18. Chen X, Lu P, He W, Zhang J, Liu L, Yang Y, Liu Z, Xie J, Shao S, Du T, Su X, Zhou X, Hu S, et al. Circulating betatrophin levels are increased in patients with type 2 diabetes and associated with insulin resistance. J Clin Endocrinol Metab. 2015; 100: E96-100.
19. Abu-Farha M, Abubaker J, Al-Khairi I, Cherian P, Noronha F, Hu FB, Behbehani K, Elkum N. Higher plasma betatrophin/ANGPTL8 level in Type 2 Diabetes subjects does not correlate with blood glucose or insulin resistance. Sci Rep. 2015; 5: 10949.
20. Gao T, Jin K, Chen P, Jin H, Yang L, Xie X, Yang M, Hu C, Yu X. Circulating Betatrophin Correlates with Triglycerides and Postprandial Glucose among Different Glucose Tolerance Statuses—A Case-Control Study. PLoS One. 2015; 10: e0133640.
21. Wu S, Gao H, Ma Y, Fu L, Zhang C, Luo X. Characterisation of betatrophin concentrations in childhood and adolescent obesity and insulin resistance. Pediatr Diabetes. 2016; 17: 53-60.
22. Crujeiras AB, Zulet MA, Abete I, Amil M, Carreira MC, Martinez JA, Casanueva FF. Interplay of atherogenic factors, protein intake and betatrophin levels in obese-metabolic syndrome patients treated with hypocaloric diets. Int J Obes (Lond). 2016; 40: 403-10.
23. Fenzl A, Itariu BK, Kosi L, Fritzer-Szekeres M, Kautzky-Willer A, Stulnig TM, Kiefer FW. Circulating betatrophin correlates with atherogenic lipid profiles but not with glucose and insulin levels in insulin-resistant individuals. Diabetologia. 2014; 57: 1204-8.
24. Guo K, Lu J, Yu H, Zhao F, Pan P, Zhang L, Chen H, Bao Y, Jia W. Serum betatrophin concentrations are significantly increased in overweight but not in obese or type 2 diabetic individuals. Obesity (Silver Spring). 2015; 23: 793-7.
25. Gomez-Ambrosi J, Pascual E, Catalan V, Rodriguez A, Ramirez B, Silva C, Gil MJ, Salvador J, Fruhbeck G. Circulating betatrophin concentrations are decreased in human obesity and type 2 diabetes. J Clin Endocrinol Metab. 2014; 99: E2004-9.
26. Li S, Liu D, Li L, Li Y, Li Q, An Z, Sun X, Tian H. Circulating Betatrophin in Patients with Type 2 Diabetes: A Meta-Analysis. J Diabetes Res. 2016; 2016: 6194750.
27. Calan M, Yilmaz O, Kume T, Unal Kocabas G, Yesil Senses P, Senses YM, Temur M, Gursoy Calan O. Elevated circulating levels of betatrophin are associated with polycystic ovary syndrome. Endocrine. 2016; 53: 271-9.
28. Pascual-Corrales E, Gomez-Ambrosi J, Moncada R, Valenti V, Catalan V, Rodriguez A, Ramirez B, Silva C, Gil MJ, Salvador J, Fruhbeck G. Circulating ANGPTL8/Betatrophin Concentrations Are Increased After Surgically Induced Weight Loss, but Not After Diet-Induced Weight Loss. Obes Surg. 2016;26: 1881-9.
29. Wang H, Lai Y, Han C, Liu A, Fan C, Wang H, Zhang H, Ding S, Teng W, Shan Z. The Effects of Serum ANGPTL8/betatrophin on the Risk of Developing the Metabolic Syndrome - A Prospective Study. Sci Rep. 2016; 6:28431.
30. Abu-Farha M, Abubaker J, Al-Khairi I, Cherian P, Noronha F, Kavalakatt S, Khadir A, Behbehani K, Alarouj M, Bennakhi A, Elkum N. Circulating angiopoietin-like protein 8 (betatrophin) association with HsCRP and metabolic syndrome. Cardiovasc Diabetol. 2016; 15: 25.
31. Gokulakrishnan K, Manokaran K, Pandey GK, Amutha A, Ranjani H, Anjana RM, Mohan V. Relationship of betatrophin with youth onset type 2 diabetes among Asian Indians. Diabetes Res Clin Pract. 2015; 109:71-6.
32. Chen CC, Susanto H, Chuang WH, Liu TY, Wang CH. Higher serum betatrophin level in type 2 diabetes subjects is associated with urinary albumin excretion and renal function. Cardiovasc Diabetol. 2016; 15:3.
33. Alberti KG, Zimmet PZ. Definition, diagnosis and classification of diabetes mellitus and its complications. Part 1: diagnosis and classification of diabetes mellitus provisional report of a WHO consultation. Diabet Med. 1998; 15: 539-53.
34. Matthews DR, Hosker JP, Rudenski AS, Naylor BA, Treacher DF, Turner RC. Homeostasis model assessment: insulin resistance and beta-cell function from fasting plasma glucose and insulin concentrations in man. Diabetologia. 1985; 28: 412-9.
35. The Oxford Centre for Diabetes, Endocrinology and Metabolism. Diabetes Trial Unit HOMA Calculator. Available from http://www.dtu.ox.ac.uk/ Accessed June 2015.
36. Fu Z, Abou-Samra AB, Zhang R. An explanation for recent discrepancies in levels of human circulating betatrophin. Diabetologia. 2014; 57: 2232-4.