
INTRODUCTION
Hepatitis B virus (HBV) infection is a major health problem affecting approximately two billion people worldwide. Approximately 240 million individuals are chronically infected with 780,000 annually reported deaths due to HBV infection [1]. HBV infection causes a wide spectrum of clinical manifestations of liver diseases. Besides asymptomatic carriers, HBV causes chronic hepatitis B (CHB), liver cirrhosis (LC) and hepatocellular carcinoma (HCC). The five-year cumulative risk for the development of HBV-related LC ranges between 10% and 20% [2]. In addition, chronic HBV infection accounts for 50% of all HCC cases and most HCC cases (70%-80%) occur in patients with HBV-related LC [3].
During the course of HBV infection, the mechanism of liver injury is dependent on the host immune responses [4]. The innate immune responses play a major role in suppression of viral replication and in inflammatory activity during the early stage of HBV infection. These responses include the secretion of interferons (IFNs) and cytokines, which are regulated by Janus kinase/Signal Transducer and Activator of Transcription (JAK/STAT) signaling [5, 6] and involvement of JAK/STAT pathway in HBV infection had been well documented [7, 8]. Suppressors of cytokine signaling (SOCS) family proteins (CISH and SOCS1 to SOCS7) belong to a classical negative feedback system that regulates cytokine transduction via JAK/STAT signaling pathway [9]. Of these SOCS family, SOCS3 is a key regulator of interleukin (IL)-6 and IL-10, which are activated by Toll-like receptor stimulation. SOCS3 can inhibit the process of cell proliferation and cell survival through inhibition of STAT3 activation [6, 10]. STAT3, an oncogene, is largely correlated with NF-kβ activation [11, 12]. The activation of STAT3 by cytokines (e.g. IL-6 and IL-22) mediated by JAK/STAT signaling pathway was shown earlier to induce inflammation and subsequent carcinogenesis [10–12]. SOCS3 functionally suppresses STAT3 activation and negatively regulate tumor development. Therefore, SOCS3 is a vital regulator of several diseases including atopic, autoimmune and infectious diseases, inflammation, and cancer development [13, 14].
SOCS3 overexpression has been shown in the liver tissue of CHB patients and is associated with the severity of inflammation suggesting that JAK/STAT signaling pathway is dysregulated in HBV-infected hepatocytes [15]. The hypermethylation in the CpG (5'-Cytosine-phosphate-Guanine-3') islands of the SOCS3 promoter can be a prognostic indicator in cancer development [16]. In addition, SOCS3 expression is further influenced by SOCS3 polymorphisms, especially in the SOCS3 promoter. To date, SOCS3 polymorphisms were documented in several diseases including HCV infection and colorectal cancer [14, 17–20]. However, there are so far no available data on association of SOCS3 promoter variants with susceptibility to HBV infection and the clinical course of HBV-related liver diseases. In addition, the involvement of epigenetics during the clinical course of HBV infection needs to be studied. Therefore, this study aims to investigate whether SOCS3 promoter variants are associated with HBV infection and HBV-related liver diseases and to investigate the hypermethylation in the SOCS3 promoter region and corresponding SOCS3 mRNA expression in HBV-related HCC.
RESULTS
Baseline characteristics of study participants
The baseline characteristics of the 878 HBV-infected patients and 272 healthy controls (HC) are shown in Table 1. Most HBV patients and HCs were male (86% and 66%, respectively). The median age of patients increased according to the clinical progression of the liver disease. HCs were younger than patient groups (P<0.05). The levels of liver enzymes ALT, AST and HBV loads were higher in CHB patients compared to other subgroups (P<0.01). As expected, albumin and prothrombin levels and platelet counts were lower in LC patients compared to the other patient groups (P<0.001). AFP levels were higher in HCC patients compared to CHB and LC patients (P<0.001). The clinical profile of the 37 HCC patients who underwent surgery and corresponding data of their liver specimens are described in Table 2. Most patients were male (89%) and were between 40-60 years of age (73%). The HCC patients were in early and/or at intermediate stage of liver cancer according to the Barcelona clinic liver cancer (BCLC) staging criteria (stage A: 70% and stage B: 30%). All the patients were Child-Pugh class A group according to Child-Pugh classification. HBV was the common etiology of the liver cancer in this study (46%), while 8% suffered from HCV infection, and 46% showed non-HBV/non-HCV related HCC.
Table 1: Clinical profiles of 878 HBV-infected patients and 272 healthy controls
Characteristics |
CHB (n=212) |
LC (n=243) |
HCC (n=220) |
LC + HCC (n=203) |
HC (n= 272) |
|---|---|---|---|---|---|
Age (years) |
43 [18-82] |
55 [18-84] |
55 [18-81] |
50 [19-81] |
36 [18-69] ‡α |
Male (%) |
74 |
84.4 |
92.7 |
94.1 |
66 †α |
Child-Pugh classification (n) |
|||||
Child A |
NA |
117/236 |
101/173 |
93/164 |
NA |
Child B |
NA |
81/236 |
56/173 |
52/164 |
NA |
Child C |
NA |
38/236 |
16/173 |
19/164 |
NA |
Missing |
NA |
7 |
47 |
39 |
NA |
Clinical parameters |
|||||
AST (IU/L) |
72 [15-3253] ‡β |
52 [15-1221] |
50 [17-2158] |
49 [21-737] |
NR |
ALT (IU/L) |
69 [9-3382] ‡β |
46 [8-1426] |
46 [10-832] |
44 [10-1095] |
NR |
Total bilirubin (μmol/l) |
17 [8-788] |
29 [3-752] |
14 [5-235] |
22 [7-419] |
NR |
Direct bilirubin (μmol/l) |
7 [1-472] |
12 [1-450] |
5 [1.2-167] |
8 [1-214] |
NR |
Albumin (g/L) |
42 [23-48] |
30 [20-47]‡β |
39 [27-49] |
38 [23-47] |
NR |
Prothrombin (% of standard) |
87 [30-180] |
53.5 [15-101]§β |
80 [31-115] |
74 [19.6-118] |
NR |
PLT (103/ml) |
208 [19-360] |
90 [18-441]§β |
203 [20-389] |
122 [34-361] |
NR |
HBV-DNA (copies/ml) |
1.6x10⁷
|
6.8x10⁴
|
7.4x10⁵
|
1.6x10⁵
|
NA |
Alfa Feto Protein (IU/L) |
4.3 [1.5-300] |
7.4 [1.2-400] |
196 [1.1- 438] §β |
168 [1.6-489] §β |
NR |
Abbreviations: CHB: chronic hepatitis B; LC: liver cirrhosis; HCC: hepatocellular carcinoma; HC: healthy control; PLT: platelets. AST and ALT: aspartate and alanine amino transferase; IU: international unit; NR: Normal range, NA: not applicable. Values given are medians and range. P values were calculated by student's t-test, Fisher exact test, and Mann-Whitney- Wilcoxon test where appropriate. (†) P<0.05, (‡) P<0.01 and (§) P<0.001. (α) for comparison with LC, HCC and LC+HCC group; (β) for comparison with all other groups.
Table 2: Characteristics of 37 HCC patients
Characteristics |
n (%) |
|---|---|
Age (years) |
|
< 40 |
4/37 (10.8) |
40 - 60 |
27/37 (73) |
> 60 |
6/37 (16.2) |
Gender |
|
Male |
33/37 (89.2) |
Female |
4/37 (10.8) |
Etiology |
|
HBV |
17/37 (46) |
HCV |
3/37 (8) |
Non-HBV/HCV |
17/37 (46) |
Child-Pugh classification |
|
Child A |
37/37 (100) |
BCLC staging Classification |
|
Stage A |
26/37 (70.3) |
Stage B |
11/37 (29.7) |
Stage C and D |
0/ 37 (0) |
Clinical parameters |
Median (Range) |
AFP (IU/ml) |
240 [4.6 - 300] |
HBV-DNA |
NA |
PLT (103/ml) |
211 [153 - 461] |
AST (IU/ml) |
52 [21 - 415] |
ALT (IU/ml) |
66.5 [17 - 242] |
Total Bilirubin (μmol/l) |
27.8 [8.9 - 315] |
Direct Bilirubin (μmol/l) |
6.7 [1 - 178] |
Prothrombin (% of standard) |
93 [75 - 125] |
Protein (g/l) |
73 [62 - 78] |
Allbumin (g/l) |
40 [32 - 48] |
Abbreviations: BCLC: Barcelona Clinic Liver Cancer; HCC: hepatocellular carcinoma; AFP: Alpha feto protein; PLT: platelets; AST and ALT: aspartate and alanine amino transferase; IU: international unit; NA: not applicable.
SOCS3 promoter variants and HBV-related liver diseases
The genotype and allele frequencies of two SOCS3 promoter SNPs (rs111033850T/C, rs12953258C/A) in clinically classified 878 HBV patients and 272 HCs are described in Table 3 and Supplementary Table 2. The analyzed SNPs in healthy controls were in Hardy-Weinberg equilibrium (P>0.05). We compared the genotype and allele frequencies between HBV patients and HCs. We observed that heterozygous genotype rs111033850TC and minor allele rs111033850C were less frequent in HBV patients compared to HCs (OR=0.4, 95%CI=0.3-0.6, adjusted P<0.0001 and OR=0.6, 95%CI=0.4-0.8, adjusted P<0.0001; respectively). In contrast, the homozygous genotype rs12953258AA and the minor allele rs12953258A were more frequent in patients compared to HCs (OR=2.0, 95%CI=1.3-3.2, adjusted P<0.0001 and OR=1.3, 95%CI=1.1-1.6, adjusted P=0.03; respectively). A similar trend was observed for the SNP rs111033850T/C in the dominant genetic model and for the SNP rs12953258C/A in the recessive genetic model. These results indicated that the rs111033850TC contributes to a decreased risk of HBV infection while the genotype rs12953258AA contributes to increased susceptibility to HBV infection.
Table 3: Association of SOCS3 variants with HBV-related liver diseases
SOCS3 |
CHB |
LC |
HCC |
HCC+LC |
HC |
Cases vs. HC |
LC vs. CHB |
HCC vs. CHB |
HCC+LC vs. CHB |
||||
|---|---|---|---|---|---|---|---|---|---|---|---|---|---|
n=212 |
n=243 |
n=220 |
n=203 |
n=272 |
OR |
P |
OR |
P value |
OR |
P value |
OR |
P |
|
rs111033850 |
|||||||||||||
TT |
190 (89.6) |
198 (81.5) |
178 (80.9) |
162 (79.8) |
191 (70.3) |
Reference |
Reference |
Reference |
Reference |
||||
TC |
16 (7.5) |
43 (17.7) |
36 (16.4) |
35 (17.2) |
76 (27.9) |
0.4 (0.3-0.6) |
<0.0001 |
2.6 (1.4-5.0) |
0.002 |
2.6 (1.3-5.0) |
0.005 |
2.0 (1- 4.4) |
0.048 |
CC |
6 (2.9) |
2 (0.8) |
6 (2.7) |
6 (3.0) |
5 (1.8) |
1.1 (0.4 -3.0) |
0.89 |
0.4 (0.1-2.0) |
0.2 |
0.9 (0.2-3.1) |
0.8 |
1.2 (0.3 - 5.3) |
0.8 |
P for trend |
1.99 |
0.12 |
0.046 |
0.026 |
|||||||||
Allele |
|||||||||||||
T |
396 (93.4) |
439 (90.3) |
392 (89) |
359 (88.4) |
458 (84.2) |
Reference |
Reference |
Reference |
Reference |
||||
C |
28 (6.6) |
47 (9.7) |
48 (11) |
47 (11.6) |
86 (15.8) |
0.6 (0.4-0.8) |
<0.0001 |
1.6 (0.9-2.6) |
0.07 |
1.7 (1.1-2.9) |
0.046 |
1.7 (0.9-3.0) |
0.09 |
Dominant |
|||||||||||||
TT |
190 (89.6) |
198 (81.5) |
178 (80.9) |
162 (79.8) |
191 (70.3) |
Reference |
Reference |
Reference |
Reference |
||||
TC & CC |
22 (10.4) |
45 (18.5) |
42 (19.1) |
41 (20.2) |
81 (29.7) |
0.5 (0.3-0.7) |
<0.0001 |
2.0 (1.1-3.7) |
0.014 |
2.0 (1.1-3.8) |
0.017 |
1.9 (1.1-3.7) |
0.046 |
Recessive |
|||||||||||||
TT & TC |
206 (97.2) |
241 (99.2) |
214 (97.3) |
197 (79.8) |
267 (98.2) |
Reference |
Reference |
Reference |
Reference |
||||
CC |
6 (2.9) |
2 (0.8) |
6 (2.7) |
6 (3.0) |
5 (1.8) |
1.3 (0.5-3.7) |
0.64 |
0.3 (0.1-1.8) |
0.2 |
0.8 (0.2-2.8) |
0.7 |
1.1 (0.3-5.3) |
0.8 |
P for trend |
0.058 |
0.059 |
0.55 |
0.33 |
|||||||||
rs12953258 |
|||||||||||||
CC |
94 (44.3) |
88 (36.2) |
86 (39.1) |
75 (36.9) |
101 (37.1) |
Reference |
Reference |
Reference |
Reference |
||||
AC |
72 (34) |
88 (36.2) |
88 (40) |
84 (41.4) |
140 (51.5) |
0.7 (0.5-0.98) |
<0.0001 |
1.3 (0.8-2.0) |
0.27 |
1.34 (0.8-2.2) |
0.21 |
1.4 (0.8-2.4) |
0.22 |
AA |
46 (21.7) |
67 (27.6) |
46 (20.9) |
44 (21.7) |
31 (11.4) |
2.0 (1.3-3.2) |
<0.0001 |
1.7 (1.02-2.8) |
0.036 |
1.0 (0.6-1.7) |
0.96 |
1.4 (0.7-2.7) |
0.26 |
Allele |
|||||||||||||
C |
260 (61.3) |
264 (54.3) |
260 (59.1) |
172 (42.4) |
342 (62.9) |
Reference |
Reference |
Reference |
Reference |
||||
A |
164 (38.7) |
222 (45.7) |
180 (40.9) |
234 (57.6) |
202 (37.1) |
1.3 (1.1-1.6) |
0.03 |
1.4 (1.1-1.9) |
0.017 |
0.9 (0.7 - 1.2) |
0.87 |
1.3 (0.9-1.8) |
0.15 |
Dominant |
|||||||||||||
CC |
94 (44.3) |
88 (36.2) |
86 (39.1) |
75 (36.9) |
101 (37.1) |
Reference |
Reference |
Reference |
Reference |
||||
AC & AA |
118 (55.7) |
155 (63.8) |
134 (60.9) |
128 (63.1) |
171 (62.9) |
1.0 (0.7-1.3) |
0.72 |
1.45 (0.9-2.2) |
0.07 |
1.2 ( 0.8-1.8) |
0.38 |
1.4 (0.8-2.3) |
0.16 |
Recessive |
|||||||||||||
CC & AC |
166 (78.3) |
176 (72.4) |
174 (79.1) |
159 (78.3) |
241 (88.6) |
Reference |
Reference |
Reference |
Reference |
||||
AA |
46 (21.7) |
67 (27.6) |
46 (20.9) |
44 (21.7) |
31 (11.4) |
2.4 (1.6-3.7) |
<0.0001 |
1.5 (0.9-2.4) |
0.08 |
0.9 (0.5-1.5) |
0.61 |
1.2 (0.7-2.1) |
0.47 |
Abbreviations: CHB: Chronic hepatitis B; LC: Liver cirrhosis; HCC: Hepatocellular carcinoma; HC: Healthy control; Cases = all HBV infected patients; n= Number of chromosomes; OR: adjusted Odd Ratio; ORs and P values were calculated by using binary logistic regression model adjusted for age and gender. P for trend was calculated by Cochran-Armitage test. Bold values present the statistical significance.
Subsequently, we compared the genotype and allele frequencies between different subgroups of HBV patients. The genotype rs12953258AA was significantly more frequent in LC patients compared to CHB patients (OR=1.7, 95%CI=1.02-2.8; adjusted P=0.036). The genotype rs111033850TC was also significantly more frequent in LC, HCC and HCC+LC groups compared to CHB patients (LC vs. CHB: OR=2.6, 95%CI=1.4-5.0, adjusted P=0.002; HCC vs. CHB: OR=2.6, 95%CI=1.3-5.0, adjusted P=0.005; LC+HCC vs. CHB: OR=2.0, 95%CI=1-4.4, adjusted P=0.048). The alleles rs111033850C and rs12953258A were more frequent in HCC and in LC patients compared to CHB patients, respectively (OR=1.7, 95%CI=1.1-2.9, adjusted P=0.046 and OR=1.4, 95%CI=1.1-1.9, adjusted P=0.017).
We also observed the gene dose effect of the allele rs111033850C when compared CHB with HCC and HCC+LC groups (P for trend =0.046 and 0.026, respectively). This indicate that the allele rs111033850C was associated with an increased risk of HCC and that the allele rs12953258A was associated an increased risk of LC in CHB patients. There were no significant differences when comparing the genotype and allele frequencies of the two SOCS3 SNPs in LC and HCC groups with HCC+LC group.
SOCS3 promoter haplotypes and HBV-related liver diseases
The haplotypes were reconstructed based on the two SNPs (rs111033850T/C, rs12953258C/A) and the frequencies were presented in Table 4. Haplotype CC was found more frequently in HCs compared to HBV patients (OR=0.5, 95%CI=0.4-0.75, adjusted P=0.001) indicating that this haplotype contributes to a decreased risk of HBV infection. We further compared haplotype frequencies between different subgroups of HBV patients and observed that the frequencies of haplotypes TA and CC were significantly higher in LC, HCC and patients with both LC and HCC compared to CHB patients (P<0.01) (Table 4). This result indicates that the haplotypes TA and CC contribute to an increased risk of progression to LC and HCC in HBV patients. However, no significant difference was observed when haplotype frequencies of LC and HCC patients were compared.
Table 4: Association of SOCS3 haplotypes with HBV-related liver diseases
SOCS3 |
HC |
CHB |
LC |
HCC |
HCC+LC |
Cases vs. HC |
LC vs. CHB |
HCC vs. CHB |
HCC+LC vs. CHB |
||||
|---|---|---|---|---|---|---|---|---|---|---|---|---|---|
n=544 |
n= 424 |
n= 486 |
n= 440 |
n= 406 |
OR (95%CI) |
P |
OR (95%CI) |
P |
OR (95%CI) |
P |
OR (95%CI) |
P |
|
TC |
256 (47.0) |
244 (57.5) |
216 (44.4) |
204 (46.4) |
196 (48.3) |
Reference |
Reference |
Reference |
Reference |
||||
TA |
194 (35.7) |
154 (36.3) |
228 (46.9) |
186 (42.3) |
162 (39.9) |
1.2 (0.9-1.5) |
0.17 |
1.89 (1.4-2.54) |
0.0001 |
1.46 (1.1 - 2.0) |
0.017 |
1.49 (1.1-2.13) |
0.026 |
CC |
92 (16.9) |
24 (5.7) |
42 (8.7) |
46 (10.5) |
46 (11.3) |
0.5 (0.4 - 0.8) |
0.001 |
2.1 (1.2-3.9) |
0.008 |
2.76 (1.5 -5) |
0.001 |
2.49 (1.3-4.8) |
0.007 |
CA |
2 (0.4) |
2 (0.5) |
0 (0) |
4 (0.9) |
2 (0.5) |
0.9 (0.2 - 4.8) |
0.96 |
NA |
NA |
1.89 (0.4-11.6) |
0.49 |
1.47 (0.1 - 17) |
0.75 |
Abbreviations: CHB: Chronic hepatitis B; LC: Liver cirrhosis; HCC: Hepatocellular carcinoma; HC: Healthy control; Cases = all HBV infected patients; n= Number of chromosomes; NA: not applicable; OR: Adjusted Odd Ratio; ORs and P values were calculated by using binary logistic regression model adjusted for age and gender. Bold values present the statistical significance.
SOCS3 promoter variants and clinical parameters
The HBV loads were lower in HBV patients with rs111033850CC compared to those with rs111033850TT and rs111033850TC (P=0.034). In contrast, viral loads were higher in HBV patients with rs12953258AA compared to those with rs12953258CC and rs12953258AC (P=0.029) (Figure 1A and 1C). To further examine this possible association, we compared HBV loads according to different genotypes for each SNP in the subgroups of HBV patients. A similar trend of HBV loads was observed in HCC+LC group for rs111033850 (P=0.045) and in LC group for rs12953258 (P=0.039) (Figure 1B and 1D). However, there was no significant association of these SNPs with clinical parameters: ALT, AST, total and direct bilirubin, albumin, prothrombin, platelet counts and AFP (P>0.05) (Supplementary Figure 1 and 2). In addition, we also compared clinical parameters according to different haplotypes however we did not observe any significant association of SOCS3 promoter haplotypes with laboratory parameters.
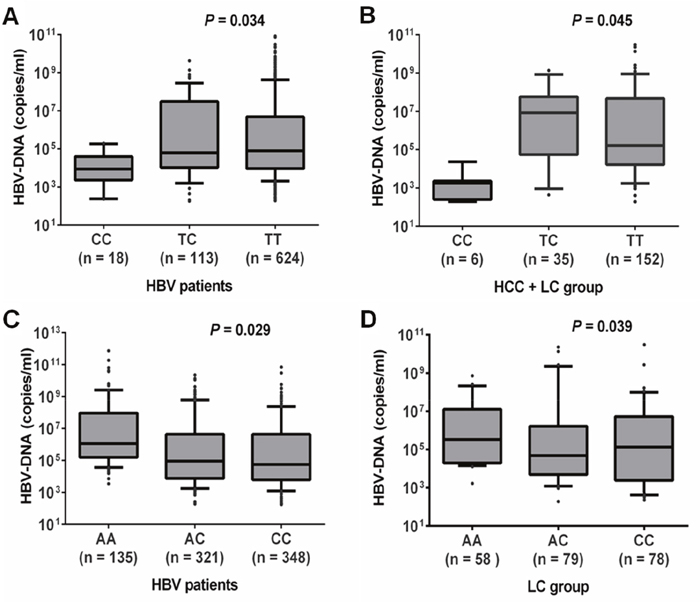
Figure 1: Association of HBV loads with SOCS3 SNPs. A. and B. HBV viral loads according to different genotypes of SNP rs111033850T/C in all HBV patients and in patients with both liver cirrhosis and hepatocellular carcinoma, respectively. C. and D. HBV loads according to different genotypes of SNP rs12953258C/A in all HBV patients and in patients with liver cirrhosis, respectively. Box-plots illustrate medians with 25 and 75 percentiles with whiskers to 10 and 90 percentiles; P values were calculated by Krusskal-Wallis test.
Methylation status of SOCS3 promoter region in primary HCCs
In total, 127 CpG islands in the fragment of 1150 bp (-1091 through +60) in the SOCS3 promoter region were investigated. We found that CpG islands were unmethylated in the fragment 1 (-1091 through -679) while were hypermethylated in the fragment 2 (-425 through -217) and in the fragment 3 (-140 through -28) (Figure 2 and 3A). Subsequently, we analyzed methylation status in the SOCS3 promoter in 37 pairs of tissue samples (tumor and adjacent non-tumor tissues). We observed that the SOCS3 promoter region was methylated in 26/37 (70.3%) liver tumor tissues while only in 11/37 (29.7%) adjacent non-tumor tissues showed methylation patterns (OR=5.4, 95%CI=1.9-17.1, P=0.0011) (Figure 3A). This result indicates that SOCS3 promoter methylation occurs more frequently in tumor tissues compared to adjacent non-tumor tissues. In addition, we analyzed the intensity of SOCS3 promoter methylation in 11 pairs of tissue samples, in which SOCS3 promoter methylation was detected in both tumor and adjacent non-tumor tissues. We observed that the methylation intensity was higher in tumor tissues compared to adjacent non-tumor tissues (P=0.012) (Figure 3B). In addition, we compared the status and intensity of SOCS3 promoter methylation between tissue samples (tumor and non-tumor) with and without HBV infection. However, no statistical significance was observed.
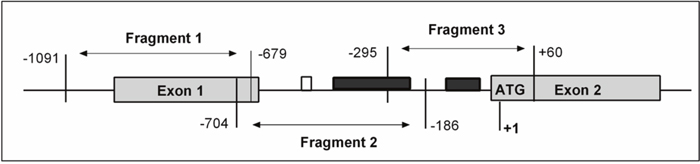
Figure 2: Schematic structure of SOCS3 gene presenting the location of CpG island. Methylation status of SOCS3 promoter region was analyzed by bisulfite sequencing (BS). The start codon site for SOCS3 gene is defined as +1. The shaded boxes depict the exons of the SOCS3 gene and open box represents the reported STAT3-binding site and the black boxes represent the region with aberrant methylation in the fragments 2 and 3.
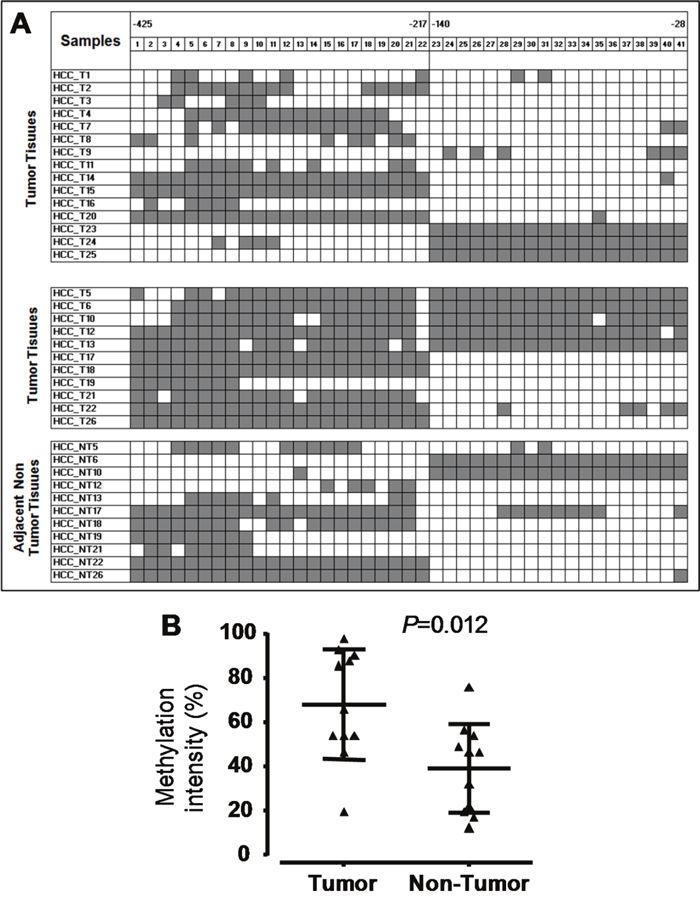
Figure 3: Methylation status of the SOCS3 CpG islands in the promoter region. A. Methylation status of HCC tumor and non-tumor tissues. We randomly sequenced five to eight clones of PCR products amplified from Bisulfite treated genomic DNA for each liver tissue sample. The highly methylated CpG islands were found in two regions (from positions -425 to -217 and from positions -140 to -28). Each square shape presents one CpG island, black color shows CpG islands with methylation and white color shows CpG islands without methylation. B. Methylation intensity of the 11 HCC tumor and 11 adjacent non-tumor tissue samples. P values were calculated by Mann-Whitney test.
SOCS3 mRNA expression in primary HCCs
The mean levels of SOCS3 mRNA expression did not differ significantly between tumor and non-tumor tissues (Figure 4A and Supplementary Figure 3). The hypermethylated tumor tissues had significantly decreased SOCS3 mRNA expression than non hypermethylated tumor tissues (P=0.0023). However, there were no significant differences in SOCS3 mRNA expression between hypermethylated tumor and non-tumor liver tissues. (Figure 4B and Supplementary Figure 3). Our data demonstrate that the hypermethylation status in the SOCS3 promoter is associated with downregulation of the SOCS3 mRNA expression in tumor tissues.
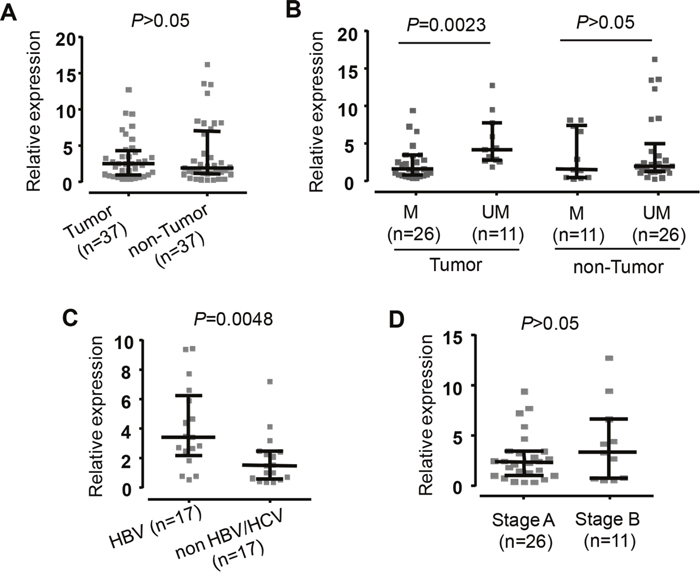
Figure 4: Expression of SOCS3 mRNA in liver specimens from HCC patients. Quantitative real-time PCR (qRT-PCR) analysis presents comparison of SOSC3 mRNA level. A. The SOSC3 mRNA level in the tumor tissues and adjacent non-tumor tissues. B. The SOSC3 mRNA level in the tumor and in non-tumor tissues with methylation (M) and in the tumor and in non-tumore tissues with un-methylation (UM). C. The SOSC3 mRNA level in patients positive for HBV and in patients negative for both HBV and HCV. D. The SOSC3 mRNA level in patients at early HCC stage (Stage A) and in patients at intermediate HCC stage (Stage B). The GAPDH gene was used as a reference gene. The data are shown as the medians with inter-quartile range. P values were calculated by Mann-Whitney test.
SOCS3 mRNA expression discriminating between HCC and non-HCC tissue samples showed that SOCS3 mRNA expression was significantly higher in HBV-related HCC tissues compared to non-HBV-related HCC tissues (P=0.0048) (Figure 4C and Supplementary Figure 3). In order to examine whether SOCS3 mRNA expression was associated with the development of liver cancer, we analyzed SOCS3 mRNA expression according to the BCLC staging classification. However, SOCS3 mRNA expression was not different between stage A and B HCC tissues (Figure 4D and Supplementary Figure 3).
DISCUSSION
The negative regulator SOCS3 is a key player in the modulation of the JAK/STAT signaling that control a number of inflammatory cytokines such as IL6 and IL16 [6] and is involved in infectious diseases and cancers [13, 14]. In addition, gene silencing mediated by aberrant methylation of CpG islands in the SOCS3 promoter frequently occurs in malignancies [16, 21]. In this study, we investigated the possible association of SOCS3 promoter variants with the progression of HBV-related liver diseases and SOCS3 methylation with HBV-induced HCC. We showed that the SOCS3 promoter variants are associated with HBV infection and HBV-related liver diseases. SOCS3 mRNA expression was higher in tumor tissues infected with HBV than non-infected tumor tissues. The aberrant methylation of the CpG islands in the SOCS3 promoter is associated with relatively low mRNA expression in tumor tissues.
This first study reports on the association of SOCS3 variants with HBV susceptibility and progression of HBV-related liver diseases. We have shown that the variants rs111033850T/C and rs12953258C/A are associated with HBV infection and the progression of HBV-related liver diseases. Particularly, the variant rs111033850T/C shows a heterozygous advantage in HBV susceptibility but might be a risk factor for the disease progression. The contribution of the minor allele rs111033850C to the increased risk of HCC in CHB patients is through the gene dose manner. In studies on hepatitis C, the rs4969170AA genotype was associated with antiviral IFN-α resistance with increased SOCS3 expression in HCV patients [14, 18]. The rs4969170A/G polymorphism was associated with HCV treatment-induced neutropenia and thrombocytopenia in antiviral therapy with pegylated interferon alpha [17]. The rs4969170A/G polymorphism was associated with clinical features and prognosis of HCC after surgical treatment [22]. Our results support earlier findings that SOCS3 polymorphisms influence liver disease progression by modulating the SOCS3 protein expression and thus down-regulate the JAK/STAT signaling.
In this study, we showed that HBV-DNA loads were associated with the SOCS3 promoter polymorphisms rs111033850T/C and rs12953258C/A. The HBV-DNA loads are an important and independent risk factor for liver disease progression in CHB patients [23, 24]. The effects of HBV replication during HBV persistence were regulated by many host factors [25]. Previous studies have shown that the control of HBV replication was regulated by JAK/STAT signaling, which is activated by IFNs [15, 26, 27]. IFNs play a central role in control of viral replication including HBV [28] and IFNs are controlled by JAK/STAT signaling, which is regulated by SOCS3 protein [9]. Therefore, SOCS3 promoter variants might have contributed to control of HBV replication through IFN signaling, which is also regulated by JAK/STAT signaling. However, the effects of SOCS3 and its variants on the cytokine signaling that subsequently influence the HBV replication are required further studies.
Cytokines are involved in cell communication and are required for the defense against hepatitis viruses [28]. Previous study has shown that the HCV core protein impairs IFN-α-induced signal transduction via induction of SOCS3 expression [29] and therefore influences the outcome of antiviral therapy [30]. SOCS3 was overexpressed in liver tissues and was strongly associated with severity of hepatic inflammation in CHB patients [15, 27]. In accordance, SOCS3 overexpression was observed in liver tissues from HBV-infected patients rather than non-HBV patients. These results may indicate that HBV can induce SOCS3 expression, which in turn inhibits IFN signaling transduction resulting in the progression of liver diseases and failure of IFN treatment of HBV infection [27].
HCC development is often due to chronic liver injury, inflammation, and cirrhosis caused by the persistence of HBV infection. However, the interaction between HBV and SOCS3 in infected hepatocytes has not been clearly understood. DNA hypermethylation in the promoter region can lead to the silence of SOCS3 in HCC [16, 31]. SOCS3 silencing by promoter methylation is possibly involved in the progression of HBV-related liver cancer. In line with previous studies, our results showed that aberrant methylation in the SOCS3 promoter region was observed more frequently in tumor tissues compared to adjacent non-tumor tissues. Hypermethylation status in the SOCS3 promoter region may be a crucial factor for HCC development. However, SOCS3 expression in tumor and adjacent non-tumor tissues was not significantly different, suggesting that other factors such as phosphorylation, acetylation and microRNAs may also involve in the regulation of SOCS3 expression during progression of liver diseases [32]. In addition, both SOCS3 methylation status and intensity were not significantly different between tissue samples (tumor and non-tumor) from patients with and without HBV infection. This indicates that HBV may not promote DNA methylation of host genes in infected hepatocytes. However, further studies are needed to verify this preliminary observation since the number of samples used for this analysis was rather small.
Although our data indicate that SOCS3 expression is associated with HBV infection and may involve in the progression of HBV-related liver diseases, the study has several limitations. A limited number of HCC tumor and non-tumor tissues were utilized. Due to the study design as a case-control study, SOCS3 expression over the course of HBV infection were not assessed longitudinally and therefore the causative effect of SOCS3 expression on progression of HBV-related liver diseases could not conclusively be determined. The insufficiency of some clinical and laboratory parameters such as HBV serology tests and HBV genotypes may weaken the findings indicating the crucial role of SOCS3 in the immune response to HBV infection and the disease outcomes.
In conclusion, the SOCS3 promoter variants rs111033850 and rs12953258 are associated with HBV infection and HBV-related liver diseases. DNA methylation in the SOCS3 promoter region is related to the regulation of SOCS3 expression and occurs frequently in HCC tumors of HBV-infected patients. Our study suggests that SOCS3 polymorphisms and methylation play an important role in regulation of SOCS3 expression and thus influences the progression of HBV-related liver diseases.
MATERIALS AND METHODS
Patients and liver specimens
878 unrelated Vietnamese HBV-infected patients were randomly recruited in a case-control design at 108 Military Central Hospital and 103 Military Hospital of the Vietnam Military Medical University, Hanoi, Vietnam, between 2012 and 2013. With this sample size, we can detect the significance of common studied SOCS3 variants according to the sample size estimation based on the 95% confidence interval, the lowest detection rate of minor allele set at the lowest value of 5%, a significance level of 5% and a power >90%. Patients were assigned to subgroups of disease based on clinical manifestations and liver function tests. Subgroups included chronic hepatitis (CHB, n=212), liver cirrhosis (LC, n=243), hepatocellular carcinoma (HCC, n=220) and patients with LC and HCC (LC+HCC, n=203). The diagnostic criteria for the CHB patients and the HBV-related LC were previously described [33]. The HBV-related HCC group was characterized as patients infected with HBV and was diagnosed based on the American Association for the Study of Liver Diseases (AASLD) practice guideline for HCC [34]. The patients with LC and HCC were characterized if the patients showed clinical manifestations and laboratory tests of both LC and HCC. The patients with LC were also categorized as Child-A, Child-B and Child-C based on Child-Pugh scores [35]. None of these HBV-infected patients had a history of alcohol or drug abuse. All participants were confirmed negative for anti-HCV and anti-HIV by ELISA assays. HBV-DNA loads and liver function tests including alanine transaminase (ALT), aspartate transaminase (AST), total bilirubin and direct bilirubin, albumin, prothrombin were quantified. 272 blood samples from healthy individuals were collected from blood bank as the control group. In addition, we analyzed 37 dyads of liver specimens (tumor and adjacent non-tumor) collected from HCC patients who underwent surgery at the 108 Military Central Hospital between 2013 and 2014. The HCC patients who underwent surgery were independent from 878 HBV patients. HCC was confirmed by histology and classified based on the BCLC classification [36]. All specimens were frozen at -80°C until use.
Ethics statement
Informed written consent was obtained after explanation of the study at the time of sampling from all participants. The study was approved by the institutional review board of the 108 Military Central Hospital and the 103 Military Hospital of the Vietnam Military Medical University, Hanoi, Vietnam.
Genotyping of SOCS3 promoter variants
Genomic DNA was isolated from blood using DNA purification kits (Qiagen, Hilden, Germany). The SOCS3 promoter region (nucleotides -1109 to -772) including two pre-described SNPs (rs111033850 and rs12953258) were amplified by PCR using primer pair SOCS3_PrF and SOCS3_PrR (Supplementary Table 1). PCR components, thermal conditions and sequencing procedures are presented in the Supplementary Materials.
SOCS3 promoter methylation analysis
Liver tissues were grounded using liquid nitrogen. Genomic DNA was extracted from liver powder using DNA purification kit (Qiagen, Hilden, Germany). Extracted DNA (2μg) was subjected to bisulfite conversion using EZ DNA Methylation-Direct™ Kit (Zymo Research Corp, the USA), according to the manufacturer’s protocol. Three different fragments were amplified from bisulfite-treated genomic DNA using three specific primer sets (Figure 2 and Supplementary Table 1). The PCR products were subsequently cloned into TOPO-TA pCR2.1 vector (Life Technologies, the USA). Eight clones were randomly picked from each transformation (each tissue sample) and were analyzed for methylation by direct sequencing.
SOCS3 mRNA expression
Total RNA was extracted from 37 dyads of liver biopsy tissues with Trizol reagent (Life Technologies, the USA). RNA was reverse transcribed into cDNA using QuantiTect Reverse Transcription Kit (Qiagen GmbH, Hilden, Germany). cDNA quantification was performed by qRT-PCR and GAPDH (glyceraldehyde-3-phosphate dehydrogenase) gene was used as a reference gene. The specific primers used for evaluating SOCS3 mRNA expression as well as the PCR components and thermal conditions of qRT-PCR are presented in the Supplementary Materials. Calculation of normalized gene expression was based upon the ΔΔCT method.
Statistical and genetic analysis
All statistical analysis was performed using R version 3.1.2 (http://www.r-project.org) and GraphPad Prism 6 (http://www.graphpad.com). Genotype and allelic frequencies were determined by simple gene counting and the haplotype frequency was estimated using the expectation-maximum algorithm method implemented in the Arlequin v.3.5.2.2. The deviations from Hardy-Weinberg equilibrium were calculated for each group. We used a binary logistic regression adjusted for age and gender to analyze association of SOCS3 variants with HBV-related liver diseases applying for different genetic models. In the binary logistic regression model, the disease subgroups and control group are considered as dependent variables. The genetic data are considered as independent variables (predictors) while age (treated as a continuous variable) and gender (treated as a binary variable) are independent confounding factors. In addition, the Cochran-Armitage test for trend was used to examine the gene dose effect of risk allele. Fisher’s exact test was used to test the difference of categorical variables between two groups. Student's t-test and Mann Whitney Wilcoxon test were used to compare the parametric and non-parametric data of quantitative variables between two groups, respectively. Kruskal-Wallis test was used to compare non-parametric data of quantitative variables among more than two groups. The level of significance was set at a value of P< 0.05.
Abbreviations
CHB, chronic hepatitis B; HBV, hepatitis B virus; HC, healthy control; HCC, hepatocellular carcinoma; LC, liver cirrhosis; SNP, single nucleotide polymorphism; SOCS3, suppressor of cytokine signaling-3.
ACKNOWLEDGEMENTS
We thank all study subjects for their participation. We acknowledge Marisa Diehl, Nina Eiermann, and Kristin Patzwaldt for experimental helps and Le Duc Anh, Nguyen Viet Ha during sampling.
CONFLICTS OF INTEREST
All authors have no conflicts of interest to declare.
FINANCIAL SUPPORT
This study was supported from DAAD-PAGEL (57140033) for student fellowship. The authors greatly acknowledges the support by the Deutsche Forschungsgemeinschaft (DFG) and Open Access Publishing Fund of Tuebingen University. The funder has no role in the study design, data collection and analysis, decision to publish or preparation of the manuscript.
Author’s contributions
NXH, HVT, CTB, HW and TPV designed the study and wrote the manuscript. NXH, HVT, and DPG performed the experiments and contributed equally to this work. NXH and HVT performed the statistical analyses and interpreted data. NXH, LHS, NLT and BKC recruited patients and collected samples. PGK and TPV contributed to materials and reagents. All authors agreed with the results and conclusions.
REFERENCES
1. WHO. Hepatitis B. 2015. Report No.: Fact sheet N°204.
2. Liu J, Fan D. Hepatitis B in China. Lancet. 2007; 369:1582-3.
3. El-Serag HB. Hepatocellular carcinoma. N Engl J Med. 2011; 365:1118-27.
4. Rehermann B, Bertoletti A. Immunological aspects of antiviral therapy of chronic hepatitis B virus and hepatitis C virus infections. Hepatology. 2015; 61:712-21.
5. Carow B, Rottenberg ME. SOCS3, a Major Regulator of Infection and Inflammation. Front Immunol. 2014; 5:58.
6. Yoshimura A, Naka T, Kubo M. SOCS proteins, cytokine signalling and immune regulation. Nat Rev Immunol. 2007; 7:454-65.
7. Chang J, Block TM, Guo JT. The innate immune response to hepatitis B virus infection: implications for pathogenesis and therapy. Antiviral Res. 2012; 96:405-13.
8. Chang JJ, Lewin SR. Immunopathogenesis of hepatitis B virus infection. Immunol Cell Biol. 2007; 85:16-23.
9. Kubo M, Hanada T, Yoshimura A. Suppressors of cytokine signaling and immunity. Nat Immunol. 2003; 4:1169-76.
10. Yu H, Kortylewski M, Pardoll D. Crosstalk between cancer and immune cells: role of STAT3 in the tumour microenvironment. Nat Rev Immunol. 2007; 7:41-51.
11. Jiang R, Tan Z, Deng L, Chen Y, Xia Y, Gao Y, Wang X, Sun B. Interleukin-22 promotes human hepatocellular carcinoma by activation of STAT3. Hepatology. 2011; 54:900-9.
12. Yu H, Pardoll D, Jove R. STATs in cancer inflammation and immunity: a leading role for STAT3. Nat Rev Cancer. 2009; 9:798-809.
13. Yoshimura A, Suzuki M, Sakaguchi R, Hanada T, Yasukawa H. SOCS, Inflammation, and Autoimmunity. Front Immunol. 2012; 3:20.
14. Persico M, Capasso M, Russo R, Persico E, Croce L, Tiribelli C, Iolascon A. Elevated expression and polymorphisms of SOCS3 influence patient response to antiviral therapy in chronic hepatitis C. Gut. 2008; 57:507-15.
15. Koeberlein B, zur HA, Bektas N, Zentgraf H, Chin R, Nguyen LT, Kandolf R, Torresi J, Bock CT. Hepatitis B virus overexpresses suppressor of cytokine signaling-3 (SOCS3) thereby contributing to severity of inflammation in the liver. Virus Res. 2010; 148:51-9.
16. Niwa Y, Kanda H, Shikauchi Y, Saiura A, Matsubara K, Kitagawa T, Yamamoto J, Kubo T, Yoshikawa H. Methylation silencing of SOCS-3 promotes cell growth and migration by enhancing JAK/STAT and FAK signalings in human hepatocellular carcinoma. Oncogene. 2005; 24:6406-17.
17. Vidal F, Lopez-Dupla M, Laguno M, Veloso S, Mallolas J, Murillas J, Cifuentes C, Gallart L, Auguet T, Samperiz G, Payeras A, Hernandez P, Arnedo M, et al. Pharmacogenetics of efficacy and safety of HCV treatment in HCV-HIV coinfected patients: significant associations with IL28B and SOCS3 gene variants. PLoS One. 2012; 7:e47725.
18. Zheng YY, Wang LF, Fan XH, Wu CH, Huo N, Lu HY, Xu XY, Wei L. Association of suppressor of cytokine signalling 3 polymorphisms with insulin resistance in patients with chronic hepatitis C. J Viral Hepat. 2013; 20:273-80.
19. Fischer-Rosinsky A, Fisher E, Kovacs P, Bluher M, Mohlig M, Pfeiffer AF, Boeing H, Spranger J. Lack of association between the tagging SNP A+930–>G of SOCS3 and type 2 diabetes mellitus: meta-analysis of four independent study populations. PLoS One. 2008; 3:e3852.
20. Igci M, Cakmak EA, Oztuzcu S, Bayram A, Arslan A, Gogebakan B, Igci YZ, Cengiz B, Ozkara E, Camci C, Demiryurek AT. Mutational screening of the SOCS3 gene promoter in metastatic colorectal cancer patients. Genet Test Mol Biomarkers. 2012; 16:1395-400.
21. He B, You L, Uematsu K, Zang K, Xu Z, Lee AY, Costello JF, McCormick F, Jablons DM. SOCS-3 is frequently silenced by hypermethylation and suppresses cell growth in human lung cancer. Proc Natl Acad Sci U S A. 2003; 100:14133-8.
22. Jiang BG, Yang Y, Liu H, Gu FM, Yang Y, Zhao LH, Yuan SX, Wang RY, Zhang J, Zhou WP. SOCS3 Genetic Polymorphism Is Associated With Clinical Features and Prognosis of Hepatocellular Carcinoma Patients Receiving Hepatectomy. Medicine (Baltimore). 2015; 94:e1344.
23. Chen CJ, Yang HI, Iloeje UH. Hepatitis B virus DNA levels and outcomes in chronic hepatitis B. Hepatology. 2009; 49:S72-S84.
24. Zacharakis G, Koskinas J, Kotsiou S, Tzara F, Vafeiadis N, Papoutselis M, Maltezos E, Sivridis E, Papoutselis K. The role of serial measurement of serum HBV DNA levels in patients with chronic HBeAg(-) hepatitis B infection: association with liver disease progression. A prospective cohort study. J Hepatol. 2008; 49:884-91.
25. Levrero M, Pollicino T, Petersen J, Belloni L, Raimondo G, Dandri M. Control of cccDNA function in hepatitis B virus infection. J Hepatol. 2009; 51:581-92.
26. Robek MD, Boyd BS, Wieland SF, Chisari FV. Signal transduction pathways that inhibit hepatitis B virus replication. Proc Natl Acad Sci U S A. 2004; 101:1743-7.
27. Du LY, Cui YL, Chen EQ, Cheng X, Liu L, Tang H. Correlation between the suppressor of cytokine signaling-1 and 3 and hepatitis B virus: possible roles in the resistance to interferon treatment. Virol J. 2014; 11:51.
28. Koziel MJ. Cytokines in viral hepatitis. Semin Liver Dis. 1999; 19:157-69.
29. Bode JG, Ludwig S, Ehrhardt C, Albrecht U, Erhardt A, Schaper F, Heinrich PC, Haussinger D. IFN-alpha antagonistic activity of HCV core protein involves induction of suppressor of cytokine signaling-3. FASEB J. 2003; 17:488-90.
30. Persico M, Capasso M, Persico E, Svelto M, Russo R, Spano D, Croce L, La M, V, Moschella F, Masutti F, Torella R, Tiribelli C, Iolascon A. Suppressor of cytokine signaling 3 (SOCS3) expression and hepatitis C virus-related chronic hepatitis: Insulin resistance and response to antiviral therapy. Hepatology. 2007; 46:1009-15.
31. Zhang X, You Q, Zhang X, Chen X. SOCS3 Methylation Predicts a Poor Prognosis in HBV Infection-Related Hepatocellular Carcinoma. Int J Mol Sci. 2015; 16:22662-75.
32. Boosani CS, Agrawal DK. Methylation and microRNA-mediated epigenetic regulation of SOCS3. Mol Biol Rep. 2015; 42:853-72.
33. Song lH, Binh VQ, Duy DN, Juliger S, Bock TC, Luty AJ, Kremsner PG, Kun JF. Mannose-binding lectin gene polymorphisms and hepatitis B virus infection in Vietnamese patients. Mutat Res. 2003; 522:119-25.
34. Bruix J, Sherman M. Management of hepatocellular carcinoma: an update. Hepatology. 2011; 53:1020-2.
35. Cholongitas E, Papatheodoridis GV, Vangeli M, Terreni N, Patch D, Burroughs AK. Systematic review: The model for end-stage liver disease--should it replace Child-Pugh's classification for assessing prognosis in cirrhosis? Aliment Pharmacol Ther. 2005; 22:1079-89.
36. Llovet JM, Bru C, Bruix J. Prognosis of hepatocellular carcinoma: the BCLC staging classification. Semin Liver Dis. 1999; 19:329-38.