
Introduction
Public health events occurred frequently in China. Take 2013 as an example, a total of 1,077 public health emergencies occurred. [1] Analysis of these emergencies only focused on traditional epidemiological methods in the past. Field epidemiological investigation skill has been identified as one of the five top weaknesses in national health emergency response skills and techniques. [2] Traditional epidemiological methods do not consistently provide reliable evidence on how to objectively identify the correct patients, how to select correct sampling objects for laboratory tests, and how to understand and describe outbreak characteristics. [3, 4] Social network analysis (SNA) and global sensitivity and uncertainty analyses (GSUA) are relatively new tools that can be used to address these problems. [5, 6] Using SNA, nodes and ties represent patients and connections between them in network diagrams. Through centrality analysis and connectedness measurement, important patients could be identified, and the propagation of outbreaks could be more accurately described. [7-10] By using these network analysis and graphics, SNA could be used to study outbreak structures and characteristics. [5, 11, 12] GSUA is the study of how uncertainties in the output of a model can be apportioned to different sources of uncertainty among model inputs. It is a variance-based method for analyzing data and models using an objective function. [6, 13, 14] GSUA can be used to rank parameters such as infection coefficient, contact coefficient, recovery rate and death rate based on their relative influence on the dynamics of simulated epidemics. [15] It can also inform researchers on the dynamics of investigation processes, and can potentially play an important role in outbreak management.
From Wednesday, July 16, 2014, to Monday, August 4, 2014, an influenza A(H3N2) outbreak with 63 cases, including nine laboratory-confirmed positive cases, occurred in an isolated compulsory detoxification center. Yichang center for disease control and prevention managed the outbreak using traditional and molecular epidemiological methods, and reported it as a general public health emergency (grade IV) in the China Information System for Disease Control and Prevention.
Results
Selection of sampling objects
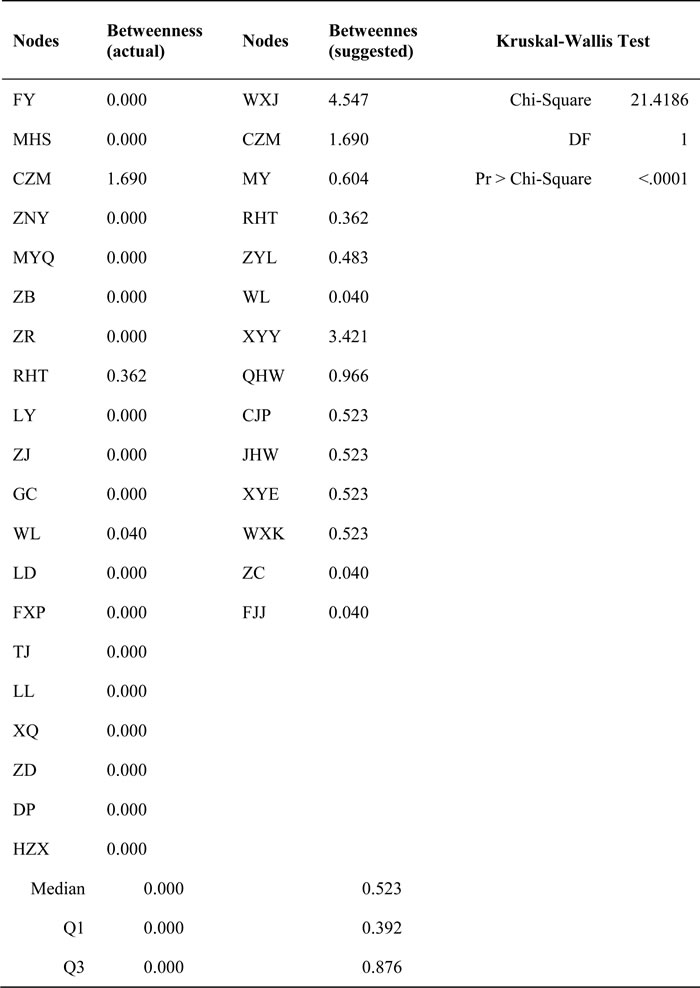
Normalized centrality measures (degree and betweenness) of all 72 index cases were analyzed using SNA (Table 1). A total of 14 nodes (six from platoon A; eight from platoon B), all with high values of degree and betweenness centrality, were suggested to be sampling objects (Tables 2 and 3). Kruskal-Wallis test results showed statistical significance in degree centrality (χ2 = 17.6619, P < 0.0001, Table 2) and betweenness centrality (χ2 = 21.4186, P < 0.0001, Table 3), showing the two selection methods (SNA approach and traditional method) of sampling objects to be significantly different.
Table 1: Statistics of normalized centrality measures of all 72 index cases
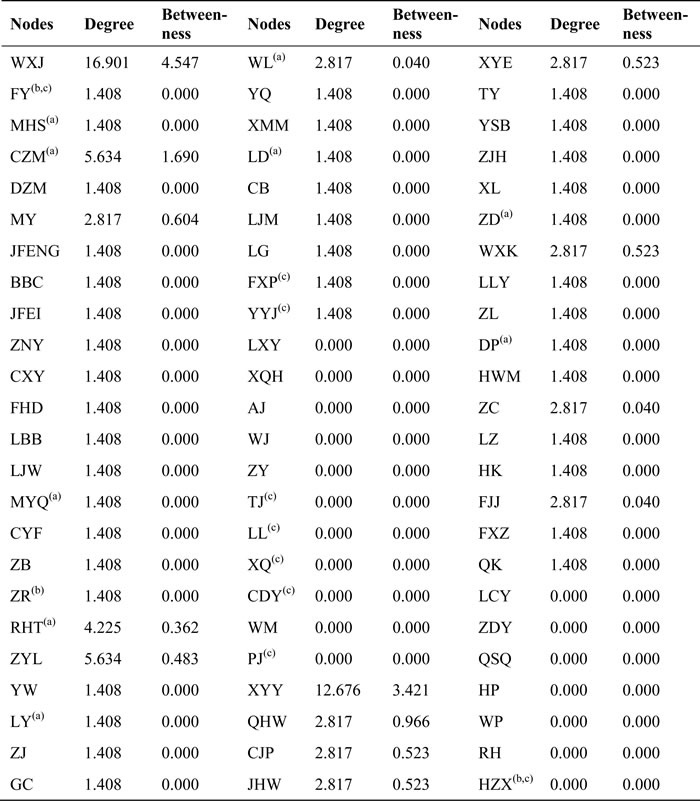
(a): laboratory test positive
(b): laboratory test negative
(c): excluded cases
Table 2: Comparison of the degree of sampling objects in actual outbreak and our retrospective study suggestion
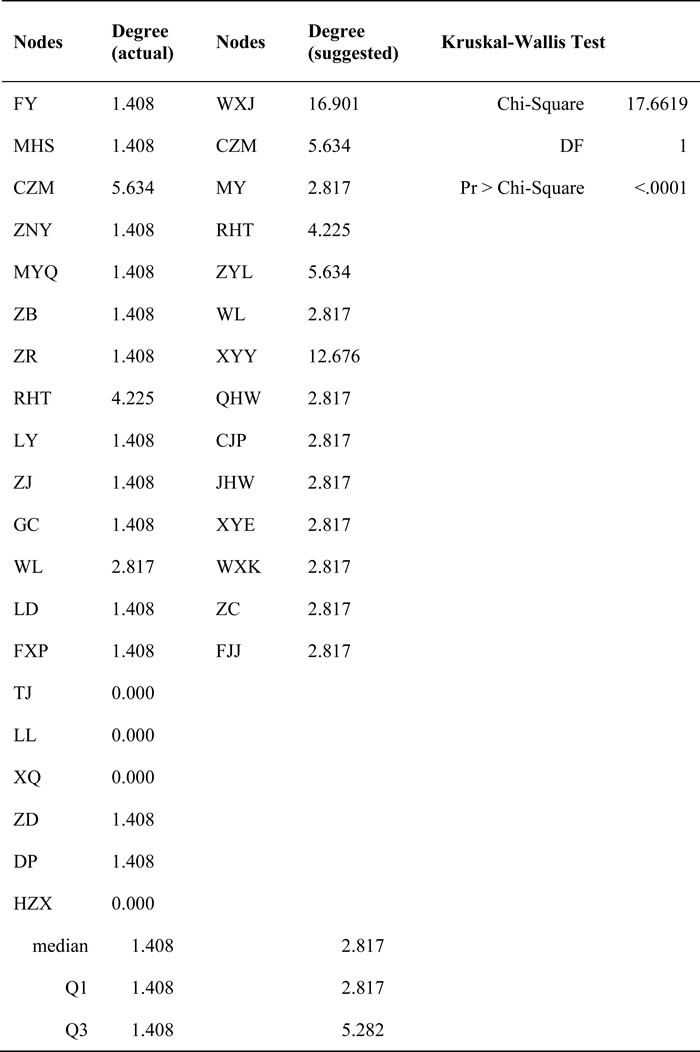
Table 3: Comparison of the betweenness of sampling objects in actual outbreak and our retrospective study suggestion
Outbreak characteristics
A total of 134 drug abstainers were strictly separated into two platoons; the 75 abstainers in platoon A resided on the second floor, and the other 59 abstainers in platoon B resided on the third floor. Each floor had its own workshop. The assigned exercise, work-break and dining areas were also separate. The mealtime of platoon A was 5 minutes earlier than that of platoon B. Therefore, there was no close contact between the two platoons. The resulting cliques also suggested that the epidemic situation may have contained two or more networks. Figure 1 demonstrates the cliques and structure of the networks. Figures 2 and 3 shows the schematic diagrams of the possible propagation chain of the two platoons.
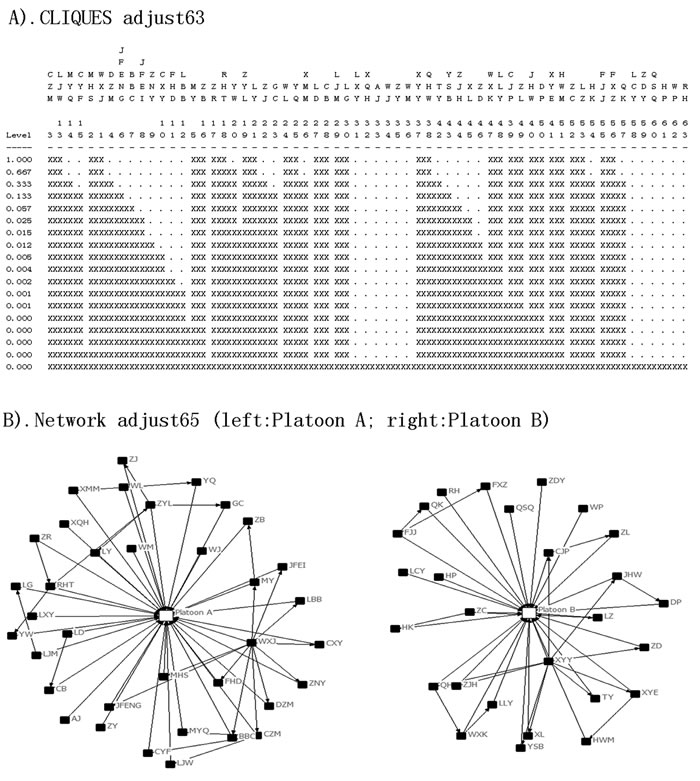
Figure 1: Diagrams of cliques and network structure, in an isolated compulsory detoxification center in Yichang City, Hubei Province, China, July to August 2014. A. The two clusters of the matrix Adjust63. B. The two independent structures of the networks.
Platoon A, which had 36 patients and 25 pairs of close contacts, was divided into eight classes. Class 1 consisted of 11 drug abstainers with five patients (represented as 11(5)). Similarly, classes 2 to 8 had compositions of 12(5), 11(4), 10(8), 10(3), 10(9), 6(2), and 5(0) abstainers and patients, respectively. The first case (patient WXJ) was reported on July 17, and there were 5, 12, 10, 5, 1 and 2 cases reported on each subsequent day thereafter. Platoon B had 27 patients with 18 pairs of close contacts and was divided into nine classes. Classes 1 to 9 contained 8(6), 8(3), 8(2), 6(4), 6(5), 7(3), 7(1), 5(2), and 4(1) abstainers and patients, respectively. The first case (patient XYY) was reported on July 16, and there were 11 cases reported on July 18, 13 cases on July 19, and two cases on July 20.
A total of 21 contacts were recorded in the dormitory, six in the refectory and eight in other places from platoon A, and 16 in the dormitory, three in the refectory and four in other places from platoon B (![]() = 0.5403, P = 0.7633). A total of 31 direct and six indirect contacts were found in platoon A, whereas 20 direct and 10 indirect contacts were found in platoon B. More direct contacts than indirect contacts were found among the patients, although the difference (χ2 = 2.6704, P = 0.1022) was not statistically significant.
= 0.5403, P = 0.7633). A total of 31 direct and six indirect contacts were found in platoon A, whereas 20 direct and 10 indirect contacts were found in platoon B. More direct contacts than indirect contacts were found among the patients, although the difference (χ2 = 2.6704, P = 0.1022) was not statistically significant.
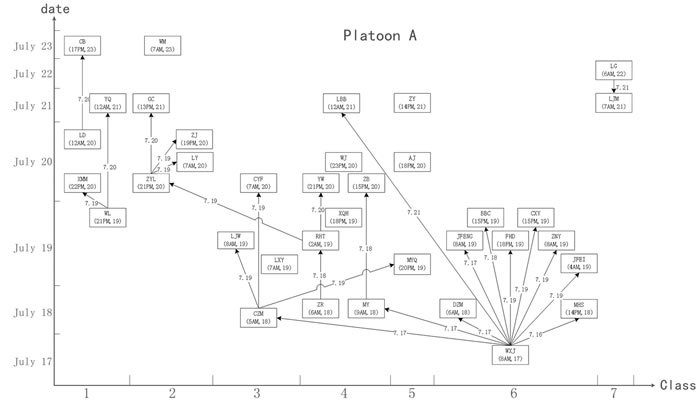
Figure 2: Schematic diagram demonstrate the possible propagation chain of platoon A. The patient’s name and date of onset (accurate to hours) are shown in the box. The possible route and date of propagation are represented as an arrow. The X axis represents the onset date. The Y axis represents the classes (dormitories) where the patients lived. WXJ was the key node among the 36 patients, and 7 of the 9 classes involved were in platoon A.
Global sensitivity and uncertainty analyses
Factor k (contact coefficient) was distributed as three different ranges. When distributed as k ~ beta (2, 7), the first-order indices of factors v, k and r were 0.4144, 0.4450, and 0.0002, respectively, and the total-order indices were 0.5549, 0.5855, and 0.0001, respectively. Other indices are shown in Table 4.
Figure 4 shows three cases of the infection dynamics exercise based on uncertainty analysis. The plot shows that the infection propagated in 97.19% (case 1), 66.80% (case 2), and 31.56% (case 3) of individuals in each case, respectively.
Table 4: First-order and total-order indices generated by sensitivity analysis
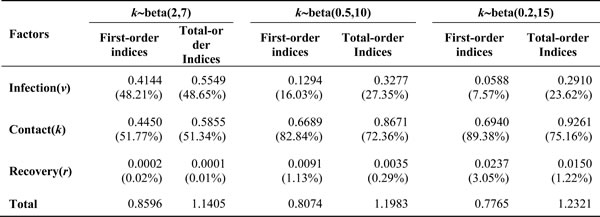
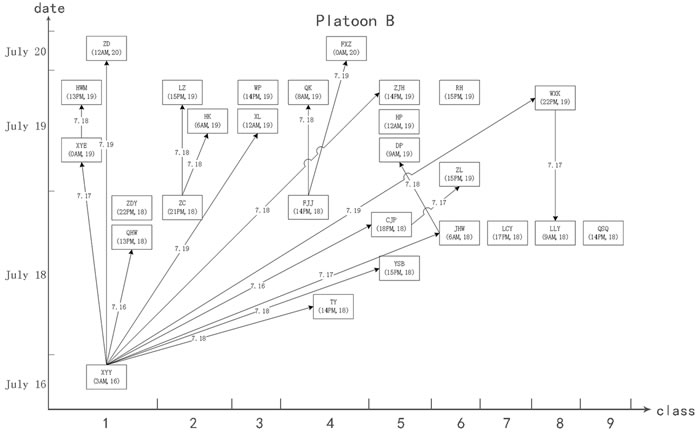
Figure 3: Schematic diagram demonstrate the possible propagation chain of platoon B. The patient’s name and date of onset (accurate to hours) are shown in the box. The possible route and date of propagation are represented as an arrow. The X axis represents the onset date. The Y axis represents the classes (dormitories) where the patients lived. XYY was the key node among the 27 patients, and all 9 classes in platoon B were involved.
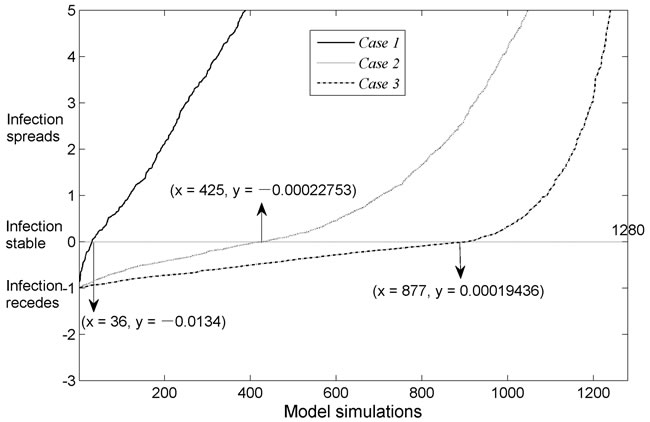
Figure 4: Uncertainty analysis shows infection dynamics for the three cases. Dynamic change of infection rate is plotted on the Y axis (positive Y indicates infection propagation, negative Y indicates subsidence) by the output variable of interest. The plot shows that the critical values for cases 1-3 are 36, 425 and 877, respectively. The X axis represents model runs (total of 1,280). The model outputs for each case are sorted in ascending order, so that each plot is a monotonic curve, and the Y axis is cut (scaled from -3 to +5) to visualize the plot around zero.
Discussion
Following the principles of efficiency and effectiveness, investigators may neglect quantitative analysis for interrelations between cases, contacts, and places. This could result in suboptimal selection of sampling objects and cases and my lead investigators to overlook infection propagation characteristics. [16, 17] Although some studies have focused on cases, [18-21] places, [22-24] and contact networks, [10, 25, 26] few studies have employed quantitative and graphics analyses, [15, 27] and no studies to date have combined SNA and GSUA approaches for quantitative and graphic analyses in field epidemiology for selecting sampling objects and characterizing infectious disease transmission in similar local outbreaks.
Nodes with high density or centrality are key to controlling and preventing disease outbreaks. [7, 8, 28] Selectively choosing only clinical symptoms may limit information regarding important vectors of transmission in those with subclinical or latent infections. [29, 30] SNA and GSUA enable quantitative methods for selection of sampling objects to help avoid loss of important patients. During the outbreak, 20 samples were selected in an unbalanced manner (17 from platoon A, only three from B), and the positive rate of the two rounds of sampling was poor (nine of 20 samples were positive). Therefore, the 14 nodes recommended by the SNA approach should be a priority for disease control, even in the absence of laboratory support. It should be noted that one limitation of this method is the inability to detect patients with latent infection; accordingly, we suggest collecting other samples.
The second problem pertained to mastering the characteristics of disease transmission. The strict security procedures of the detoxification center forbid all drug abstainers from bringing any electronic devices inside, including mobile phones, watches, and wearable sensors. We could also not obtain surveillance video data due to privacy considerations. Therefore, rather than state-of-the-art approaches such as SocioPatterns, [9, 20, 26, 31] we had to resort to direct and indirect individual data collection. Obtaining the data used to create Figures 2 and 3 required considerable investigation of three-dimensional distribution, contact information, and hospital data. In contrast, procuring the data used to create Figure 1 merely required collection of contact information. Accordingly, the SNA approach was more efficient with regards to grasping features of the disease outbreak. Furthermore, the government and the society paid a high attention on the outbreak, and all subjects investigated were able to recall details of the events, even 10 months later, during our retrospective investigation in May 2015.
The most important factor of our dynamic model was k (contact coefficient), which consistently presented a rapidly growing trend. Across the time span of the outbreak, we found a clear downward trend of v (infection coefficient), whereas r (recovery rate) played almost no role. Sums of the total indices different from a value of 1 indicate the presence of interactions among factors in the model.
In our study, 55 patients had been infected when the CDC was informed on July 20, 2014; four days after the first case fell ill. Thereafter, a total of 61 patients were infected until disinfection and quarantine on July 22. We also noted that until July 23, oseltamivir had been used for treatment and prevention purpose. Because the effective contacts among 96.83% of patients (61/63) were not influenced by disinfection, quarantine or treatment measures, the contribution of the contact coefficient increased continuously across the time span of the epidemic. This may explain why the change in sum of the first-order effects was relatively small.
Figure 4 was generated based on the guide of Global Sensitivity Analysis: The Primer. [6] Subsequently, the solution focused via transformation on Y (a concept similar to the basic reproductive rate, R0), where Y = vk(S+I+R)-r. In this case, Y > 0 indicates spread of the infection, and Y < 0 indicates subsidence of the infection. The X value (36, 425, 877) indicates the number of model runs (the total number of model runs was 1280) with Y being extremely close to zero (Y could be positive or negative), after which percentages were used to determine the degree of infection spread or subsidence. The infection propagated in 31.56% (1 - 877/1280 - 1/1280) of the cases in Figure 4, of which case 3 can be used as an example. Overall, if we wished to control the outbreak effectively and cause the infection rate to drop sharply, we would immediately perform the most stringent control measures, especially when dealing with highly infectious diseases in a relatively closed community.
In this study, data were collected primarily from interviews with affected patients; hence, the findings may be affected by recall-bias or non-response bias. Use of state-of-the-art methods would mitigate these biases to some degree. The conclusions of our study would also be more powerful and persuasive if it were possible to obtain virological data on all important nodes that selected by our approaches. [32, 33]
Previous studies have demonstrated that both the humoral and cellular immune systems are abnormal in drug abusers. [34, 35] Thus this population is theoretically more susceptible to influenza than the general population. However, all patients included in our study were male drug abstainers and their median age was 34 (interquartile range: 28 to 40), so that the discrepancy of age and gender would be equally true.
We suggest that SNA and GSUA approaches may be widely used for quantitative and graphic analyses on similar infectious disease outbreak and that additional prospective studies using molecular biological techniques be undertaken.
Materials and Methods
Data sources
Data were collected from patients and staff members involved in the outbreak. We began by specifying the case definitions. Clinically diagnosed cases were defined as those with sudden onset of high fever, an axillary temperature of 38°C (100.4°F) or above, and at least three other clinical symptoms within the past week (dry cough, headache, muscle and joint pain, severe malaise, sore throat or runny nose). Laboratory-confirmed cases were defined as clinically diagnosed cases with influenza virus identified in respiratory specimens. Exclusion criteria included an axillary temperature below 38°C (100.4°F), fewer than three of the symptoms, negative laboratory test result before initiation of antiviral treatment, or no epidemic history. We also reinvestigated and recorded the time of onset (accurate to the hour), extent (direct contact defined as close contact within 1 m; indirect contact defined as touching objects that patients used), and place (dormitory, refectory, or other) of the close contacts of all 72 preliminary screening cases (index case: body temperature of 37.5°C (99.5°F) or above together with one of the symptoms, but without laboratory diagnosis). Here, we defined a pair of close contacts as two persons in contact irrespective of the time, extent, frequency, or place of contact. Secondly, we performed in-depth research on medical records, the field environment, disease control and prevention measures, and the managements regarding the outbreak. Finally, we interviewed all medical staff members and administrators to verify the information that had been previously collected.
This study was approved by the institutional review board of Tongji Medical College of Huazhong University of Science and Technology.
Software utilized for data analysis
UCINET version 6.216 (Borgatti, S.P., Everett, M.G. and Freeman, L.C. 2002) was used to construct the matrix and calculate parameters for SNA. [36] NetDraw version 2.084 (Borgatti, S.P. 2002) was used to construct sociograms of the networks. [37] MATLAB version R2012a (Mathworks, Natick, MA, USA) was used to analyze the transmission through GSUA. [38] SAS version 9.4 (SAS Institute, Cary, NC, USA) was used to perform the chi-squared test, Cochran-Mantel-Haenszel statistic, and Kruskal-Wallis test. Statistical significance was set at P < 0.05.
Data processing
We collected contact information from all 72 index cases and established a matrix referred to as “whole72”. We calculated the degree centrality and betweenness centrality of all index cases (Table 1). Comparison of degree and betweenness centrality between traditional method and SNA approach was analyzed using the Kruskal-Wallis test (Tables 2 and 3).
Based on clinical diagnosis criteria, laboratory test results and epidemic history, nine nodes were excluded (see Table 1), and 63 nodes were recognized as patients who then formed the matrix “adjust63”. We then added two types of relationships (platoon A, platoon B) to create a new matrix, “adjust65”. We generated a structure and distribution diagram of outbreak networks (Figure 1). Based on onset time, contact time and spatial distribution (dormitory), we drew two diagrams of the possible transmission pattern (Figures 2 and 3).
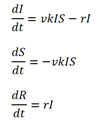
Parameter I represented the number of infected individuals at time t, parameter S represented the number of individuals susceptible to infection at time t, and parameter R represented the number of recovered individuals at time t. Factors v and r represented the “infection coefficient” and “recovery rate”, respectively, factors v and r were both in accord with a normal distribution. Factor k represented the “contact coefficient”, which was distributed as k ~ beta (2, 7) at the beginning of the influenza outbreak, as k ~ beta (0.5, 10) during the period of quarantine, and as k ~ beta (0.2, 15) when all patients and susceptible individuals had received oseltamivir. The dynamic equations of our retrospective study are
We calculated sensitivity indices for the three factors. Results for the three configurations of k were shown in Table 4. We then performed uncertainty analysis with the model simulation outputs (Figure 4).
Acknowledgments
We appreciate the help of all patients, healthcare workers, and administrative staffs who were involved in this study. We are especially indebted to Prof. Shaofa Nie for his support and guidance. We thank Hongbo Jiang and Chun Guo for their assistance with the preparation of the manuscript. We are grateful to Hao Zhang, Lei Wang and Jing Yang who contributed data for the study and whose help was invaluable.
Conflicts of Interest
The authors declare they have no conflicts of interest.
References
1. Zhang Y. National Health and Family Planning Commission of the People’s Republic of China: 1077 cases of publich health emergencies had been successfully disposed in 2013. China Network. 6 Mar 2014.Available:http://news.china.com.cn/2014lianghui/2014-03/06/content_31697636.htm.
2. Ren J, Wu Q, Hao Y, Ferrier A, Sun H, Ding D, Ning N, Cui Y. Identifying weaknesses in national health emergency response skills and techniques with emergency responders: A cross-sectional study from China. American journal of infection control. 2016. doi:10.1016/j.ajic.2016.10.001
3. Taubes G. Epidemiology faces its limits. Science. 1995; 269:164-169.
4. Wing S. Limits of Epidemiology. Medicine & Global Survival. 1994; 1:74-86.
5. Hawe P, Webster C, Shiell A. A glossary of terms for navigating the field of social network analysis. Journal of epidemiology and community health. 2004; 58:971-975. doi:10.1136/jech.2003.014530
6. Saltelli A, Ratto M, Andres T, Campolongo F, Cariboni J, Gatelli D, Saisana M, Tarantola S. Global Sensitivity Analysis: The Primer. John Wiley & Sons, Ltd. 2007:155-182.
7. Cook VJ, Sun SJ, Tapia J, Muth SQ, Arguello DF, Lewis BL, Rothenberg RB, McElroy PD. Transmission network analysis in tuberculosis contact investigations. The Journal of infectious diseases. 2007; 196:1517-1527. doi:10.1086/523109
8. Christley RM, Pinchbeck GL, Bowers RG, Clancy D, French NP, Bennett R, Turner J. Infection in social networks: Using network analysis to identify high-risk individuals. Am J Epidemiol. 2005; 162:1024-1031. doi:10.1093/aje/kwi308
9. Voirin N, Payet C, Barrat A, Cattuto C, Khanafer N, Regis C, Kim BA, Comte B, Casalegno JS, Lina B, Vanhems P. Combining high-resolution contact data with virological data to investigate influenza transmission in a tertiary care hospital. Infection control and hospital epidemiology. 2015; 36:254-260. doi:10.1017/ice.2014.53
10. Gates MC, Woolhouse ME. Controlling infectious disease through the targeted manipulation of contact network structure. Epidemics. 2015; 12:11-19. doi:10.1016/j.epidem.2015.02.008
11. Otte E, Rousseau R. Social network analysis: a powerful strategy, also for the information sciences. J Inform Sci. 2002; 28:441-453. doi:10.1177/016555102762202123
12. Young AM, Rudolph AE, Quillen D, Havens JR. Spatial, temporal and relational patterns in respondent-driven sampling: evidence from a social network study of rural drug users. Journal of epidemiology and community health. 2014; 68:792-798. doi:10.1136/jech-2014-203935
13. Convertino M, Muñoz-Carpena R, Chu-Agor ML, Kiker GA, Linkov I. Untangling drivers of species distributions: Global sensitivity and uncertainty analyses of MaxEnt. Environmental Modelling & Software. 2014; 51:296-309. doi:10.1016/j.envsoft.2013.10.001
14. Ludtke N, Panzeri S, Brown M, Broomhead DS, Knowles J, Montemurro MA, Kell DB. Information-theoretic sensitivity analysis: a general method for credit assignment in complex networks. Journal of the Royal Society, Interface / the Royal Society. 2008; 5:223-235. doi:10.1098/rsif.2007.1079
15. Nsoesie EO, Beckman RJ, Marathe MV. Sensitivity analysis of an individual-based model for simulation of influenza epidemics. PloS one. 2012; 7:e45414. doi:10.1371/journal.pone.0045414
16. Kogevinas M. The loss of the population approach puts epidemiology at risk. Journal of epidemiology and community health. 1998; 52:615-616.
17. Susscer M. Does risk factor epidemiology put epidemiology at risk? Peering into the future. Journal of epidemiology and community health. 1998; 52:608-611.
18. Zhang HF, Xie JR, Tang M, Lai YC. Suppression of epidemic spreading in complex networks by local information based behavioral responses. Chaos. 2014; 24:043106. doi:10.1063/1.4896333
19. Wu JB, Li XL, Zhang J, Xu D, Zhu JJ, Zhou BS. Source identification through social networks in an epidemiological investigation of a hepatitis A outbreak at an elementary school in Anhui province, China. Epidemiology and infection. 2014; 142:1450-1458. doi:10.1017/S0950268813002331
20. Genois M, Vestergaard CL, Cattuto C, Barrat A. Compensating for population sampling in simulations of epidemic spread on temporal contact networks. Nature communications. 2015; 6:8860. doi:10.1038/ncomms9860
21. Dharmadhikari AS. Six degrees of separation: use of social network analysis to better understand outbreaks of nosocomial transmission of extensively drug-resistant tuberculosis. The Journal of infectious diseases. 2013; 207:1-3. doi:10.1093/infdis/jis634
22. Fur R, Henderson EA, Read RR, Godley J, Roy C, Bush K. The Use Of Social Network Analysis To Quantify the Importance Of Sex Partner Meeting Venues In an Infectious Syphilis Outbreak In Alberta, Canada. Sex Transm Infect. 2011; 87:A164-A165. doi:10.1136/sextrans-2011-050108.154
23. De P, Singh AE, Wong T, Yacoub W, Jolly AM. Sexual network analysis of a gonorrhoea outbreak. Sex Transm Infect. 2004; 80:280-285. doi:10.1136/sti.2003.007187
24. Cauchemez S, Bhattarai A, Marchbanks TL, Fagan RP, Ostroff S, Ferguson NM, Swerdlow D, Sodha SV, Moll ME, Angulo FJ, Palekar R. Role of social networks in shaping disease transmission during a community outbreak of 2009 H1N1 pandemic influenza. P Natl Acad Sci USA. 2011; 108:2825-2830. doi:10.1073/pnas.1008895108
25. Emch M, Root ED, Giebultowicz S, Ali M, Perez-Heydrich C, Yunus M. Integration of Spatial and Social Network Analysis in Disease Transmission Studies. Annals of the Association of American Geographers Association of American Geographers. 2012; 105:1004-1015. doi:10.1080/00045608.2012.671129
26. Fournet J, Barrat A. Epidemic risk from friendship network data: an equivalence with a non-uniform sampling of contact networks. Scientific reports. 2016; 6:24593. doi:10.1038/srep24593
27. El-Sayed AM, Scarborough P, Seemann L, Galea S. Social network analysis and agent-based modeling in social epidemiology. Epidemiologic perspectives & innovations : EP+I. 2012; 9:1. doi:10.1186/1742-5573-9-1
28. Pautasso M, Moslonka-Lefebvre M, Jeger MJ. The number of links to and from the starting node as a predictor of epidemic size in small-size directed networks. Ecol Complex. 2010; 7:424-432. doi:10.1016/j.ecocom.2009.10.003
29. Furuya-Kanamori L, Cox M, Milinovich GJ, Magalhaes RJ, Mackay IM, Yakob L. Heterogeneous and Dynamic Prevalence of Asymptomatic Influenza Virus Infections. Emerging infectious diseases. 2016; 22:1052-1056. doi:10.3201/eid2206.151080
30. Rangaka MX, Cavalcante SC, Marais BJ, Thim S, Martinson NA, Swaminathan S, Chaisson RE. Controlling the seedbeds of tuberculosis: diagnosis and treatment of tuberculosis infection. Lancet. 2015; 386:2344-2353. doi:10.1016/S0140-6736(15)00323-2
31. Mastrandrea R, Fournet J, Barrat A. Contact Patterns in a High School: A Comparison between Data Collected Using Wearable Sensors, Contact Diaries and Friendship Surveys. PloS one. 2015; 10:e0136497. doi:10.1371/journal.pone.0136497
32. Gardy JL, Johnston JC, Ho Sui SJ, Cook VJ, Shah L, Brodkin E, Rempel S, Moore R, Zhao Y, Holt R, Varhol R, Birol I, Lem M, et al. Whole-genome sequencing and social-network analysis of a tuberculosis outbreak. The New England journal of medicine. 2011; 364:730-739. doi:10.1056/NEJMoa1003176
33. Klovdahl AS, Graviss EA, Yaganehdoost A, Ross MW, Wanger A, Adams GJ, Musser JM. Networks and tuberculosis: an undetected community outbreak involving public places. Soc Sci Med. 2001; 52:681-694. doi:10.1016/S0277-9536(00)00170-2
34. Brown SM, Stimmel B, Taub RN, Kochwa S, Rosenfield RE. Immunologic Dysfunction in Heroin Addicts. Archives of internal medicine. 1974; 134:1001-1006.
35. Govitrapong P, Suttitum T, Kotchabhakdi N, Uneklabh T. Alterations of Immune Functions in Heroin Addicts and Heroin Withdrawal Subjects. Journal of pharmacology and experimental therapeutics. 1998; 286:883-889.
36. Borgatti SP, Everett MG, Freeman LC. Ucinet VI for windows software for social network analysis. Harvard:Analytic Technologies. 2002.
37. Borgatti SP. NetDraw: Graph visualization software. Harvard: Analytic Technologies. 2002.
38. MATLAB and Statistics Toolbox Release 2012a,The MathWorks, Inc.,Natick, Massachusetts, United States.