
INTRODUCTION
Neural tube defects (NTDs), are a group of serious birth defects caused by abnormal development of the neural tube during embryonic life that produces injuries of the brain and spinal cord [1]. The majority of NTDs cases are diagnosed prenatally, and termination of pregnancy for fetal anomaly has become the most common outcome [2–4]. Because of the severe outcomes of this malformation, many studies have been conducted to investigate the mechanisms, and findings suggest that the development of this disease is a multistep process strictly controlled by genes and modulated by a host of environmental factors [5]. Recently, conclusive evidence from clinical trials has led to recommendations for adequate periconceptional folic acid intake to reduce the occurrence of an NTD-affected pregnancy [6].
A recent systematic review [7] suggested great variability in reported NTD prevalence estimates globally (range, 0.3–199.4 per 10,000 births). Of note, almost 80% of the studies reported prevalence estimates above 6.0 per 10,000 births. When stratified by subtypes of NTDs, spina bifida contributed the highest percentage, followed by anencephaly and then encephalocele. However, the data used to describe the time trends in the prevalence of NTDs in the majority of these studies were collected one or two decades ago. A similar phenomenon was also observed in China. For example, the prevalence of NTDs was 199.4 per 10,000 live births in Luliang Prefecture, a city in the Shanxi Province of China, from 2004 to 2005 [8]. By contrast, from 2003 to 2009, the prevalence was 0.3 per 10,000 live births in Beijing [9]. Although a recent study conducted by Liu and colleagues [10] showed that the prevalence of NTDs presented a continuous decreasing trend and was 31.5 per 10,000 live births in 2014 in the Shanxi Province of China. However, data reflecting the status of NTDs in China during the last decade have been quite limited for other areas. Such information would be critical to understand whether similar decreasing trends hold for other regions. The prevalence of NTDs in the past decade as well as whether similar trends can be observed in other cities remains unknown. Notably, no recent study has described the time trend in the prevalence of NTDs and their subtypes (anencephaly, spina bifida, encephalocele, and congenital hydrocephalus) or stratified these malformations by whether they are accompanied by additional major defects (i.e., isolated versus non-isolated cases of malformations).
Liaoning Province, which encompasses an area of 145,900 square kilometers and has a population of almost 42 million, has contributed greatly to the development of China in the past decades. Nevertheless, no formal assessment of this population has been made. Therefore, to evaluate the time trends in the prevalence of NTD subtypes during the recent decade as well as to identify the epidemiological characteristics of these malformations, we conducted a population-based study using the most recent database for Liaoning Province for the 10-year period from 2006 to 2015.
RESULTS
Table 1 presents the results of the time-trend analysis for the prevalence of NTDs in Liaoning Province from 2006 to 2015. A total of 6217 NTDs cases were detected among 3,248,954 live births (prevalence rate, 19.1 per 10,000 live births). Compared with congenital hydrocephalus (9.3 per 10,000 live births), a relatively lower prevalence was observed for anencephaly (4.9 per 10,000 live births), spina bifida (6.2 per 10,000 live births), and encephalocele (1.2 per 10,000 live births). Except for spina bifida, significantly higher prevalence was detected in isolated compared with non-isolated malformations (Table 1). Figure 1 visually depicts the time trends in the prevalence of NTDs in Liaoning Province during the observational period. Except for encephalocele and non-isolated NTDs, a significant decrease was observed in the prevalence of all NTDs (Table 1), with the prevalence rate for NTDs, anencephaly, spina bifida, and congenital hydrocephalus significantly decreased annually by 10.68%, 10.15%, 11.57%, and 11.84%, respectively. Notably, the extent of the decrease observed in the prevalence of congenital hydrocephalus included both the greatest and least annual change (13.24% versus 8.79%). The greatest contribution to the decrease in NTDs was congenital hydrocephalus, which accounted for 33.3% of the overall decrease (Table 2). By contrast, encephalocele had the lowest contribution rate. Additionally, except for encephalocele, all isolated malformations had relatively higher contribution rates than non-isolated ones.
Table 1: The prevalence and time trends of neural tube defects (per 10,000 births)
Year |
Overall |
Average |
P |
95% CI |
||||||||||
|---|---|---|---|---|---|---|---|---|---|---|---|---|---|---|
2006 |
2007 |
2008 |
2009 |
2010 |
2011 |
2012 |
2013 |
2014 |
2015 |
|||||
NTDs |
28.8 |
29.3 |
23.4 |
21.1 |
17.7 |
18.3 |
16.9 |
15.2 |
12.9 |
7.5 |
19.1 |
−10.68 |
<0.001 |
−13.32, −7.97 |
Multiple NTDs |
4.0 |
3.7 |
2.5 |
3.2 |
3.4 |
2.5 |
2.2 |
1.7 |
1.3 |
0.6 |
2.5 |
−12.19 |
0.001 |
−17.49, −6.55 |
Isolated |
26.3 |
25.7 |
20.8 |
18.5 |
15.5 |
14.9 |
14.0 |
12.1 |
10.8 |
6.1 |
16.5 |
−11.93 |
<0.001 |
−14.13, −9.66 |
Non-isolated |
2.5 |
3.5 |
2.6 |
2.7 |
2.3 |
3.4 |
2.9 |
3.1 |
2.1 |
1.4 |
2.7 |
−3.15 |
0.25 |
−8.79, 2.84 |
Anencephaly |
7.4 |
7.1 |
5.6 |
5.2 |
5.5 |
5.2 |
4.1 |
4.4 |
3.0 |
1.8 |
4.9 |
−10.15 |
<0.001 |
−13.60, −6.56 |
Isolated |
6.1 |
5.6 |
4.9 |
4.0 |
3.9 |
3.9 |
3.3 |
3.6 |
2.5 |
1.5 |
3.9 |
−10.33 |
<0.001 |
−13.38, −7.17 |
Non-isolated |
1.3 |
1.5 |
0.7 |
1.2 |
1.5 |
1.3 |
0.8 |
0.8 |
0.5 |
0.3 |
1.0 |
−9.52 |
0.04 |
−17.49, −0.77 |
Spina bifida |
9.6 |
9.5 |
7.6 |
6.8 |
6.7 |
6.5 |
5.2 |
4.4 |
3.8 |
2.3 |
6.2 |
−11.57 |
<0.001 |
−14.19, −8.88 |
Isolated |
5.1 |
5.3 |
4.6 |
3.2 |
2.9 |
3.2 |
2.3 |
1.8 |
2.1 |
1.3 |
3.2 |
−13.06 |
<0.001 |
−16.02, −10.00 |
Non-isolated |
4.6 |
4.2 |
3.0 |
3.6 |
3.9 |
3.3 |
2.9 |
2.6 |
1.7 |
1.0 |
3.1 |
−9.88 |
0.003 |
−14.73, −4.75 |
Encephalocele |
1.1 |
1.5 |
1.3 |
1.5 |
1.3 |
1.1 |
1.2 |
1.4 |
1.2 |
0.8 |
1.2 |
−2.57 |
0.21 |
−6.74, 1.80 |
Isolated |
0.8 |
1.1 |
1.0 |
1.0 |
1.1 |
0.8 |
0.8 |
1.1 |
1.0 |
0.6 |
0.9 |
−1.19 |
0.55 |
−5.65, 3.47 |
Non-isolated |
0.4 |
0.4 |
0.3 |
0.5 |
0.2 |
0.3 |
0.3 |
0.3 |
0.2 |
0.2 |
0.3 |
−6.39 |
0.06 |
−12.85, 0.55 |
CH |
14.6 |
14.9 |
11.5 |
10.9 |
7.7 |
8.0 |
8.6 |
6.8 |
6.2 |
3.2 |
9.3 |
−11.84 |
<0.001 |
−15.03, −8.52 |
Isolated |
10.7 |
10.4 |
8.3 |
7.5 |
4.6 |
5.0 |
5.6 |
4.2 |
4.2 |
2.2 |
6.3 |
−13.24 |
<0.001 |
−16.57, −9.77 |
Non-isolated |
4.0 |
4.5 |
3.1 |
3.4 |
3.1 |
3.0 |
3.1 |
2.6 |
2.0 |
1.0 |
3.0 |
−8.79 |
0.002 |
−13.10, −4.26 |
CI, confidence interval; CH, congenital hydrocephalus.
Table 2: The relative contributions of decreasing trend of neural tube defects prevalence
Birth Defects |
Decreasing trend |
|
|---|---|---|
β |
Contribution rate (%) |
|
NTDs |
||
Anencephaly |
−0.11 |
28.2 |
Spina bifida |
−0.12 |
30.8 |
Encephalocele |
−0.03 |
7.7 |
Congenital hydrocephalus |
−0.13 |
33.3 |
NTDs |
||
Isolated |
−0.13 |
81.3 |
Non-isolated |
−0.03 |
18.7 |
Anencephaly |
||
Isolated |
−0.11 |
52.4 |
Non-isolated |
−0.10 |
47.6 |
Spina bifida |
||
Isolated |
−0.14 |
58.3 |
Non-isolated |
−0.10 |
41.7 |
Encephalocele |
||
Isolated |
−0.01 |
12.5 |
Non-isolated |
−0.07 |
87.5 |
Congenital hydrocephalus |
||
Isolated |
−0.14 |
60.9 |
Non-isolated |
−0.09 |
39.1 |
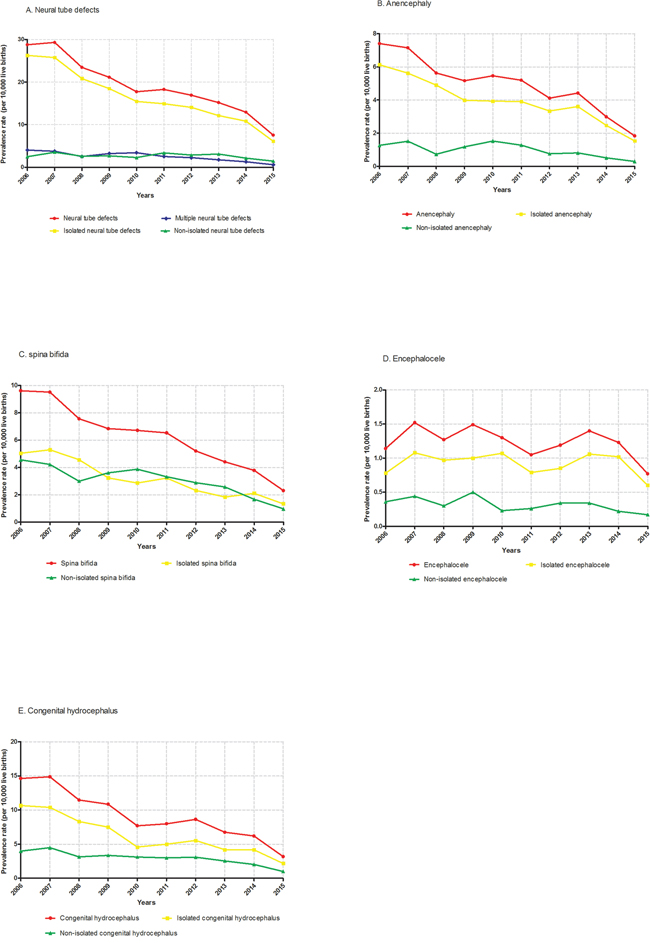
Figure 1: Time trends in the prevalence of NTDs in Liaoning Province from 2006 to 2015. A. neural tube defects; B. anencephaly; C. spina bifida; D. encephalocele; E. congenital hydrocephalus.
The characteristics of mothers and infants with NTDs are shown in Table 3. For time to diagnosis, the majority of these cases were diagnosed during pregnancy. For prognosis status, inducing labor was the major outcome, which accounted for 76.4%, 85.2%, 68.5%, 76.2%, and 78.9% in NTDs, anencephaly, spina bifida, encephalocele, and congenital hydrocephalus, respectively. Additionally, anencephaly had the lowest proportion of live births, whereas spina bifida had the highest. The majority of the mothers was Han, aged 20 to 30 years, and had an income level over 2400 yuan/person and an education level of middle school. The majority of the infants with malformations were singletons with a gestational age of less than 28 weeks and a birth weight less than 2,500 grams. Besides, when comparing the epidemiological characteristics for NTDs and its subtypes by multivariable analysis, significant differences were existed in selected characteristics when treating encephalocele as reference group (Table 3). For example, significant differences were observed in all three subtypes regarding time of diagnosis, number of live birth, gestational age, and birth weight. Additionally, three (prognosis status, maternal age, and sex) and one characteristic (educational level) showed significance in two and one subtype of NTDs, respectively.
Table 3: Characteristics for neural tube defects and their subtypes of infants and their mother *
Characteristics |
NTDs |
Anencephaly |
Spina bifida |
Encephalocele |
Congenital hydrocephalus |
|---|---|---|---|---|---|
No. of cases |
6217 |
1600 |
2029 |
404 |
3008 |
Time of diagnosis (%) |
|||||
During pregnancy |
5651 (90.9) |
368 (91.1) |
|||
Within 7 days after delivery |
566 (9.1) |
36 (8.9) |
|||
Prognosis status (%) |
|||||
Live birth |
487 (7.8) |
22 (5.5) |
140 (4.7) |
||
Stillbirth |
790 (12.7) |
63 (15.6) |
399 (13.3) |
||
Dead within 28 days |
189 (3.1) |
11 (2.7) |
97 (3.2) |
||
Inducing labor |
4751 (76.4) |
308 (76.2) |
2372 (78.9) |
||
Mother |
|||||
No. of pregnancy (%) |
|||||
0 |
26 (0.4) |
4 (0.3) |
12 (0.6) |
4 (1.0) |
9 (0.3) |
1 |
3221 (51.8) |
818 (51.1) |
1091 (53.8) |
205 (50.7) |
1560 (51.9) |
≥2 |
2970 (47.8) |
778 (48.6) |
926 (45.6) |
195 (48.3) |
1439 (47.8) |
No. of live births (%) |
|||||
0 |
2159 (34.7) |
171 (42.3) |
|||
1 |
3165 (50.9) |
183 (45.3) |
|||
≥2 |
893 (14.4) |
50 (12.4) |
|||
Age, years (%) |
|||||
<20 |
184 (3.0) |
75 (3.7) |
13 (3.2) |
||
20-25 |
1887 (30.4) |
673 (33.2) |
100 (24.8) |
||
25-30 |
2141 (34.4) |
667 (32.9) |
155 (38.4) |
||
30-35 |
1190 (19.1) |
349 (17.1) |
88 (21.8) |
||
≥35 |
815 (13.1) |
265 (13.1) |
48 (11.8) |
||
Race (%) |
|||||
Han |
5420 (87.2) |
1393 (87.1) |
1783 (87.9) |
356 (88.1) |
2608 (86.7) |
Others |
797 (12.8) |
207 (12.9) |
246 (12.1) |
48 (11.9) |
400 (13.3) |
Income level † (%) |
|||||
<600 yuan |
513 (8.3) |
123 (7.7) |
210 (10.4) |
30 (7.4) |
236 (7.9) |
600-1200 yuan |
980 (15.7) |
269 (16.8) |
356 (17.6) |
59 (14.6) |
457 (15.1) |
1200-2400 yuan |
1762 (28.3) |
463 (28.9) |
592 (29.2) |
116 (28.7) |
848 (28.2) |
≥2400 yuan |
2962 (47.6) |
745 (46.6) |
871 (42.8) |
199 (49.3) |
1467 (48.8) |
Education level (%) |
|||||
Elementary school or less |
511 (8.2) |
144 (9.0) |
29 (7.2) |
223 (7.4) |
|
Middle school |
3916 (63.0) |
1033 (64.6) |
242 (59.9) |
1882 (62.6) |
|
High school |
996 (16.0) |
218 (13.6) |
64 (15.8) |
527 (17.5) |
|
College or above |
794 (12.8) |
205 (12.8) |
69 (17.1) |
376 (12.5) |
|
Infant |
|||||
Gestational age, week (%) |
|||||
<28 |
3762 (60.5) |
315 (78.0) |
|||
28-37 |
1529 (24.6) |
45 (11.1) |
|||
≥37 |
926 (14.9) |
44 (10.9) |
|||
Birth weight, grams (%) |
|||||
<2500 |
5028 (80.9) |
356 (88.1) |
|||
2500-4000 |
1119 (18.0) |
46 (11.4) |
|||
≥4000 |
70 (1.1) |
2 (0.5) |
|||
Sex (%) |
|||||
Male |
2968 (47.7) |
677 (42.3) |
181 (44.8) |
||
Female |
2985 (48.0) |
768 (48.0) |
194 (48.0) |
||
Unknown |
264 (4.3) |
155 (9.7) |
29 (7.2) |
||
Multiple births (%) |
|||||
Yes |
167 (2.7) |
52 (3.3) |
36 (1.8) |
396 (98.0) |
83 (2.8) |
No |
6050 (97.3) |
1548 (96.7) |
1993 (98.2) |
8 (2.0) |
2925 (97.2) |
* Chi-square test was used to compare the characteristics of the four subtypes of neural tube defects (encephalocele was treated as reference group). Significant results of chi-square test are presented in red.
† Income level was presented as per person per year.
When the characteristics of the mothers and infants were examined by whether the NTD or subtype was accompanied by additional major defects (isolated versus non-isolated), significant differences were found for selected characteristics (Tables 4 and 5). For example, except for time to diagnosis, number of pregnancies, and race, significant differences were observed in all selected characteristics for NTDs. Additionally, non-isolated spina bifida was significantly easier to diagnose than isolated spina bifida during pregnancy. Similarly, live birth was more likely to be associated with isolated than non-isolated spina bifida. Notably, there was a significant difference in gestational age between NTDs and all the subtypes.
Table 4: Characteristics for neural tube defects, anencephaly, and spina bifida of infants and their mother (isolated versus non-isolated)
Characteristics |
NTDs |
Anencephaly |
Spina bifida |
||||||
|---|---|---|---|---|---|---|---|---|---|
Isolated |
Non-isolated |
P value |
Isolated |
Non-isolated |
P value |
Isolated |
Non-isolated |
P value |
|
No. of cases |
5356 |
861 |
1280 |
320 |
1035 |
994 |
|||
Time of diagnosis (%) |
0.76 |
0.26 |
<0.001 |
||||||
During pregnancy |
4866 (90.9) |
785 (91.2) |
1266 (98.9) |
314 (98.1) |
723 (69.9) |
940 (94.5) |
|||
Within 7 days after delivery |
490 (9.1) |
76 (8.8) |
14 (1.1) |
6 (1.9) |
312 (30.1) |
54 (5.5) |
|||
Prognosis status (%) |
0.01 |
0.68 |
<0.001 |
||||||
Live birth |
433 (8.1) |
54 (6.3) |
10 (0.8) |
1 (0.3) |
292 (28.2) |
43 (4.3) |
|||
Stillbirth |
675 (12.6) |
115 (13.4) |
166 (13.0) |
47 (14.7) |
94 (9.1) |
132 (13.3) |
|||
Dead within 28 days |
150 (2.8) |
39 (4.5) |
10 (0.8) |
3 (0.9) |
54 (5.2) |
25 (2.5) |
|||
Inducing labor |
4098 (76.5) |
653 (75.8) |
1094 (85.4) |
269 (84.1) |
595 (57.5) |
794 (79.9) |
|||
Mother |
|||||||||
No. of pregnancy (%) |
0.938 |
0.34 |
0.54 |
||||||
0 |
23 (0.4) |
3 (0.4) |
4 (0.3) |
0 (0) |
8 (0.8) |
4 (0.4) |
|||
1 |
2776 (51.8) |
445 (51.7) |
649 (50.7) |
169 (52.8) |
553 (53.4) |
538 (54.1) |
|||
≥2 |
2557 (47.8) |
413 (47.9) |
627 (49.0) |
151 (47.2) |
474 (45.8) |
452 (45.5) |
|||
No. of live births (%) |
<0.001 |
0.30 |
<0.001 |
||||||
0 |
1802 (33.6) |
357 (41.5) |
632 (49.4) |
157 (49.1) |
291 (28.1) |
424 (42.7) |
|||
1 |
2768 (51.7) |
397 (46.1) |
505 (39.5) |
136 (42.5) |
569 (55.0) |
438 (44.1) |
|||
≥2 |
786 (14.7) |
107 (12.4) |
143 (11.1) |
27 (8.4) |
175 (16.9) |
132 (13.2) |
|||
Age, years (%) |
<0.001 |
0.26 |
0.005 |
||||||
<20 |
164 (3.1) |
20 (2.3) |
38 (3.0) |
16 (5.0) |
31 (3.0) |
44 (4.4) |
|||
20-25 |
1677 (31.3) |
210 (24.4) |
408 (31.9) |
110 (34.4) |
314 (30.3) |
359 (36.1) |
|||
25-30 |
1825 (34.1) |
316 (36.7) |
423 (33.0) |
94 (29.4) |
373 (36.0) |
294 (39.6) |
|||
30-35 |
1013 (18.9) |
177 (20.6) |
258 (20.1) |
59 (18.4) |
184 (17.8) |
165 (16.6) |
|||
≥35 |
677 (12.6) |
138 (16.0) |
153 (12.0) |
41 (12.8) |
133 (12.9) |
132 (13.3) |
|||
Race (%) |
0.61 |
0.91 |
0.54 |
||||||
Han |
4674 (87.3) |
746 (86.6) |
1115 (87.1) |
278 (86.9) |
914 (88.3) |
869 (87.4) |
|||
Others |
682 (12.7) |
115 (13.4) |
165 (12.9) |
42 (13.1) |
121 (11.7) |
125 (12.6) |
|||
Income level † (%) |
<0.001 |
0.43 |
0.88 |
||||||
< 600 yuan |
467 (8.7) |
46 (5.3) |
93 (7.3) |
30 (9.4) |
112 (10.8) |
98 (9.9) |
|||
600-1200 yuan |
868 (16.3) |
112 (13.0) |
221 (17.3) |
48 (15.0) |
184 (17.8) |
172 (17.3) |
|||
1200-2400 yuan |
1555 (29.0) |
207 (24.0) |
375 (29.3) |
88 (27.5) |
300 (29.0) |
292 (29.4) |
|||
≥ 2400 yuan |
2466 (46.0) |
496 (57.7) |
591 (46.1) |
154 (48.1) |
439 (42.4) |
432 (43.4) |
|||
Education level (%) |
<0.001 |
0.44 |
0.58 |
||||||
Elementary school or less |
447 (8.4) |
64 (7.4) |
119 (9.3) |
25 (7.8) |
103 (10.0) |
88 (8.9) |
|||
Middle school |
3476 (64.9) |
440 (51.1) |
826 (64.5) |
207 (64.7) |
681 (65.8) |
656 (66.0) |
|||
High school |
821 (15.3) |
175 (20.3) |
167 (13.1) |
51 (15.9) |
149 (14.4) |
160 (16.1) |
|||
College or above |
612 (11.4) |
182 (21.2) |
168 (13.1) |
37 (11.6) |
102 (9.8) |
90 (9.0) |
|||
Infant |
|||||||||
Gestational age, week (%) |
<0.001 |
0.009 |
<0.001 |
||||||
<28 |
3201 (59.8) |
561 (65.2) |
1156 (90.3) |
280 (87.5) |
487 (47.1) |
695 (69.9) |
|||
28-37 |
1338 (25.0) |
191 (22.2) |
87 (6.8) |
36 (11.3) |
202 (19.5) |
197 (19.8) |
|||
≥37 |
817 (15.2) |
109 (12.6) |
37 (2.9) |
4 (1.2) |
346 (33.4) |
102 (10.3) |
|||
Birth weight, gram (%) |
0.02 |
0.78 |
<0.001 |
||||||
<2500 |
4309 (80.5) |
719 (83.5) |
1244 (97.2) |
312 (97.5) |
656 (63.4) |
858 (86.3) |
|||
2500-4000 |
980 (18.3) |
139 (16.1) |
35 (2.7) |
8 (2.5) |
353 (34.1) |
130 (13.1) |
|||
≥4000 |
67 (1.2) |
3 (0.4) |
1 (0.1) |
0 (0) |
26 (2.5) |
6 (0.6) |
|||
Sex (%) |
<0.001 |
0.17 |
<0.001 |
||||||
Male |
2541 (47.5) |
427 (49.6) |
556 (43.4) |
121 (37.8) |
482 (46.6) |
430 (43.3) |
|||
Female |
2610 (48.7) |
375 (43.6) |
600 (46.9) |
168 (52.5) |
543 (52.5) |
516 (51.9) |
|||
Unknown |
205 (3.8) |
59 (6.8) |
124 (9.7) |
31 (9.7) |
10 (0.9) |
48 (4.8) |
|||
Multiple births (%) |
<0.001 |
0.05 |
0.65 |
||||||
Yes |
128 (2.4) |
39 (4.5) |
36 (2.8) |
16 (5.0) |
17 (1.6) |
19 (1.9) |
|||
No |
5228 (97.6) |
822 (95.5) |
1244 (97.2) |
304 (95.0) |
1018 (98.4) |
975 (98.1) |
|||
† Income level was presented as per person per year.
Table 5: Characteristics for encephalocele and congenital hydrocephalus of infants and their mother (isolated versus non-isolated)
Characteristics |
Encephalocele |
Congenital hydrocephalus |
||||
|---|---|---|---|---|---|---|
Isolated |
Non-isolated |
P value |
Isolated |
Non-isolated |
P value |
|
No. of cases |
301 |
103 |
2039 |
969 |
||
Time of diagnosis (%) |
0.09 |
0.94 |
||||
During pregnancy |
270 (89.7) |
98 (95.2) |
1926 (94.5) |
916 (94.5) |
||
Within 7 days after delivery |
31 (10.3) |
5 (4.8) |
113 (5.5) |
53 (5.5) |
||
Prognosis status (%) |
0.08 |
0.90 |
||||
Live birth |
20 (6.6) |
2 (1.9) |
91 (4.5) |
49 (5.1) |
||
Stillbirth |
50 (16.6) |
13 (12.6) |
270 (13.2) |
129 (13.3) |
||
Dead within 28 days |
10 (3.3) |
1 (1.0) |
65 (3.2) |
32 (3.3) |
||
Inducing labor |
221 (73.5) |
87 (84.5) |
1613 (79.1) |
759 (78.3) |
||
Mother |
||||||
No. of pregnancy (%) |
0.02 |
0.27 |
||||
0 |
4 (1.3) |
0 (0) |
4 (0.2) |
5 (0.5) |
||
1 |
142 (47.2) |
63 (61.2) |
1051 (51.5) |
509 (52.5) |
||
≥2 |
155 (51.5) |
40 (38.8) |
984 (48.3) |
455 (47.0) |
||
No. of live births (%) |
0.03 |
<0.001 |
||||
0 |
117 (38.9) |
54 (52.4) |
464 (22.8) |
374 (38.6) |
||
1 |
142 (47.1) |
41 (39.8) |
1246 (61.1) |
446 (46.0) |
||
≥2 |
42 (14.0) |
8 (7.8) |
329 (16.1) |
149 (15.4) |
||
Age, years (%) |
0.18 |
0.09 |
||||
<20 |
10 (3.3) |
3 (2.9) |
51 (2.5) |
32 (3.3) |
||
20-25 |
75 (24.9) |
25 (24.3) |
603 (29.5) |
318 (32.8) |
||
25-30 |
106 (35.2) |
49 (47.6) |
725 (35.6) |
309 (31.9) |
||
30-35 |
70 (23.3) |
18 (17.5) |
392 (19.2) |
170 (17.5) |
||
≥35 |
40 (13.3) |
8 (7.7) |
268 (13.2) |
140 (14.5) |
||
Race (%) |
0.43 |
0.48 |
||||
Han |
263 (87.4) |
93 (90.3) |
1774 (87.0) |
834 (86.1) |
||
Others |
38 (12.6) |
10 (9.7) |
265 (13.0) |
135 (13.9) |
||
Income level † (%) |
0.80 |
0.006 |
||||
< 600 yuan |
22 (7.3) |
8 (7.8) |
164 (8.0) |
72 (7.4) |
||
600-1200 yuan |
47 (15.6) |
12 (11.7) |
280 (13.7) |
177 (18.3) |
||
1200-2400 yuan |
86 (28.6) |
30 (29.1) |
569 (27.9) |
279 (28.8) |
||
≥ 2400 yuan |
146 (48.5) |
53 (51.4) |
1026 (50.4) |
441 (45.5) |
||
Education level (%) |
0.41 |
0.21 |
||||
Elementary school or less |
24 (8.0) |
5 (4.9) |
137 (6.7) |
86 (8.9) |
||
Middle school |
184 (61.1) |
58 (56.3) |
1288 (63.2) |
594 (61.3) |
||
High school |
44 (14.6) |
20 (19.4) |
357 (17.5) |
170 (17.5) |
||
College or above |
49 (16.3) |
20 (19.4) |
257 (12.6) |
119 (12.3) |
||
Infant |
||||||
Gestational age, week (%) |
0.03 |
<0.001 |
||||
<28 |
228 (75.8) |
87 (84.5) |
840 (41.2) |
576 (59.4) |
||
28-37 |
33 (11.0) |
12 (11.7) |
867 (42.5) |
265 (27.4) |
||
≥37 |
40 (13.2) |
4 (3.8) |
332 (16.3) |
128 (13.2) |
||
Birth weight, gram (%) |
0.014 |
<0.001 |
||||
<2500 |
257 (85.4) |
99 (96.1) |
1537 (75.4) |
793 (81.8) |
||
2500-4000 |
42 (14.0) |
4 (3.9) |
468 (23.0) |
171 (17.7) |
||
≥4000 |
2 (0.6) |
0 (0) |
34 (1.6) |
5 (0.5) |
||
Sex (%) |
0.23 |
<0.001 |
||||
Male |
128 (42.5) |
53 (51.5) |
1088 (53.4) |
449 (46.3) |
||
Female |
152 (50.5) |
42 (40.8) |
922 (45.2) |
492 (50.8) |
||
Unknown |
21 (7.0) |
8 (7.7) |
29 (1.4) |
28 (2.9) |
||
Multiple births (%) |
0.14 |
0.37 |
||||
Yes |
4 (1.3) |
4 (3.9) |
60 (2.9) |
23 (2.4) |
||
No |
297 (98.7) |
99 (96.1) |
1979 (97.1) |
946 (97.6) |
||
† Income level was presented as per person per year.
DISCUSSION
This population-based study is one of the few reports from China not only to describe the time trends in the prevalence of NTDs and their subtypes during the past decade but also to identify the epidemiological characteristics associated with these malformations. From 2006 to 2015, the prevalence of NTDs in Liaoning Province in northeast China significantly decreased from 28.8 per 10,000 live births to 7.5 per 10,000 live births. A similar pattern was also observed for all the subtypes. When stratified by whether the malformation was accompanied by additional major defects (isolated versus non-isolated), we found significant differences in selected characteristics (e.g., prognosis status, gestational age, and birth weight). Compared with those in several developed countries, higher prevalence rates were still detected in this population, especially for congenital hydrocephalus and spina bifida. This result indicates that further prevention efforts are warranted to reduce the future risk of NTDs.
Our study found that the overall prevalence of NTDs in Liaoning Province from 2006 to 2015 was 19.1 per 10,000 live births [7]. When compared with Europe, the prevalence found in the present study was intermediate between the higher rate reported in Turkey (35.9 per 10,000 live births) by Onrat and colleagues [11] in 2009 and the lower rate reported in Spain (1.3 per 10,000 live births) using the data in the EUROCAT network [12] for 2012. Furthermore, the prevalence for other provinces in China ranged from 0.3 per 10,000 live births reported in Beijing by Li and colleagues [9] in 2009 to 199.4 per 10,000 live births reported in Shanxi Province by Chen and colleagues [8] in 2009. Regarding the time trend in NTDs prevalence in Liaoning province, except for encephalocele, the prevalence of the other NTDs subtypes fluctuated but had an obvious downward trend after 2009, which was in accordance with the results of a study conducted by Liu and colleagues [10]. Additionally, the significantly decreasing trend in prevalence for isolated rather than non-isolated NTDs found in the present study was consistent with that observed in a previous study conducted by Collins and colleagues [13].
A previous study carried out by Li and colleagues [1] showed that based on data gathered from urban and rural areas in the south of China the total prevalence of NTDs from 2006 to 2008 was 9.7 per 10,000 births. We found that the prevalence of NTDs in Liaoning Province (northern area of China) was relatively higher during the same period (27.16 per 10,000 live births). Although many studies have attempted to explain geographical differences, the exact reasons for such discrepancies are unclear. Previous studies have demonstrated that the mutation frequency of methylene tetrahydrofolate reductase C677T among people in the north of China was higher than that in the south, and there is a higher risk of NTDs among fetuses with this mutated gene [14, 15]. Nevertheless, a single genetic mutation is inadequate to explain the aforementioned difference. Additionally, several risk factors, including air pollution and diet, may partly contribute to this difference. For example, the main fuel used for energy processes in the north is coal, which can generate more indoor air pollution than there is in the south [16]. Li and colleagues [17] demonstrated that the risk of NTDs increases with increasing exposure indices, showing a dose-response trend in a case-control study. As for outdoor air pollution, Padula and colleagues [18] showed that ambient air pollution and traffic exposure in early gestation contributed to the risk of NTDs from 1997 to 2006. Furthermore, fewer green vegetables and more pickled vegetables are consumed in the north, and this may result in folic acid and vitamin deficiency, which could be important reasons for a higher prevalence of NTDs in northern than in southern China [1]. These factors may contribute to different NTD prevalence rates among different regions, but additional studies should be conducted to definitively determine the causes.
Although termination of pregnancy for fetal anomaly has considerably reduced the live birth prevalence of these malformations, it is not an optimal solution for NTDs that are preventable with readily available and low cost interventions, as is the case for NTDs with folic acid supplementation or food fortification [19]. Canada and the United States first launched mandatory fortification of 140 μg of folic acid per 100 g of enriched cereal grain products. After this policy was enacted, many studies documented a reduction in malformations [20]. A nationwide folic acid supplementation program was initiated in China in 2009. This program provides free folic acid supplements to all women who have a rural registration and plan to become pregnant [21]. We found that the prevalence of NTDs from 2012 to 2015 decreased markedly from that of 2009, which may be due in part to the effects of this national policy. Although not all subtypes showed a statistically significant decreasing trend in prevalence rates, for example, the prevalence of encephalocele, including isolated and non-isolated cases, was not significantly decreased, this phenomenon might be merely attributable to the limited number of cases examined here. Therefore, policies for mandatory fortification with folic acid should be considered as an important and effective pathway for prevention of NTDs, and supplementation with adequate folic acid for pregnant women should be recommended to decrease the prevalence of NTDs.
In our study, we classified NTDs as non-isolated or isolated depending on whether or not they were accompanied by additional major defects, respectively. We found that the majority of NTDs cases in Liaoning Province were isolated (81.3%). Khoury and colleagues [22] found that isolated NTDs were more sensitive to environmental factors, whereas non-isolated NTDs were sensitive to both environmental and genetic factors. Other research has also revealed a significant decline in the United States between 1992 and 2009, since supplementation with folic acid in 1998, for the prevalence of isolated but not non-isolated NTDs [13]. Therefore, the evidence suggests that folic acid deficiency may affect isolated NTDs to a great extent [8]. Thus, our study supports the idea that it is important to distinguish isolated and non-isolated NTDs due to different epidemiological characteristics. However, more attention should be focused on non-isolated NTDs because of the complicated pathogenic processes and severe clinical manifestations. The prevalence of non-isolated cases was barely decreased simply by intake of folic acid; hence, additional prevention efforts should be undertaken to reduce non-isolated NTDs.
Our study has several strengths. Previous to the present study, only a few studies have reported the prevalence of NTDs in China. We conducted a large-scale study focusing on long-term trends of NTDs to comprehensively describe the time trends in the prevalence of NTDs based on data from a number of population-based registries in Liaoning Province, one of the most important provinces in China. We further evaluated the trends in the prevalence for all major NTDs subtypes and identified the epidemiological characteristics, including whether the NTD was isolated or non-isolated, to provide detailed information about these malformations.
Despite the clear strengths of our study, some limitations should be acknowledged. First, we had no access to the demographic factors for all live births in Liaoning Province, which hindered our ability to investigate the potential causes of the trends. Second, the policy of mandatory premarital physical check-ups became voluntary throughout the country on October 1, 2003 [10]. However, we were unable to access NTD prevalence data in Liaoning Province prior to 2006. Therefore, we could not evaluate whether this policy change affected the change in prevalence for NTDs. Third, we could not exclude the possibility that registration problems might exist for the data used in our study. The NTDs were diagnosed in different hospitals and cities in Liaoning Province, which might have generated bias in our study. Although there have already been some quality control measures, potential “under-reporting” and “misclassification” of the birth defects are difficult to be avoided and may still occur in the registry system, especially in those less developed areas with poor medical conditions. Lastly, the maximum time to diagnosis for NTDs was the seventh day after birth. We did not include NTDs confirmed after the seventh day, which might have led to slightly lower prevalence rates in our study than in studies that include longer periods for confirmed diagnoses.
In conclusion, this population-based study provided the most recent and detailed evidence for time trends in the prevalence of NTDs, as well as epidemiological characteristics, in one of the largest provinces of China from 2006 to 2015. The decreasing trend we found in NTD prevalence may be partly attributed to the nationwide folic acid supplement program as a public health strategy to prevent NTDs. However, the prevalence of NTDs in Liaoning Province remains higher than that in the south of China or several developed countries, which draws attention to the necessity of improving the efficiency of the periconceptional folic acid supplementation program during pregnancy. Future prevention efforts should be strengthened to reduce the risk of NTDs, especially for the non-isolated subtype, in areas with continued high prevalence.
MATERIALS AND METHODS
Study population and data source
Liaoning Women and Children’s Health Hospital is one of the few obstetrical and gynecological hospitals for the province of Liaoning. It has also been a comprehensive care institution, responsible for women and children’s health-care guidance. Data from 2006 to 2015 were retrieved from the maternal and child health certificate registry of Liaoning Province, which was maintained by this hospital. Hospital-delivered live-born and stillborn infants are included in this registry. This registry covers all 14 cities of the province (Shenyang, Dalian, Anshan, Fushun, Benxi, Dandong, Jinzhou, Yingkou, Fuxin, Liaoyang, Panjing, Tieling, Chaoyang, and Huludao), with approximately 42 million inhabitants. Liaoning Province is one of the 31 provinces providing data to the national birth defects surveillance database maintained by the Chinese Birth Defects Monitoring Network. All congenital malformation data are regularly uploaded to the online reporting system for maternal and child health surveillance by specialized staff in Liaoning Women and Children’s Health Hospital [23, 24]. The maximum time to provide a diagnosis of a congenital malformation is the seventh day after birth [25].
Data collection
Detailed procedures for data collection have been described in a previous report [26, 27]. Briefly, provincial and city surveillance networks as well as clinical expert groups were established to undertake the data collection. Each neonate (or terminated fetus) was examined immediately after birth by trained health-care professionals, to screen for congenital malformations. For suspected cases that were diagnosed through prenatal ultrasound scans, case ascertainment after termination or examination after the birth was requested. Once an NTD case was identified and confirmed at the monitored hospital by experts in the department of pediatrics or obstetrics or through an ultrasound, the mother of the infant was interviewed by the staff to complete the “Birth Defects Registration Form.” This form was used for collecting information, including demographic characteristics, clinical features, and obstetric factors. Subsequently, the form was submitted first to the local maternal and child health facility and then to the provincial maternal and child health hospital, which was Liaoning Women and Children’s Health Hospital. Data from these cases were reviewed and confirmed by a group of state-level experts in medical genetics and pediatrics [25].
NTD classification
According to the World Health Organization’s diagnostic tool the International Classification of Diseases, 10th Revision (ICD-10), NTDs include four major congenital malformations: anencephaly (ICD10: Q00), spina bifida (ICD10: Q05), encephalocele (ICD10: Q01), and congenital hydrocephalus (ICD10: Q03). We further classified NTDs into isolated and non-isolated NTDs, with the latter defined as NTDs with additional major defects. Isolated NTDs were divided into single NTDs with malformations at one site, and multiple NTDs with malformations at two or more sites [8]. Single NTDs included anencephaly, spina bifida, encephalocele, and congenital hydrocephalus. The birth prevalence of NTDs was expressed as the number per 10,000 live births. The denominator was based exclusively on the total number of live births, using data obtained primarily from the Liaoning Women and Children’s Health Hospital. The total number of live births in the study window was 3,248,954, with 6217 cases of NTD identified.
Quality control of the data has been described previously in detail [25]. Briefly, according to the program manual to ensure high quality data, the disease diagnosis, data collection, data checking, and medical records were verified by the expert group at each level. In addition, an independent retrospective survey was organized by the experts to find deficiencies and inaccuracies in the data [25].
Statistical analysis
NTD prevalence rates were calculated for nine 1-year time intervals from 2006 to 2015. In order to specifically examine time trends, the Poisson regression model was used to find the line of best fit for NTD prevalence by year, with year entered into the model as a continuous independent variable. Percentages were calculated for selected variables of NTDs with or without other major malformations. Categorical variables were compared using Pearson χ2 tests. All analyses were conducted using SPSS software for Windows (version 23, SPSS Inc., Chicago, IL, USA). All statistical tests were two-sided, and P-values less than 0.05 were considered statistically significant.
ACKNOWLEDGMENTS
This study was supported by the Liaoning Providence science and technology project (2015225025 to Yan-Hong Huang) and Shenyang science and technology project (F15-139-9-09 to Yan-Hong Huang). This study was supported by the Natural Science Foundation of China (No. 81602918 to Qi-Jun Wu), the Doctoral Start-up Foundation of Liaoning Province (No. 201501007 to Qi-Jun Wu), and the fund project of Public welfare scientific research of Science and Technology Department of Liaoning Province (No. 201500100 to Cheng-Zhi Jiang).
Qi-Jun Wu was supported by the Fogarty International Clinical Research Scholars and Fellows Support Center at the Vanderbilt Institute for Global Health, funded by the Fogarty International Center, NIH, through an R24 Training Grant (D43 TW008313 to Xiao-Ou Shu).
CONFLICTS OF INTEREST
The authors declare no competing financial interests.
Author contributions
T-NZ, T-TG, Y-LC, Q-JW, and Y-HH designed research; T-NZ, T-TG, Y-LC, Q-JW, YZ, C-ZJ, JL, L-LL, CZ, and Y-HH conducted research; T-NZ, T-TG, and Q-JW analyzed data; T-NZ, T-TG, Q-JW, YZ, and Y-HH wrote the draft; All authors read, reviewed and approved the final manuscript. Q-JW had primary responsibility for final content.
T-NZ and T-TG contributed equally to this work.
REFERENCES
1. Li X, Zhu J, Wang Y, Mu D, Dai L, Zhou G, Li Q, Wang H, Li M, Liang J. Geographic and urban-rural disparities in the total prevalence of neural tube defects and their subtypes during 2006-2008 in China: a study using the hospital-based birth defects surveillance system. BMC Public Health. 2013; 13:161.
2. Garne E, Loane M, Dolk H, De Vigan C, Scarano G, Tucker D, Stoll C, Gener B, Pierini A, Nelen V, Rosch C, Gillerot Y, Feijoo M, Tincheva R, Queisser-Luft A, Addor MC, et al. Prenatal diagnosis of severe structural congenital malformations in Europe. Ultrasound Obstet Gynecol. 2005; 25:6-11.
3. Boyd PA, Devigan C, Khoshnood B, Loane M, Garne E, Dolk H. Survey of prenatal screening policies in Europe for structural malformations and chromosome anomalies, and their impact on detection and termination rates for neural tube defects and Down's syndrome. BJOG. 2008; 115:689-696.
4. Khoshnood B, Greenlees R, Loane M, Dolk H. Paper 2: EUROCAT public health indicators for congenital anomalies in Europe. Birth Defects Res A Clin Mol Teratol. 2011; 91:S16-S22.
5. Padmanabhan R. Etiology, pathogenesis and prevention of neural tube defects. Congenit Anom (Kyoto). 2006; 46:55-67.
6. Recommendations for the use of folic acid to reduce the number of cases of spina bifida and other neural tube defects. MMWR Recomm Rep. 1992; 41:1-7.
7. Zaganjor I, Sekkarie A, Tsang BL, Williams J, Razzaghi H, Mulinare J, Sniezek JE, Cannon MJ, Rosenthal J. Describing the Prevalence of Neural Tube Defects Worldwide: A Systematic Literature Review. PloS one. 2016; 11:e151586.
8. Chen G, Pei LJ, Huang J, Song XM, Lin LM, Gu X, Wu JX, Wang F, Wu JL, Chen JP, Liu JF, Xin RL, Zhang T, Zheng XY. Unusual patterns of neural tube defects in a high risk region of northern China. Biomed Environ Sci. 2009; 22:340-344.
9. Li Y, Liu XH, Wang FY, Zhao XL, Zhang X, Zhang YP. Analysis of the birth defects among 61 272 live born infants in Beijing. Beijing Da Xue Xue Bao. 2009; 41:414-417.
10. Liu J, Zhang L, Li Z, Jin L, Zhang Y, Ye R, Liu J, Ren A. Prevalence and trend of neural tube defects in five counties in Shanxi province of Northern China, 2000 to 2014. Birth Defects Res A Clin Mol Teratol. 2016; 106:267-274.
11. Onrat ST, Seyman H, Konuk M. Incidence of neural tube defects in Afyonkarahisar, Western Turkey. Genet Mol Res. 2009; 8:154-161.
12. Europe Surveillance of Congenital Anormalies (EUROCAT). Prevalence Tables. 2012. Available from: http://www.eurocat-network.eu/accessprevalencedata/prevalencetables. (Accessed on 3/January/2017).
13. Collins JS, Atkinson KK, Dean JH, Best RG, Stevenson RE. Long term maintenance of neural tube defects prevention in a high prevalence state. J Pediatr. 2011; 159:143-149.
14. van der Put NM, Eskes TK, Blom HJ. Is the common 677C-->T mutation in the methylenetetrahydrofolate reductase gene a risk factor for neural tube defects? A meta-analysis. QJM. 1997; 90:111-115.
15. Wilcken B, Bamforth F, Li Z, Zhu H, Ritvanen A, Renlund M, Stoll C, Alembik Y, Dott B, Czeizel AE, Gelman-Kohan Z, Scarano G, Bianca S, Ettore G, Tenconi R, Bellato S, et al. Geographical and ethnic variation of the 677C>T allele of 5,10 methylenetetrahydrofolate reductase (MTHFR): findings from over 7000 newborns from 16 areas world wide. J Med Genet. 2003; 40:619-625.
16. Li Z, Ren A, Zhang L, Guo Z, Li Z. A population-based case-control study of risk factors for neural tube defects in four high-prevalence areas of Shanxi province, China. Paediatr Perinat Epidemiol. 2006; 20:43-53.
17. Li Z, Zhang L, Ye R, Pei L, Liu J, Zheng X, Ren A. Indoor air pollution from coal combustion and the risk of neural tube defects in a rural population in Shanxi Province, China. Am J Epidemiol. 2011; 174:451-458.
18. Padula AM, Tager IB, Carmichael SL, Hammond SK, Lurmann F, Shaw GM. The association of ambient air pollution and traffic exposures with selected congenital anomalies in the San Joaquin Valley of California. Am J Epidemiol. 2013; 177:1074-1085.
19. Khoshnood B, Loane M, de Walle H, Arriola L, Addor MC, Barisic I, Beres J, Bianchi F, Dias C, Draper E, Garne E, Gatt M, Haeusler M, Klungsoyr K, Latos-Bielenska A, Lynch C, et al. Long term trends in prevalence of neural tube defects in Europe: population based study. BMJ. 2015; 351:h5949.
20. Atta CA, Fiest KM, Frolkis AD, Jette N, Pringsheim T, St GC, Rajapakse T, Kaplan GG, Metcalfe A. Global Birth Prevalence of Spina Bifida by Folic Acid Fortification Status: A Systematic Review and Meta-Analysis. Am J Public Health. 2016; 106:e24-e34.
21. Ren AG. Prevention of neural tube defects with folic acid: The Chinese experience. World J Clin Pediatr. 2015; 4:41-44.
22. Khoury MJ, Erickson JD, James LM. Etiologic heterogeneity of neural tube defects: clues from epidemiology. Am J Epidemiol. 1982; 115:538-548.
23. Wu QJ, Li LL, Li J, Zhou C, Huang YH. Time trends of neonatal mortality by causes of death in Shenyang, 1997-2014. Oncotarget. 2016; 7:16610-16618. doi: 10.18632/oncotarget.7670.
24. Huang YH, Wu QJ, Li LL, Li D, Li J, Zhou C, Wu L, Zhu J, Gong TT. Different extent in decline of infant mortality by region and cause in Shenyang, China. Sci Rep. 2016; 6:24527.
25. Xu L, Li X, Dai L, Yuan X, Liang J, Zhou G, Li Q, He C, Miao L, Wang Y, Zhu J. Assessing the trend of gastroschisis prevalence in China from 1996 to 2007 using two analytical methods. Birth Defects Res A Clin Mol Teratol. 2011; 91:177-184.
26. Gong TT, Wu QJ, Chen YL, Jiang CZ, Li J, Li LL, Liu CX, Li D, Zhou C, Huang YH. Evaluating the time trends in prevalence of exomphalos in 14 cities of Liaoning province, 2006 to 2015. Sci Rep. 2016; 6:32901.
27. Li N, Chen YL, Li J, Li LL, Jiang CZ, Zhou C, Liu CX, Li D, Gong TT, Wu QJ, Huang YH. Decreasing prevalence and time trend of gastroschisis in 14 cities of Liaoning Province: 2006-2015. Sci Rep. 2016; 6:33333.