
INTRODUCTION
Brain tumors are the leading cause of cancer-related mortality and morbidity in children, adolescents and young adults. With the refinement of the diagnostic criteria, gliomas now represent the most frequent type of malignant brain tumors [1]. Diffuse intrinsic pontine glioma (DIPG) is one of the most frequent pediatric high-grade glioma. The peak of onset is between 6 and 9 years of age although adolescents and young adults may be affected [2], and the median overall survival of DIPG patients is below 1 year after diagnosis [3]. Because of its infiltrative phenotype and location in an eloquent area of the brainstem, the tumor is unresectable. Diagnosis is usually made on a typical magnetic resonance imaging (MRI) appearance associated with a short clinical history (<6 months). Radiation therapy is only transiently efficient and classical chemotherapy is generally not effective [4, 5].
The recent identification in midline pediatric glioma and in particular in DIPG, of a specific point mutation in H3F3A, HIST1H3B/C, HIST2H3A/C histone genes –leading to the replacement of a lysine by a methionine at position 27, has set the basis for a molecular definition of these gliomas [6–8]. This H3-K27M mutation impairs the function of polycomb repressive complex 2 and leads to a global decrease of H3K27 trimethylation in 95% of DIPG samples, reflecting a profound change in the epigenetic landscape of the tumor cells [9–11]. This alteration was chosen to define a new tumor entity in the WHO 2016 classification of brain tumor corresponding to Midline infiltrative tumors with H3-K27M mutation, and the associated loss of H3K27 trimethylation could be considered as a driving oncogenic event [12].
If autopsies and stereotactic biopsies of DIPG have recently shed some light on the possible driver mutations, the lack of biological material from DIPG also hampered the development of relevant models mimicking the disease that are crucial to better understand the underlying biology and to evaluate potential new therapeutics [6, 7, 9]. This led some research groups to study the in vivo oncogenesis of the tumor through different genetically-engineered mouse models (GEMM) [13, 14]. However, these models are based on the introduction of a limited number of alterations, which are not always found in primary DIPG tumor as for example PDGFB overexpression to mimic PDGFRA amplification that is especially observed at autopsy. Consequently, it can be questioned whether these models would best recapitulate the disease or if alternative models have to be generated to complete the set of tools to explore DIPG biology.
An alternative to the aforementioned mouse models is the development of cell-derived orthotopic xenograft (CDOX) and patient-derived orthotopic xenograft (PDOX) from patient material. CDOX models were generated by stereotactic injections of cultured cells carrying the histone H3-K27M driver mutation established from DIPG autopsies [15]. More recently, a group successfully developed one PDOX model after direct injection of autopsy DIPG tumor cells [16]. Both types of models showed an infiltrative phenotype, an important characteristic of these neoplasms. However, the biology of the tumor at autopsy may have been substantially altered by the treatment, especially radiotherapy, as shown by the accumulation of new mutations in comparison with biopsy samples, precluding its relevance compared to the tumor at diagnosis. Indeed, genomic alterations in DIPG are more abundant and qualitatively different at diagnosis and at autopsy. The average mutation rate detected at the time of the autopsy is 3.12 somatic mutations per megabase [17] while it is 0.76 at diagnosis [18]. With respect to the type of genomic aberrations, PDGFRA gain/amplification are twice more frequent in autopsy samples [17, 19, 20] than they are at diagnosis [18, 21]. Similarly, ATRX mutations are rare at diagnosis (absent from the sequencing data of Taylor et al. [18]) while they are more common at the time of the autopsy [17]. ACVR1 mutations were described in all autopsy H3.1-K27M tumors [7] while they were not present in every H3.1-K27M tumors at diagnosis [8]. Such pre-clinical models might thus have a distinct resistance to drugs compared to a treatment-naïve tissue, as well as a potentially altered invasive and migratory phenotypes.
Systematic stereotactic biopsies were re-introduced as a part of the histopathological and molecular diagnosis of DIPG [3]. We took advantage of this treatment-naïve biological material for pre-clinical model establishment representing the disease at the earliest stages possible. The aim of our study was to establish a variety of DIPG xenografts to cover the heterogeneity of DIPG encountered in patients. This is crucial to be able to understand the behavior of the different subtypes of DIPG and generalize the findings from new therapeutics testing. Two methods, direct or indirect xenografting, were tested. Biopsies were either directly xenografted in the thalamus or pons of nude mice, or in parallel cultured in vitro, labeled and subsequently injected in the pons of nude mice. These 2 types of pre-clinical models are valuable tools to assess new approaches in this incurable disease as they reflect the primary biopsy in terms of histologic features and expression of classical histopathology markers as well as they reflect the inter-biological differences between patients.
RESULTS
Description and processing of the stereotactic biopsy samples
During the course of the study, eighteen patients diagnosed with DIPG were biopsied by stereotaxy (Table 1). This cohort of DIPG has a balanced sex distribution with 9 males and 9 females, a median age at diagnosis of 6 years, and 14/16 children died within the first 2 years after diagnosis (1 patient still alive and 1 was lost to follow-up). Moreover, in all primary tumors, immunohistochemistry analysis showed the expression of a histone H3-K27M mutated protein and the H3K27 trimethylation loss as previously defined as hallmarks of DIPG [8].
Table 1: Summary of the molecular & clinical characteristics of DIPG patients and observed tumorigenicity in the corresponding murine models
Patient ID |
Histone H3 mutation status |
TP53 mutation status |
ACVR1 mutation status |
Patient |
TIC |
PDOX model |
CDOX model |
|||
|---|---|---|---|---|---|---|---|---|---|---|
Gender |
Age |
Survival (days) |
Thalamus |
Pons |
Pons |
|||||
NEM270 |
H3F3A K27M |
R273C |
WT |
M |
10.2 |
313 |
Y |
- |
- |
0/10 |
NEM271 |
HIST1H3B K27M |
WT |
Q207E |
F |
4.4 |
499 |
Y |
- |
- |
0/10 |
NEM273 |
HIST1H3B K27M |
WT |
G328E |
M |
4.6 |
279 |
Y |
- |
- |
3/4 |
NEM276 |
H3F3A K27M |
N.D. |
N.D. |
F |
6.2 |
287 |
Y |
- |
- |
0/10 |
NEM284 |
H3F3A K27M |
W91* |
WT |
F |
9.3 |
105 |
N |
0/2 |
- |
- |
NEM285 |
H3F3A K27M |
A159V |
WT |
M |
7.1 |
241 |
Y |
20/22 |
3/3 |
5/5 |
NEM289 |
HIST2H3A K27M |
W146* |
WT |
M |
4.7 |
262 |
Y |
27/29 |
8/8 |
5/5 |
NEM290 |
H3F3A K27M |
R175H |
WT |
F |
11.6 |
81 |
Y |
39/40 |
10/12 |
25/26 |
NEM292 |
H3F3A K27M |
P151T |
WT |
F |
5.1 |
152 |
Y |
- |
- |
21/26 |
NEM323 |
H3F3A K27M |
C96Y |
WT |
M |
5.8 |
269 |
Y |
0/2 |
- |
- |
NEM324 |
HIST1H3B K27M |
N.D. |
N.D. |
M |
1.4 |
Alive |
Y |
0/2 |
0/1 |
- |
NEM325 |
H3F3A K27M |
WT |
WT |
F |
5.5 |
101 |
Y |
4/7 |
9/9 |
0/5 |
NEM328 |
HIST1H3B K27M |
WT |
G328V |
F |
3.5 |
289 |
Y |
11/12 |
9/12 |
5/5 |
NEM335 |
H3F3A K27M |
R248Q |
WT |
M |
6.2 |
575 |
Y |
10/13 |
3/6 |
0/5 |
NEM336 |
HIST1H3B K27M |
WT |
G328V |
M |
4.1 |
536 |
Y |
0/2 |
0/1 |
- |
NEM341 |
H3F3A K27M |
WT |
WT |
F |
8.3 |
L.T.F. |
Y |
0/2 |
0/1 |
- |
NEM347 |
H3F3A K27M |
R273C |
WT |
M |
9.1 |
294 |
Y |
5/5 |
4/4 |
- |
NEM353 |
H3F3A K27M |
WT |
WT |
F |
6.5 |
385 |
Y |
2/2 |
1/1 |
- |
For each DIPG patient, the Histone H3, TP53 and ACVR1 mutation status are displayed, together with the demographic and survival data. In the right part of the table, xenografting data are summarized for both direct (PDOX) and indirect (CDOX) strategies. The tumorigenicity is presented as the number of mice presenting tumors over the total number of injected mice. Tumor initiating cells (TICs) that could be successfully cultured from patient biopsies are indicated.
N.D: not determined; L.T.F: lost to follow-up; WT: wild-type; Y/N: yes/no.
Sanger sequencing or Whole Exome Sequencing identified a histone H3 gene mutated in the codon of Lysine 27 in all the tumor samples, resulting in a Lysine to Methionine substitution in either H3F3A for 13/18 of cases (72%), HIST1H3B for 4/18 cases (22%), or HIST2H3A/C for the remaining case (6%) (Table 1 and Supplementary Figure 1).
Establishment of cell-derived orthotopic xenograft models in the brain of Swiss/nude mice
Half of the dissociated primary tumor was used to develop in vitro cellular models (Figure 1). All eighteen biopsies but one led to primary cell proliferation under these conditions (Table 1). The resulting tumor-initiating cells (TICs) were transduced and xenografted around passage 10 into the pons of 5 nude mice, to establish CDOX. Transduction did not alter the proliferation rate and morphology of TICs (data not shown). For the 4 initial TICs grafting experiments, we injected tumor cells in parallel in five distinct NOD scid gamma (NSG) and nude mice. The take rates were similar in both mice strains with only 1/4 TICs that was tumorigenic.
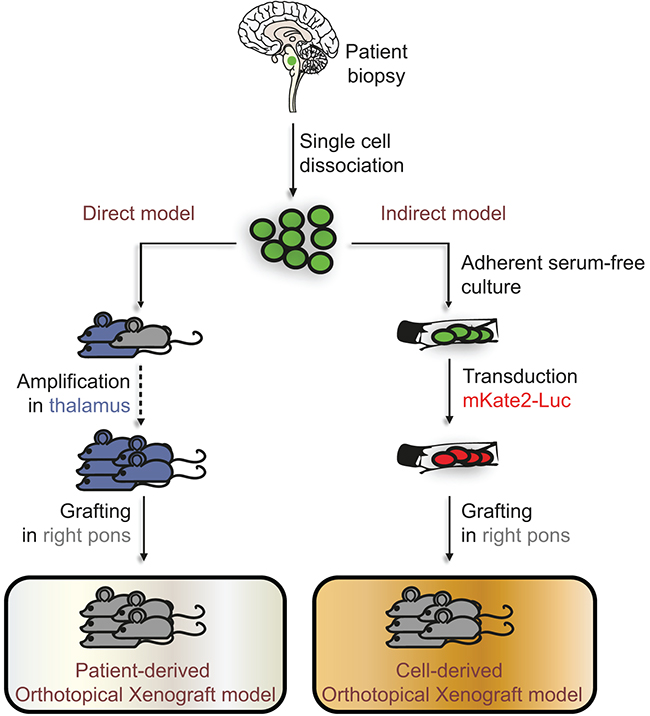
Figure 1: Direct and indirect models developed to study DIPG in vivo. Tumors originating from the pons of DIPG patients were biopsied and dissociated into a single-cell suspension. Whenever possible, half of the cells were used in the direct model for xenografting into the thalamus of 2 nude mice (in blue), and for latest sample also in the pons of one nude mouse (in grey), constituting the patient-derived orthotopical xenograft models (PDOX). Once a mouse developed neurological symptoms or lost weight, it was sacrificed and the dissociated tumor re-implanted into the thalamus of several other mice to allow the amplification of the tumor cell pool. This method allows the in vivo expansion of cancer cells as well as their banking. After 3 successive passages, mice are grafted in the pons. In parallel to the direct injection into the brain, the remaining half of the cell suspension obtained from biopsies was cultured in adherent serum-free conditions. After several passages required for banking, the resulting tumor-initiating cells (TICs) were transduced to express the mKate2 and Firefly Luciferase proteins, and then grafted into the pons of nude mice. These indirect models constitute the cell-derived orthotopical xenografts (CDOX). Green-colored and red-colored cells on the scheme represent the mutated cells found in the biopsy and the mutated cells after transduction of the mKate2-Luc construct, respectively.
In total, 11 distinct TICs were xenografted, leading to tumor development in 6 cases and no tumor growth in 5 cases. Consequently, the success rate of CDOX model development can be currently evaluated around 54.5%. Among the six CDOX models that gave rise to tumor, the overall take rate was 90% (n=64/71), taking into account all the injected mice at all passages.
Successful establishment and long-term maintenance by in vivo serial transplantation of patient-derived orthotopic xenograft models in the brain of Swiss/Nude mice
In parallel to the indirect model, as of NEM284, the second half of the single-cell suspension obtained from the patient biospy was directly grafted into the thalamus of several nude mice to allow the expansion of the tumor in vivo (Figure 1). For the 8 most recent samples, the tumor cell suspension was also injected in the pons. Once a tumor developed, as suspected when mice became symptomatic, brains were dissected and divided in two following the sagittal plane. Tumor transplantation and banking were performed using the injected side containing most of tumor cells. Histological plus immunohistochemical analyses were performed on the contralateral side to confirm the presence of tumor cells on the same brain. These serial transplantations were repeated until passage 3 in order to significantly amplify in situ the initial pool of cancer cells and allow for sample banking. For subsequent passages, cells were xenografted into the right part of the pons of nude mice (Supplementary Table 1).
In total, 8 out of 13 (61.5%) DIPG biopsies were successfully xenografted. In these cases, all replicate mice showed a tumor at first passage. Efficient transplantation from mouse to mouse was achieved, and the rate of tumorigenicity for subsequent passages remained high (91% and 84% for thalamic and pontine injection, respectively). Also, transplanting frozen cells did not significantly decrease the take rate after injection in both locations (85,7% with n=21 and 100% with n=7 for thalamic and pontine xenograft, respectively). However, the survival time was increased in 3 out 5 cases (P<0.01, T-test; Supplementary Table 1).
Survival time comparison between patients and CDOX / PDOX models
Survival time of mice xenografted in the pons varied greatly between the different models, from 80 ±12 days to 299 ±12 days for PDOX, and from 67 ±6 days to 267 ± 28 days in the case of CDOX (Table 2). However, CDOX were highly reproducible with respect to the time to symptoms outbreak in a given model (Table 2). Also, the time to reach end-points tended to be more similar from mouse to mouse for a particular model at a given passage in the case of PDOX models (Supplementary Table 1). Moreover, survival data were overall similar between the subsequent passages of PDOX, with the exception of the first grafting (P0) in several cases.
Table 2: Biological properties and histologic features of primary tumor and corresponding in vitro and in vivo models
Patient ID |
Sample Type |
Histone H3 mutation status |
Mitotic index |
Extracellular edema |
Doubling time (days) |
Max. passage reached |
Survival time (days) |
Comparison of CDOX and PDOX survival |
|
|---|---|---|---|---|---|---|---|---|---|
Location |
Grading |
||||||||
NEM273 |
Patient |
H3.1-K27M |
43.7 ±8.3 |
Pericellular & along axons |
2 |
- |
- |
279 |
- |
TICs |
H3.1-K27M |
N.D. |
- |
- |
2.79 |
10 |
- |
||
CDOX |
H3.1-K27M |
25.9 ±4.2 |
Along axons |
3 |
11.7 ±1 |
3 |
239 ±19 |
||
NEM285 |
Patient |
H3.3-K27M |
24.5 ±0.10 |
Along axons |
1 |
- |
- |
241 |
- |
TICs |
H3.3-K27M |
N.D. |
- |
- |
2.39 ±0.2 |
10 |
- |
||
CDOX |
H3.3-K27M |
N.D. |
N.D. |
N.D. |
15.2 ±1.1 |
N.D. |
199 ±25 |
N.S (P=0.25) |
|
PDOX |
H3.3-K27M |
N.D. |
N.D. |
N.D. |
N.D. |
4 |
123 ±6 |
||
NEM289 |
Patient |
H3.2-K27M |
16.8 ±1.9 |
Pericellular & along axons |
2 |
- |
- |
262 |
- |
TICs |
H3.2-K27M |
N.D. |
- |
- |
2.15 ±0.17 |
10 |
- |
||
CDOX |
H3.2-K27M |
19.6 ±4.5 |
Pericellular |
1 |
19.1 ±1.1 |
N.D. |
249 ±21 |
N.S (P=0.0625) |
|
PDOX |
H3.2-K27M |
N.D. |
Pericellular |
2 |
N.D. |
4 |
102 ±9 |
||
NEM290 |
Patient |
H3.3-K27M |
18.7 ±5.9 |
Pericellular |
2 |
- |
- |
81 |
- |
TICs |
H3.3-K27M |
N.D. |
- |
- |
2.06 ±0.36 |
15 |
- |
||
CDOX |
H3.3-K27M |
20.2 ±4.4 |
Pericellular |
1 |
10.9 ±1.4 |
1 |
135 ±4 |
** (P=0.0058) |
|
PDOX |
H3.3-K27M |
20.6 ±9.4 |
Along axons |
1 |
N.D. |
5 |
80 ±12 |
||
NEM292 |
Patient |
H3.3-K27M |
24.7 ±17.9 |
Pericellular |
1 |
- |
- |
152 |
- |
TICs |
H3.3-K27M |
N.D. |
- |
- |
1.92 ±0.06 |
15 |
- |
||
CDOX |
H3.3-K27M |
27.4 ±4.8 |
Pericellular & along axons |
3 |
7.4 ±0.4 |
N.D. |
67 ±6 |
||
NEM325 |
Patient |
H3.3-K27M |
25.0# |
Pericellular & along axons |
3 |
- |
- |
102 |
- |
TICs |
H3.3-K27M |
N.D. |
- |
- |
3.57 ±0.08 |
4 |
- |
||
PDOX |
H3.3-K27M |
24.4 ±4.7 |
Pericellular & along axons |
2 |
N.D. |
1 |
299 ±12 |
||
NEM328 |
Patient |
H3.1-K27M |
50.0# |
Pericellular |
3 |
- |
- |
289 |
- |
TICs |
H3.1-K27M |
N.D. |
- |
- |
2.66 ±0.33 |
10 |
- |
||
CDOX |
H3.1-K27M |
N.D. |
Pericellular & along axons |
3 |
19.4 ±4.4 |
N.D. |
267 ±28 |
N.S (P=0.125) |
|
PDOX |
H3.1-K27M |
17.1 ±5 |
Pericellular |
2 |
N.D. |
3 |
179 ±32 |
||
NEM335 |
Patient |
H3.3-K27M |
30.0# |
N.D. |
N.D. |
- |
- |
575 |
- |
TICs |
H3.3-K27M |
N.D. |
- |
- |
3.6 |
4 |
- |
||
PDOX |
H3.3-K27M |
28.3 ±5.1 |
Pericellular |
2 |
N.D. |
3 |
130 ±4 |
||
NEM347 |
Patient |
H3.3-K27M |
40.0# |
Along axons |
2 |
- |
- |
294 |
- |
TICs |
H3.3-K27M |
N.D. |
- |
- |
3.42 |
2 |
- |
||
PDOX |
H3.3-K27M |
N.D. |
Pericellular & along axons |
2 |
N.D. |
2 |
121 ±4 |
||
NEM353 |
Patient |
H3.3-K27M |
14.7 ±3.5 |
Pericellular & along axons |
3 |
- |
- |
385 |
- |
TICs |
H3.3-K27M |
N.D. |
- |
- |
1.97 ±0.48 |
4 |
- |
||
PDOX |
H3.3-K27M |
N.D. |
Pericellular |
2 |
N.D. |
1 |
81 (P0) |
||
Genotypes of H3 genes resulting from either Sanger or WES sequencing was summarized for all samples. Mitotic indexes were computed using the percentage of MIB-1 positive cells over total nuclei. When scans were not available for primary tumors, data were extracted from the pathologist reports. The extracellular localization of edema was indicated and its magnitude was graded by the pathologist using a scale ranging from 0 to 3. The maximum passage reached with TICs in culture was indicated, as well as the maximum serial transplant performed in mice. Survival time of xenografted mice was estimated only after pontine injection. Differences in survival time between CDOX & PDOX for each model and tumor location were statistically tested (**P<0.01, T-test).
N.D: not determined; N.S: not significant.
We then thought to compare the survival time in mouse models and corresponding patients. Interestingly, we observed a statistically significant correlation between patients and the six CDOX presenting tumors (r=0.839; P=0.037; Pearson correlation test). In contrast, neither a correlation nor a trend was found for PDOX models (r=-0.24, P=0.61). Lastly, comparing the two kinds of models on the four available pairs, we noticed that the survival time was always shorter for PDOX than for CDOX models from one particular patient. This however appeared statistically significant only for NEM290 (Table 2).
PDOX and CDOX models display hallmarks of primary human DIPG
For all type of xenografts that showed tumor development, mice presented brutal weight loss (>20% in few days) and/or neurological symptoms onset such as limb weaknesses, impaired motility or tilted head.
First, we assessed the maintenance of histone H3-K27M mutation –present in the human primary tumor, in cultured TICs before transplantation and in murine tumors by Sanger sequencing (Supplementary Figure 1). Single Tandem Repeats (STR) analyses performed in parallel on patient blood samples and on the corresponding mouse tumors confirmed the unique genetic identity of all xenografts (Supplementary Table 2) and the human origin of the tumors that developed in mice.
Additionally, the H&E staining allowed the detection of tumor cells with dense and irregular nuclei in the brainstem both of the patient and mice samples (Figure 2A-2C and Supplementary Figure 2). Moreover, the detection of the K27M-mutated histone H3 by IHC showed a strong positivity throughout the pons in the 12 xenograft models we could test (Figure 2D-2F, Supplementary Figures 3A-3B and 4), as well as the associated H3K27 trimethylation loss (Figure 2G-2I and Supplementary Figure 3C-3D). The use of a human-specific MIB-1 antibody confirmed the presence of proliferating cells of human origin in all tested xenograft samples (10/14 models) in the same area as K27M mutated cells. We observed a mixture of tumor positive-cells and normal negative-cells in mice brains (Figure 3A-3C and Supplementary Figure 5). Of note, the mitotic indexes appeared mostly similar in the xenograft models as compared to the primary biopsies (Table 2).
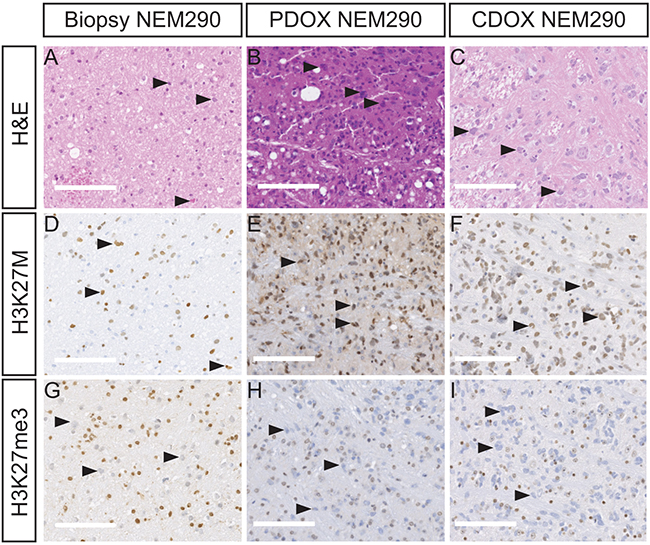
Figure 2: PDOX and CDOX NEM290 models display DIPG hallmarks. Representative results of Hematoxylin & Eosin colorations A-C. and IHC staining for H3-K27M D-F. or H3K27 trimethylation mark G-I. in the tumor biopsy NEM290 and the corresponding PDOX and CDOX. In all three cases, H&E and IHC allowed the detection of abnormally-shaped nuclei, tumor cells positive for the histone mutation K27M as well as cells losing the trimethylation marks at position 27 of histone H3, thus showing the conservation of the DIPG hallmarks in the PDOX and CDOX mouse models. Arrowheads in the different panels highlight example of characteristic tumor cells. (Scale bars: 125 µm).
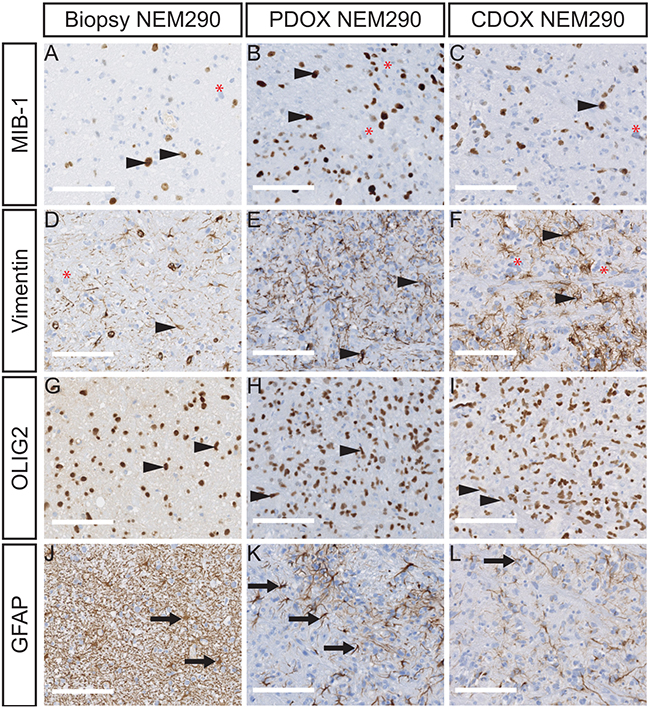
Figure 3: PDOX and CDOX NEM290 models harbor consistent histopathological features of the DIPG tumor of origin. Representative microphotograph of NEM290 tumor biopsy and sagittal sections of PDOX & CDOX corresponding models labelled for MIB-1 A-C., Vimentin D-F., OLIG2 G-I. and GFAP J-L. The staining for MIB-1 and Vimentin show both positive and negative tumor cells in all samples, reflecting the phenotypic tumor heterogeneity. OLIG2 positivity is pervasive in both normal and tumor cell compartments. High GFAP levels were mainly detected in reactive astrocytes in all samples, but a stronger staining on basal human stromal cells was observed in the biopsy sample. Arrowheads indicate positive tumor cells. Red asterisks indicate negative tumor cells. Arrows indicate normal parenchymal cells. (Scale bars: 125 µm).
More importantly, these staining highlighted the presence of intermingled tumor and normal stromal cells, thus confirming that CDOX and PDOX models recapitulate the main histological hallmark of DIPG with an extensive infiltration of the brain parenchyma by tumor cells without formation of a tumor mass and without neovascularization. Likewise, mouse xenografts displayed moderate to high extracellular edema, as observed in the primary tumor, pericellular or along the axonal stream (Table 2 and Supplementary Figure 2).
The immunophenotype of the human tumor is conserved in mouse xenograft models
The additional labeling of proteins currently used for DIPG diagnostic purposes were performed in parallel on primary tumors and both NEM290 and NEM292 xenograft models. We first stained the intermediate filament Vimentin, a known marker of neural stem cells and early glial progenitors, also detected in gliomas and reactive astrocytes, but barely expressed in the normal brain [22] (Figure 3D-3F). We observed in the models an expression of Vimentin in tumor cells recapitulating the primary tumor and confirming the glial phenotype of the cancer cells. Strikingly, not all tumor cells expressed the marker both in the primary tumor and the models, pointing to a phenotypical intra-tumor heterogeneity. The oligodendrocyte precursor marker OLIG2, which is common to all DIPG, was robustly detected in most if not all tumor cells in primary human and mouse xenograft DIPG samples (Figure 3G-3I). Lastly, the staining of the astrocytic intermediate filament GFAP antibody labeled all reactive and stromal astrocytes in the biopsy. Because of the higher antibody affinity for the human protein, it only detected cells highly expressing GFAP, i.e. mouse reactive astrocytes, in the infiltrated parenchyma (Figure 3J-3L). Outside of these areas, the staining was mostly negative (except in the subpial space; data not shown). These results indicate that we could recapitulate the reactive stroma in the xenograft model as observed in primary human tumors. Similar results were obtained in the case of NEM292 (Supplementary Figure 3). Overall, all these staining confirmed the infiltrative nature of an oligo-astrocytic neoplasm of human origin without tumor mass formation, that showed identical features of differentiation, biomarker heterogeneity and reactive astrogliosis found in the primary DIPG. Also, all staining showed identical results for both direct (PDOX) and indirect (CDOX) NEM290 xenografting approaches.
Infiltration of the brain parenchyma and dissemination of DIPG tumor cells
IHC labeling of H3-K27M protein on sagittal sections allowed us to investigate the location of tumor cells in the whole brain. Indeed, H3-K27M positive-cells were detected in the entire pons – beyond the injection site, mixed with unlabeled normal cells in both PDOX and CDOX models (Figure 2D-2F and Figure 4). There was an expansion of the cancer cells without any tumor mass formation thus highlighting a pairing of the infiltration process with the tumor growth.
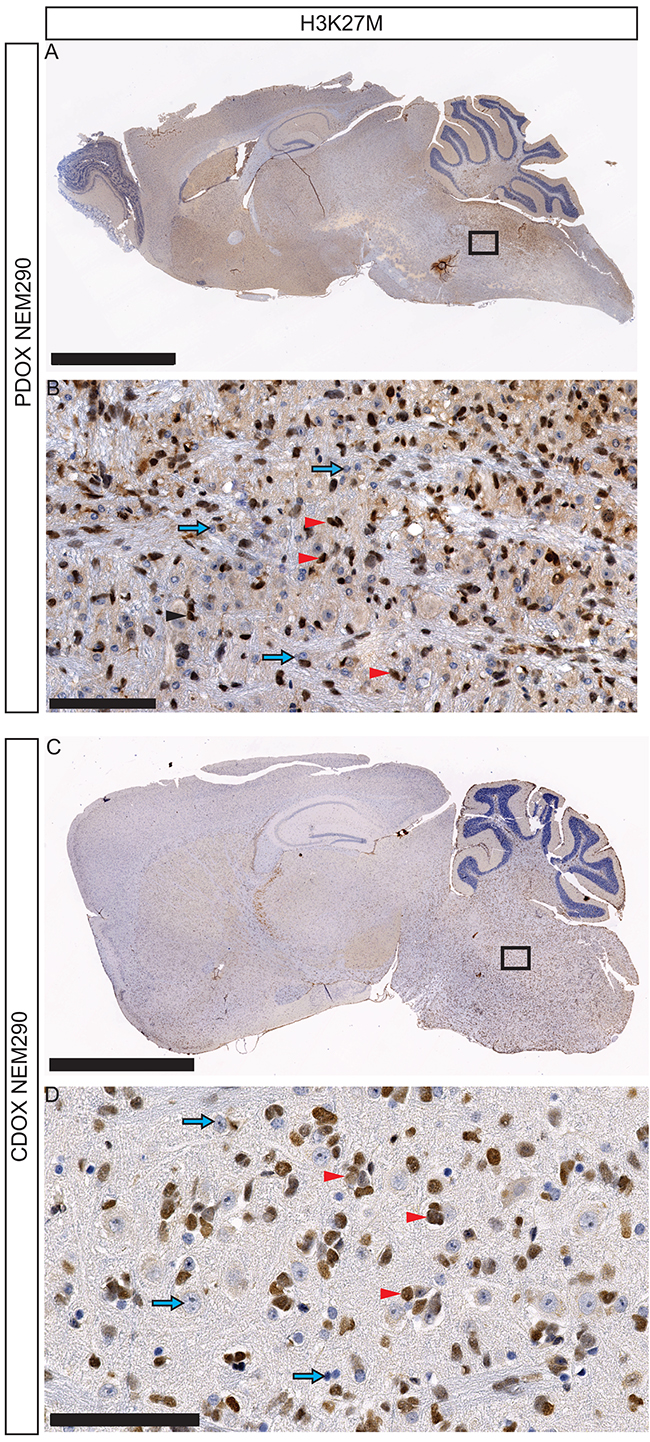
Figure 4: Invasion and dissemination of tumor cells within PDOX and CDOX models of NEM290. A. Representative low magnification microphotograph of a sagittal section of PDOX NEM290 stained for H3-K27M mutation (brown nuclei) and B. 30X close-up from the square region. C. H3-K27M immunostaining of a sagittal section of CDOX NEM290 and D. corresponding 30X magnification. An invasion around the injection point in the pons, toward the cerebellum and the rostral axis is observed in both cases, as well as subpial and subventricular dissemination. (Scale bars: A and C, 2.5 mm; B and D, 100 µm). Red arrowheads indicate positive tumor cells; blue arrows indicate negative non-tumor cells.
The full sagittal sections showed that H3-K27M positive-cells were not restricted to the pons but infiltrated massively toward the rostral axis of the brain, the cerebellum, the subpial space, the cortex and the thalamus (Figure 4, Supplementary Figures 6-9). We observed to a lesser extent infiltration in the spinal cord (data not shown). Interestingly, in approximately 30% of injected mice, tumor cells also migrated in the olfactory bulbs through a ventral path along the meninges in lateral hypothalamic and olfactory stream areas (Supplementary Figures 6 and 7).
Bioluminescence, fluorescence of CDOX models
A major advantage of CDOX models over PDOX is the possibility to longitudinally monitor disease progression by bioluminescence and fluorescence imaging. We consequently assessed the in vivo tumor growth kinetics by recording the bioluminescence (BLI) signal every 15-25 days. The models tested showed an increase of the signal with a doubling time around 10.9 ±1.4 days (n= 3 mice) in the case of NEM290, and 7.4 ±0.4 days (n= 5 mice) in the case of NEM292 (Figure 5A-5D and Table 2). The bioluminescence curves for the 4 others CDOX models are presented in Supplementary Figure 10.
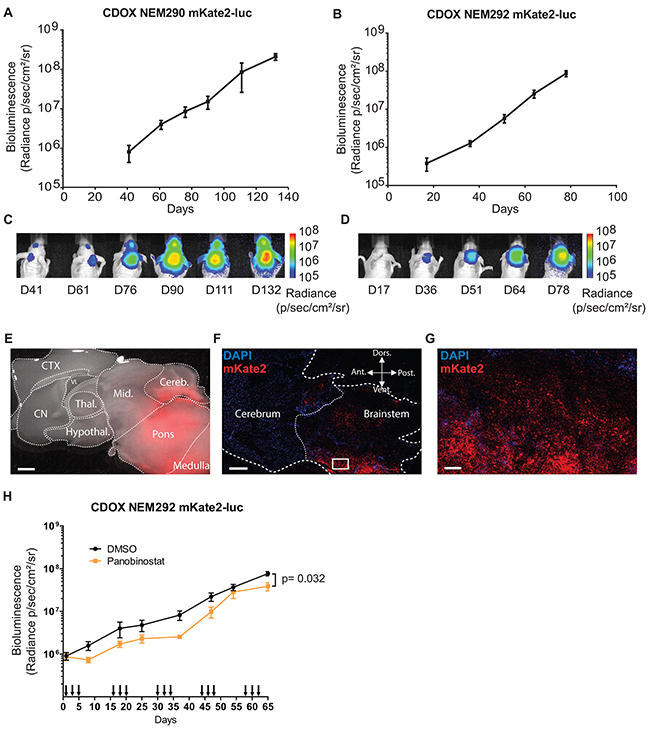
Figure 5: In vivo tumor growth can be monitored by bioluminescence and fluorescence. A-B. Longitudinal follow-up of tumor growth by quantification of the luciferase activity in the pontine region of CDOX NEM290 mKate2-luc and CDOX NEM292 mKate2-luc, respectively. Both models show a robust exponential growth of BLI. Results are represented as mean ±SEM (n=3 and n=5 replicate experiments). C-D. Corresponding representative images of bioluminescence in the aforementioned CDOX models. E. Overlay of bright-field and mKate2 fluorescence (red) microphotographs of a brain sagittal section of CDOX NEM292 at 5X magnification. Note the extensive infiltration and invasion towards the cerebellum and midbrain. (Scale bar: 1 mm). F. Confocal micrograph of a sagittal section of CDOX NEM292 with Hoechst (blue) and mKate2 (red) fluorescence at 10X magnification. (Scale bar: 1mm). G. 20X magnification of the square region highlighted in F, showing the infiltration of the parenchyma by tumor cells. (Scale bar: 100 µm). H. Preclinical evaluation of the activity of the panobinostat on DIPG tumor growth by longitudinal quantification of the luciferase activity in the pontine region of CDOX NEM292 mKate2-luc after panobinostat (n=7 mice) or DMSO (control vehicle, n=9 mice) injections. Panobinostat was administered I.P., three times a week at 10 mg/kg, every other week. Injections are indicated by arrows on the x-axis. Results are represented as mean ±SEM. *P < 0.05; Statistical permutation test (see methods). CTX: cortex; CN: cerebral nuclei; Thal.: thalamus; Hypothal.: hypothalamus; Mid.: midbrain; Cereb.: cerebellum; VL: lateral ventricle; Ant.: anterior; Vent.: ventral; Dors.: dorsal; Post.: posterior.
The proliferation rate in vivo was always lower compared to in vitro TICs, which doubled approximately every 2 or 3 days (Table 2). For CDOX NEM290 and NEM292, the models with the most important number of biological replicates, we observed the appearance of clinical symptoms, and thus the terminal stage of the disease, at the same BLI level (around 108 p/s/cm2/sr) in several distinct experiments. Besides, the additional CDOX models showed mostly equivalent BLI at end-stage (108-109 p/s/cm2/sr; Supplementary Figure 10).
Moreover, red fluorescence of cells in CDOX models allowed for the detection of the tumor location after brain excision by using macroscopic imaging of the whole brain, highlighting the extensive infiltration of the mouse brain (Figure 5E; Supplementary Figure 11). The tracking of tumor invasion at single cell resolution on slices by confocal microscopy highlighted the migratory stream of tumor cells in the brain (Figure 5F-5G). Also, dissociated tumor cells could be retrieved from the animal samples by FACS for subsequent analyses thanks to their fluorescence.
In order to demonstrate the value of these models to conduct preclinical drug evaluation by bioluminescence monitoring of tumor growth, we performed an in vivo evaluation of the effect of panobinostat, a drug known to be effective in DIPG [23]. We could confirm a moderate but statistically significant effect of panobinostat on CDOX NEM292 tumor growth (Figure 5H).
Blood-brain barrier integrity of CDOX models
Several reports have shown that a proportion of DIPG tumors at diagnosis present a relatively intact and functional blood-brain barrier (BBB) as assessed by MRI contrast enhancement [8, 24]. We thus tried to check the status of the BBB in the DIPG xenograft models. First, looking at hematoxylin & eosin staining, we did not observe a microvascular proliferation that would go along with compact tumor tissue or necrotic areas even at late stage of tumor development (Figure 2 and Supplementary Figure 12). Still, we probed the expression of GLUT1, which loss of expression in endothelial cells can accompany BBB disruption in several different pathophysiological conditions [25]. In both CDOX NEM290 and NEM292, we observed a staining of endothelial cells from vessels and capillaries in the brain parenchyma. However, the region of the brain infiltrated with tumor cells (pons) showed much less intense staining (Supplementary Figure 12). Given these discrepancies, we finally checked for a functional disruption of the BBB by assessing Evans blue dye extravasation after intravenous injection in normal and tumor bearing mice [26, 27]. As expected for control mice, the brain remained unstained, as opposed to other peripheral organs (such as kidney; Supplementary Figure 13A-13M). The same experiment conducted on CDOX NEM290 and NEM292 led to identical results, without evidence of blue dye diffusion in the brain and in particular in the infiltrated pons (Supplementary Figure 13).
Implanted tumors are detectable by ultra-high field MR-imaging
We finally investigated how MR-imaging modalities of DIPG were recapitulated in CDOX models. Indeed, T2-weighted MRI is one of the only non-invasive methods for DIPG diagnosis, showing an infiltration respecting the pontine fiber tracts and an inflated brainstem in patients. We performed ex-vivo T2-RARE (Rapid Acquisition with Relaxation Enhancement) MR acquisition at 11.7 Tesla in 3 different animals: the first showing an intermediate bioluminescence radiance signal at 107 (28 days post-graft), the second in a mouse reaching 108 (77 days post-graft) that we characterized as advanced stage of the disease, and a last non-injected control mouse. Only anatomical changes were observed due to the highly infiltrative nature of the tumor with a shift of the midline to the left in coronal and axial view, much more pronounced in the 108 BLI-positive mouse than in the 107 (Figure 6C, 6F vs. 6B, 6E). The inflation of the pons was also more prominent at higher BLI signal on sagittal panels (Figure 6H vs. 6I). We also noticed a slight hyperintensity in the right side of the brainstem corresponding to the site of injection on the axial panel (Figure 6F).
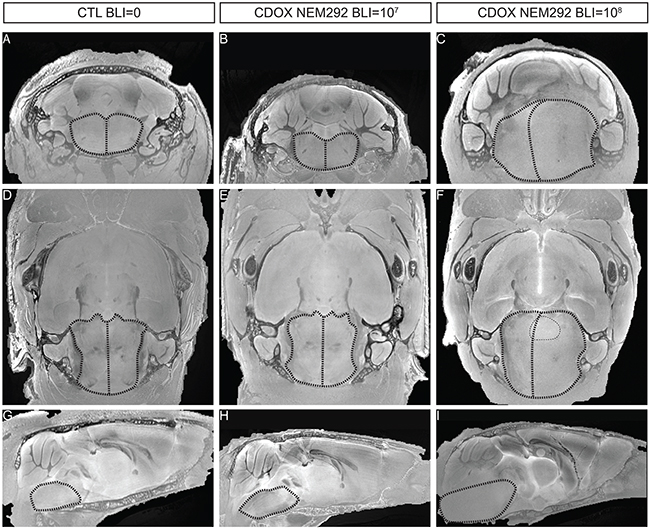
Figure 6: T2-sequence MRI modalities of DIPG are recapitulated in the brainstem of end-stage CDOX models. Anisotropic T2-sequence MR-Imaging at 11.2T of a non-grafted control mouse A, D, and G., CDOX NEM292 showing a 107 BLI level B, E, and H. and CDOX NEM292 showing a 108 BLI level C, F, and I. For visualization, images were focalized on the pons according to the coronal plane A, B, and C., the axial plane D, E, and F. and the sagittal plane G, H, and I. sections. Anatomical changes with a midline shift and pons hypertrophy were observed for the 108 BLI mouse only. A hyperintensity could also be observed in the pontine region (highlighted with dots in F). Brainstem and midline are depicted by dashed lines.
DISCUSSION
We show here that it is possible to derive xenografts from DIPG stereotactic biopsies performed at diagnosis with two distinct methods based either on the direct implantation of tumor cells right after the biopsy or after few passages in vitro (PDOX or CDOX, respectively). Tumor behavior in mice recapitulated the natural history of the disease with similar symptoms and a rapid onset after a long silent period [28]. The take rates of the different models using adult nude mice were high –even post-freezing of tumor cells, around 55-60% for both PDOX and CDOX, which is much higher than the take rate of other malignant pediatric tumors in our hands [29, 30]. Our xenografting results using NSG mice are however too limited to firmly conclude that these are not superior to nude mice in terms of take rate –especially for PDOX development. We did not observe differences in tumorigenicity between the direct and indirect xenografting methods (P=1; Fisher exact test). Also, xenograft take rate was not linked to the type of histone H3 mutated. We found a significant correlation between patient and CDOX survival, not retrieved in the comparison patient vs. PDOX. This discrepancy could originate from distinct number of injected cells between models that could not be controlled before injection in contrast with CDOX models. Besides, we observed that PDOX survival time tend to be shorter than CDOX which could reflect an impact of the stroma and microenvironment injected together with the tumor cells. There are few publications describing xenograft models of DIPG and only limited information is available in the literature on the best way to generate these models [15, 16, 31]. Most research groups inject the tumor cells from autopsies and not from stereotactic biopsies in NSG or nude mouse pups or NOD-scid adult mice, but most take rates and information about serial transplantations are not provided, thus limiting the possibility to compare the different strategies.
Detailed histo-pathological analyses demonstrated that PDOX and CDOX tumors look alike, indicating that in vitro selection of tumor-initiating cells (TICs) does not modify the phenotype of the xenografts and that TICs can recapitulate the entire tumor. Remarkably, only tumors of human origin were observed in our PDOX nude models from pre-treatment biospies, contrary to previous published reports using autopsy samples [31].
In depth analysis of the resulting tumors showed that the xenografts retained the phenotype of the patient’s tumor in particular the main hallmarks of DIPG, i.e. a mostly infiltrative phenotype without any tumor mass, the absence of neovascularization, a functional BBB and the conservation of the H3-K27M mutation identified in patients and the characteristic H3K27 trimethylation loss. In addition, we observed a close conservation in the expression of embryonal and neural differentiation genes (GFAP, OLIG2 or Vimentin), as well as similar proliferation indexes between the models and primary tumors. The phenotypic heterogeneity observed in primary DIPG, more strikingly defined by the presence or absence of Vimentin expression, was recapitulated. Similarly, both cycling and non-cycling tumor cells (i.e. MIB-1 negative) were identified in the models as in the patient tumor. Interestingly, the influence of the tumor on brain parenchyma was recapitulated in the mouse as shown by the presence of a reactive astrogliosis and pericellular edema.
A common evolution of the disease is the extensive invasion of DIPG cells in neighboring brain structures, or even in distant location. In late-stage xenograft models, we found such invasion of the pons, cerebellum and thalamus and to a lesser extend the spinal cord. Whole brain observation of our models identified also long distance migration in preferential routes such as subpial and ventricular zones, or metastasis in the olfactory bulbs. However, no particular immuno-phenotypic differences could be observed between invading cells and pontine “resident” tumor cells.
MRI did not allow a proper follow-up of these infiltrative models except at end-stage. In this regards, CDOX models are powerful tools allowing the in vivo follow-up by bioluminescence only few weeks after injections. The robustness of BLI increase permits to precisely analyze distinct stage of disease development. Likewise, the additional fluorescent reporter is also particularly convenient to identify the tumor cells and metastases in the fresh tissue, and allows for FACS sorting of the living tumor cells from the animal for further study. Finally, these CDOX models constitute a potent platform, as TICs can be modified using lentiviruses prior to their injection in order to assess the in vivo consequences of gene modulation (overexpression or knock-down).
One of the advantage of our models in comparison with the GEMMs is the use of cancer cells presenting from start the genetic consequences of the epigenetic modifications, such as the global trimethylation loss resulting from the H3-K27M alteration that needs a significant number of division before it can be observed, together with the associated mutations landscape [9]. Indeed, it is difficult to recapitulate in GEMMs the temporal succession of genetic alterations occurring during oncogenesis.
Xenografts generated from treatment-naïve diagnostic samples may usefully complement those generated from the autopsies. The former represents the initial stages of the disease, i.e. the ideal situation to test new drugs to be incorporated in the initial management of patients. The later represent the end stages of the disease, i.e. models that usually display additional alterations resulting from treatments and progression, with potentially more aggressive behavior mirrored by faster growth rates [23]. Autopsy models thus appear more appropriate to test for resistance mechanisms and understand the evolution of the disease by comparison with models derived from biopsies performed at diagnosis. Depending on the biological question, the different types of models now available in the field would interestingly complement each other in order to ease the understanding of the disease and the development of efficient therapeutics.
MATERIALS AND METHODS
Tissue collection
All DIPG tumor samples were stereotactically biopsied at diagnosis in Necker-Enfants malades hospital (Paris, France). Informed consent for the translational research program was obtained from the parents or guardian according to the IRB approved protocol (CNIL 1176643). Patient’s clinical characteristics are summarized in Table 1. Blood DNA extracted from the blood of patients was banked under the same informed consent.
Immediately in the operating room, one core biopsy sample of the tumor was transferred into DMEM with 100 U/ml penicillin and 100 µg/ml streptomycin (Gibco). Within 24-hours after surgery, biopsies measuring approximately 1 x 4 mm were mechanically dissociated by pipetting into serum-free medium in order to obtain a single-cell suspension. Another sample was directly snap frozen in dry ice and processed later for DNA extraction.
Tumor-initiating cells (TIC) culture
The dissociated tumor cells suspension was cultured as an adherent monolayer in laminin-coated flask (Sigma) with a medium consisting of NeuroCult NS-A with proliferation supplement (Stemcell technologies), heparin (2 µg/mL, Stemcell technologies), human-basic FGF (20 ng/ml, Peprotech), human-EGF (20 ng/ml, Peprotech), PDGF-AA (10 ng/ml, Peprotech), and PDGF-BB (10 ng/ml, Perprotech). Medium was renewed every 2-3 days and passaging was performed when cells reached a confluence around 70-80%. Doubling time of TICs was evaluated based on proliferation assay recorded by video-microscopy.
Patient-derived orthotopic xenograft and serial transplant
Single-cell suspension from biopsy was centrifuged and resuspended into 50 µl of serum-free supplemented culture-medium. Female Swiss athymic nude mice were purchased at age 4-6 weeks from the Preclinical Evaluation Platform of Gustave Roussy. Mice were kept under sterile conditions in insulators and received food and water ad libitum. For tumor cells implantation, mice were anesthetized by 2.5% isoflurane (1.5 L O2/min) and placed into a stereotactic frame. For the first graft, 5 µl of cell suspension was injected into the thalamus of two mice, and for more recent biospies 3 µl of cell suspension was also injected into the pons of a third mouse. After appearance of neurological symptoms or more than 20% body weight loss, mice were sacrificed by CO2 inhalation. Brain was removed under sterile conditions and divided in two parts following the sagittal plane. The injected side of thalamus or pons (according to injection coordinates) was isolated and cut to obtain 1mm3 pieces using a sterile scalpel, and then enzymatically dissociated using the Tumor Dissociation Kit following the manufacturer instructions (Miletnyi, Germany) and the cell suspension was passed through 100 µm strainers. Thereafter, cells were centrifuged and washed with 1X PBS prior to be resuspended in serum-free supplemented-medium. One fifth of the resulting cell suspension was xenografted into the thalamus or pons of several recipient mice, corresponding to passage 1. Each mouse was injected with the equivalent of 1/20th of the dissociated tumor in 5 µl for thalamic injections and 3 µl for pontine injections. The remaining cells (4/5th) were frozen in serum free medium supplemented with 10% DMSO to allow for biobanking. The procedure was repeated until passage 3. At this time, the cells were grafted into the pons of mice in 3 µl of medium. The remaining half of the brain was fixed in Formol/Zinc overnight at room temperature and then processed for IHC.
Stereotactic coordinates used to target the thalamus or the pons were: 3 mm posterior, 2 mm lateral to bregma, 3.5 mm deep, or 1 mm posterior, 1mm lateral to lambda and 5 mm deep, respectively. All in vivo experiments were performed under conditions established by the European Community and approved by the CEEA26 Ethic Committee and the French Ministry (approval number: APAFIS#675 and APAFIS#1141).
Lentiviral transduction
The coding sequences of the fluorescent protein mKate2 [32] and Photinus pyralis (Firefly) luciferase were cloned in frame downstream of a synthetic CAG promoter in a pLVX lentiviral vector (Clontech) with a P2A auto-cleavable peptide between them. Lentiviral particles were produced in HEK293T cells using psPax2 and pMD2.g second-generation packaging plasmids (Addgene #12260 and #12259). TICs were transduced around passage 7 for 4 hours with concentrated virus at a multiplicity of infection about 2 and the medium was then renewed.
Development of cell-derived orthotopic xenograft
TICs within the two passages subsequent to lentiviral transduction were harvested with accutase and resuspended in serum-free supplemented-medium. Three hundred thousand cells were injected into the pons of adult mice in a total volume of 3 µL (i.e. 100,000 cells/µl) as described above. Mice were kept under specific pathogen-free conditions in air-filtered cages and received food and water ad libitum. Tumor growth was monitored using an IVIS 50 system with charge-coupled device (CCD) camera (PerkinElmer) every 2-3 weeks. Mice were anesthetized as described previously and imaged 10 min after intra-peritoneal injection of luciferin (150 mg/kg body weight, Promega). Radiance signal intensity (normalized photon counts in photons/second/cm2/steradian) in the pons region was quantified using Living Image software (Perkin Elmer). Doubling time of the CDOX models was estimated based on bioluminescence exponential curves.
In vivo administration of Panobinotstat
Administration of Panobinostat was performed by intraperitoneal (I.P.) injections of 10 mg/kg at day 1, 3 and 5, every other week, up to 62 days post xenograft. Control mice were injected with identical concentration of vehicle (DMSO). Panobinostat was dissolved as described by Grasso et al.,[23] at 70 mg/ml in DMSO, then serially diluted in water to a concentration of 1 mg/ml such that 10 µl per gram of weight (or ~200µl total) were injected I.P at each administration. Longitudinal tumor growth monitoring was performed by bioluminescence measurement as aforementioned. A statistical permutation test with the ‘compareGrowthCurves’ function of the statmod software package for r (http://bioinf.wehi.edu.au/software/compareCurves) was used to evaluate the significance of differences in the rate of tumor development between the two groups and 10,000 permutations were performed [33, 34]. The initial P-values were adjusted for multiple testing correction using Holm’s method.
Immunohistochemical staining
Intracardiac perfusion with 10 mL of 1X PBS was performed in mice to remove blood from the brain and subsequent perfusion of 10 mL Formalin/Zinc (formol 5%; Zinc 3 g/L; sodium chloride 8 g/L; MM-France) was performed for brain fixation with an osmotic pump delivering 7 mL/min. Brains were extracted and fixed for an additional 24 hours in Formalin/Zinc solution at room temperature prior to paraffin-embedding.
Representative formalin-zinc fixed sections were deparaffinized and subjected to a Ventana autostainer (BenchMark XT, Ventana Medical system, Tucson, USA) with routine protocols. Antigen retrieval was performed either with a standard pretreatment protocol including CC1 buffer for MIB-1 (Ki67, 1/100, Dako) and GLUT1 (1/100, ab652 AbCam) or in a semi-automatized system using a microwave antigen retrieval (MicroMED T/T Mega; Hacker Instruments & Industries, Inc., Winnsboro, SC) for 30 minutes at 98°C for OLIG2 (1/500, Sigma), Vimentin (1/750, Dako), GFAP (1/200, Dako), H3K27M (1/1000, Millipore) and H3K27me3 (1/1250, Diagenode). Staining used the RTU Vectastain Universal detection system (Vector laboratories, Burligame, CA, USA). Slides were scanned on a NanoZoomer Digital Slide Scanner (Hamamatsu, Japan). `
Tumor histology was reviewed by a neuro-pathologist (P.V.). Tumors were classified and graded according to the 2007 WHO classification. The quantification of MIB-1 positive cells in PDOX and CDOX models as well as biopsies (when available), was performed on scanned slides. To facilitate the quantification, the whole pons and medulla were sectioned into approximately 20 pictures of 20X magnification. Then, a macro was developed on Fiji (2.0.0) to specifically quantify the number of blue nuclei (negative cells) and the number of brown (positive) nuclei. The ratio of positive cells among the total number of nuclei found was then calculated for each picture and results are given as mean +/- SD. When MIB-1 staining of patient tumors were not available, data were extracted from the pathologist report.
Genotyping and STR analysis
Tumor DNA was extracted either from TICs, excess of ungrafted cells during PDOX transplant and FFPE tissue sections for CDOX using the QIAamp DNA Mini kit following manufacturer instructions (Qiagen). Histone H3 genes were amplified by PCR as previously described [8]. PCR products were analyzed by direct Sanger sequencing. Short tandem repeats (STR) analyses on patient blood, xenografted tumor or TICs DNA were outsourced to Eurofins Genomics (Germany).
Fluorescence microscopy
After dissection and fixative perfusion, brains were placed onto a sagittal brain matrix and a 2 mm-slice was cut from the middle line using razor blades. This slice was placed in a 1X PBS solution containing 10 ng/mL of Hoechst for 50 min. Thereafter, the slice was washed in a 1X PBS solution and put either on a dish for macroscopic imaging (Leica MZFLIII) or in a glass-bottom dish for confocal imaging (Leica SP8).
Serial images taken on the fluorescent macroscope were stitched with MosaicJ on Fiji to allow for the reconstruction of the whole brain. Thereafter, red channel corresponding to the mKate2 fluorescence, and bright-light channel were merged with Fiji to allow for the detection of tumor infiltrated structures.
Ex vivo Magnetic Resonance Imaging (MRI) of mouse brains
Mice were anesthetized with sodium pentobarbital (100–150 mg/kg, intraperitoneally), followed by intra-cardiac perfusion with Formol/Zinc solution (see above). After perfusion, each mouse head was harvested while maintaining brain integrity into the skull, and stored in Formol/Zinc solution at 4°C. Before MRI acquisition, the head was washed into PBS for 48 hours to remove the fixation solution, and then placed into a custom-built MRI compatible tube filled with Fluorinert FC-40, a magnetic susceptibility-matching fluid (3M, Saint Paul, USA).
Ex-vivo MRI acquisitions were performed on an 11.7T preclinical scanner (Bruker, Ettlingen, Germany) equipped with a cryo-coil dedicated to mouse brain. T2-weighted anatomical images were acquired using a 3D TurboRARE (Rapid Acquisition with Refocused Echoes) sequence: TR = 2 000 ms, TE = 6.75 ms, RARE factor = 8, effective TE = 20.25 ms, number of averages = 6, acquisition time = 23 h. The images dimension was set to 328 x 288 x 168 voxels, with a field-of-view of 16.4 x 14.4 x 8.4 mm3, which provided a high isotropic spatial resolution of 50 x 50 x 50 µm3 for the mouse brain. Such very high isotropic spatial resolution should limit partial volume effects and increase the sensibility to detect morphometric changes. T2-weighted anatomical images were reconstructed from raw data using homemade routines written in Matlab (Mathworks, Natick, USA). A specific algorithm was used to correct signal heterogeneities induced by the surface coil [35] and 3D visualization of images was obtained with Anatomist software (CEA NeuroSpin, Gif-sur-Yvette, France, http://brainvisa.info).
Evaluation of the blood-brain barrier function
Evans Blue dye was diluted in saline solution and administered by retro-orbital injection in CDOX NEM290, CDOX NEM292 and Control non-xenografted mice at 100mg/kg (10ml/kg such as 100µl were injected per 10g of weight). Whole brains were harvested 30 minutes later and imaged under a fluorescent macroscope before they were sectioned in 1 mm thick slices in a brain matrix to precisely observe Evans blue dye extravasation (bright-field) and tumor infiltration (red fluorescence). As a positive control, peripheral organs were checked for their blue coloration. The kidney of the control mouse was harvested and imaged such as described above.
ACKNOWLEDGMENTS
The authors acknowledge the use of the bioresources of the Necker Imagine DNA biobank (BB-033-00065) and the Tumor Bank of Necker-Enfants malades Hospital, Paris (Pr Thierry Molina and Gisèle Le Gall); We thank Marianne Hütt-Cabezas, Estelle Daudigeos-Dubus, the Plateforme d’évaluation préclinique (Olivia Bawa) and Plateforme d’imagerie et cytométrie (Dr Valérie Rouffiac and Sophie Salomé-Desnoulez) at Gustave Roussy for technical support.
CONFLICTS OF INTEREST
None.
FINANCIAL SUPPORT
This project was funded by Programme STROMAD PL-BIO 14-253 de l’Institut National du Cancer (INCa). DC, MAD, JG and AP also acknowledge supports from Charities “L’Etoile de Martin”, “Lemos Family & friends”, “Le Défi de Fortunée”, Association “K Valentin” and “Du ciel bleu pour Matthieu”. SP acknowledges support from the Association pour la Recherche en Neurochirurgie Pédiatrique
REFERENCES
1. Sturm D, Witt H, Hovestadt V, Khuong-Quang DA, Jones DT, Konermann C, Pfaff E, Tönjes M, Sill M, Bender S, Kool M, Zapatka M, Becker N, et al. Hotspot mutations in H3F3A and IDH1 define distinct epigenetic and biological subgroups of glioblastoma. Cancer Cell. 2012; 22: 425–37. doi: 10.1016/j.ccr.2012.08.024.
2. Reyes-Botero G, Giry M, Mokhtari K, Labussière M, Idbaih A, Delattre JY, Laigle-Donadey F, Sanson M. Molecular analysis of diffuse intrinsic brainstem gliomas in adults. J Neurooncol. 2013; 116: 405–11. doi: 10.1007/s11060-013-1312-2.
3. Puget S, Beccaria K, Blauwblomme T, Roujeau T, James S, Grill J, Zerah M, Varlet P, Sainte-Rose C. Biopsy in a series of 130 pediatric diffuse intrinsic Pontine gliomas. Childs Nerv Syst. 2015; 31: 1773–80. doi: 10.1007/s00381-015-2832-1.
4. Warren KE. Diffuse intrinsic pontine glioma: poised for progress. Front Oncol. 2012; 2: 205. doi: 10.3389/fonc.2012.00205
5. Robison NJ, Kieran MW. Diffuse intrinsic pontine glioma: a reassessment. J Neurooncol. 2014; 119: 7–15. doi: 10.1007/s11060-014-1448-8.
6. Schwartzentruber J, Korshunov A, Liu XY, Jones DT, Pfaff E, Jacob K, Sturm D, Fontebasso AM, Quang DK, Tönjes M, Hovestadt V, Albrecht S, Kool M, et al. Driver mutations in histone H3.3 and chromatin remodelling genes in paediatric glioblastoma. Nature. 2012; 482: 226–31. doi: 10.1038/nature10833.
7. Wu G, Broniscer A, McEachron TA, Lu C, Paugh BS, Becksfort J, Qu C, Ding L, Huether R, Parker M, Zhang J, Gajjar A, Dyer MA, et al. Somatic histone H3 alterations in pediatric diffuse intrinsic pontine gliomas and non-brainstem glioblastomas. Nat Genet. 2012; 44: 251–3. doi: 10.1038/ng.1102.
8. Castel D, Philippe C, Calmon R, Le Dret L, Truffaux N, Boddaert N, Pagès M, Taylor KR, Saulnier P, Lacroix L, Mackay A, Jones C, Sainte-Rose C, et al. Histone H3F3A and HIST1H3B K27M mutations define two subgroups of diffuse intrinsic pontine gliomas with different prognosis and phenotypes. Acta Neuropathol. 2015; 130: 815–27. doi: 10.1007/s00401-015-1478-0.
9. Bender S, Tang Y, Lindroth AM, Hovestadt V, Jones DT, Kool M, Zapatka M, Northcott PA, Sturm D, Wang W, Radlwimmer B, Højfeldt JW, Truffaux N, et al. Reduced H3K27me3 and DNA hypomethylation are major drivers of gene expression in K27M mutant pediatric high-grade gliomas. Cancer Cell. 2013; 24: 660–72. doi: 10.1016/j.ccr.2013.10.006.
10. Chan KM, Fang D, Gan H, Hashizume R, Yu C, Schroeder M, Gupta N, Mueller S, James CD, Jenkins R, Sarkaria J, Zhang Z. The histone H3.3K27M mutation in pediatric glioma reprograms H3K27 methylation and gene expression. Genes Dev. 2013; 27: 985–90. doi: 10.1101/gad.217778.113.
11. Lewis PW, Müller MM, Koletsky MS, Cordero F, Lin S, Banaszynski LA, Garcia BA, Muir TW, Becher OJ, Allis CD. Inhibition of PRC2 activity by a gain-of-function H3 mutation found in pediatric glioblastoma. Science. 2013; 340: 857–61. doi: 10.1126/science.1232245.
12. Louis DN, Perry A, Reifenberger G, von Deimling A, Figarella-Branger D, Cavenee WK, Ohgaki H, Wiestler OD, Kleihues P, Ellison DW. The 2016 World Health Organization Classification of Tumors of the Central Nervous System: a summary. Acta Neuropathol. 2016; 131: 803–20. doi: 10.1007/s00401-016-1545-1.
13. Becher OJ, Hambardzumyan D, Walker TR, Helmy K, Nazarian J, Albrecht S, Hiner RL, Gall S, Huse JT, Jabado N, MacDonald TJ, Holland EC. Preclinical evaluation of radiation and perifosine in a genetically and histologically accurate model of brainstem glioma. Cancer Res. 2010; 70: 2548–57. doi: 10.1158/0008-5472.CAN-09-2503.
14. Misuraca KL, Hu G, Barton KL, Chung A, Becher OJ. A novel mouse model of diffuse intrinsic pontine glioma initiated in Pax3-expressing cells. Neoplasia. 2016; 18: 60–70. doi: 10.1016/j.neo.2015.12.002.
15. Monje M, Mitra SS, Freret ME, Raveh TB, Kim J, Masek M, Attema JL, Li G, Haddix T, Edwards MS, Fisher PG, Weissman IL, Rowitch DH, et al. Hedgehog-responsive candidate cell of origin for diffuse intrinsic pontine glioma. PNAS. 2011; 108: 4453–8. doi: 10.1073/pnas.1101657108.
16. Kambhampati M, Perez JP, Yadavilli S, Saratsis AM, Hill AD, Ho CY, Panditharatna E, Markel M, Packer RJ, Nazarian J. A standardized autopsy procurement allows for the comprehensive study of DIPG biology. Oncotarget. 2015; 6: 12740–7. doi: 10.18632/oncotarget.3374.
17. Buczkowicz P, Hoeman C, Rakopoulos P, Pajovic S, Letourneau L, Dzamba M, Morrison A, Lewis P, Bouffet E, Bartels U, Zuccaro J, Agnihotri S, Ryall S, et al. Genomic analysis of diffuse intrinsic pontine gliomas identifies three molecular subgroups and recurrent activating ACVR1 mutations. Nat Genet. 2014; 46: 451–6. doi: 10.1038/ng.2936.
18. Taylor KR, Mackay A, Truffaux N, Butterfield YS, Morozova O, Philippe C, Castel D, Grasso CS, Vinci M, Carvalho D, Carcaboso AM, de Torres C, Cruz O, et al. Recurrent activating ACVR1 mutations in diffuse intrinsic pontine glioma. Nat Genet. 2014; 46: 457–61. doi: 10.1038/ng.2925.
19. Zarghooni M, Bartels U, Lee E, Buczkowicz P, Morrison A, Huang A, Bouffet E, Hawkins C. Whole-genome profiling of pediatric diffuse intrinsic pontine gliomas highlights platelet-derived growth factor receptor α and poly (ADP-ribose) polymerase as potential therapeutic targets. JCO. 2010; 28: 1337–44. doi: 10.1200/JCO.2009.25.5463.
20. Paugh BS, Broniscer A, Qu C, Miller CP, Zhang J, Tatevossian RG, Olson JM, Geyer JR, Chi SN, da Silva NS, Onar-Thomas A, Baker JN, Gajjar A, et al. Genome-wide analyses identify recurrent amplifications of receptor tyrosine kinases and cell-cycle regulatory genes in diffuse intrinsic pontine glioma. J Clin Oncol. 2011; 29: 3999–4006. doi: 10.1200/JCO.2011.35.5677.
21. Puget S, Philippe C, Bax DA, Job B, Varlet P, Junier MP, Andreiuolo F, Carvalho D, Reis R, Guerrini-Rousseau L, Roujeau T, Dessen P, Richon C, et al. Mesenchymal transition and PDGFRA amplification/mutation are key distinct oncogenic events in pediatric diffuse intrinsic pontine gliomas. PLoS One. 2012; 7: e30313. doi: 10.1371/journal.pone.0030313.
22. Yamada T, Kawamata T, Walker DG, McGeer PL. Vimentin immunoreactivity in normal and pathological human brain tissue. Acta Neuropathol. 1992; 84: 157–62.
23. Grasso CS, Tang Y, Truffaux N, Berlow NE, Liu L, Debily MA, Quist MJ, Davis LE, Huang EC, Woo PJ, Ponnuswami A, Chen S, Johung TB, et al. Functionally defined therapeutic targets in diffuse intrinsic pontine glioma. Nat Med. 2015; 21: 555–9. doi: 10.1038/nm.3855.
24. Bradley KA, Pollack IF, Reid JM, Adamson PC, Ames MM, Vezina G, Blaney S, Ivy P, Zhou T, Krailo M, Reaman G, Mehta MP. Motexafin gadolinium and involved field radiation therapy for intrinsic pontine glioma of childhood: a Children’s Oncology Group phase I study. Neuro Oncol. 2008; 10: 752–8. doi: 10.1215/15228517-2008-043.
25. Guo X, Geng M, Du G. Glucose transporter 1, distribution in the brain and in neural disorders: its relationship with transport of neuroactive drugs through the blood-brain barrier. Biochem Genet. 2005; 43: 175–87.
26. Beccaria K, Canney M, Goldwirt L, Fernandez C, Adam C, Piquet J, Autret G, Clément O, Lafon C, Chapelon JY, Carpentier A. Opening of the blood-brain barrier with an unfocused ultrasound device in rabbits. J Neurosurg. 2013; 119: 887–98. doi: 10.3171/2013.5.JNS122374.
27. Uyama O, Okamura N, Yanase M, Narita M, Kawabata K, Sugita M. Quantitative evaluation of vascular permeability in the gerbil brain after transient ischemia using Evans blue fluorescence. J Cereb Blood Flow Metab. 1988; 8: 282–4. doi: 10.1038/jcbfm.1988.59.
28. Jansen MH, Veldhuijzen van Zanten SE, Sanchez Aliaga E, Heymans MW, Warmuth-Metz M, Hargrave D, van der Hoeven EJ, Gidding CE, de Bont ES, Eshghi OS, Reddingius R, Peeters CM, Schouten-van Meeteren AY, et al. Survival prediction model of children with diffuse intrinsic pontine glioma based on clinical and radiological criteria. Neuro Oncol. 2015; 17: 160–6. doi: 10.1093/neuonc/nou104.
29. Vassal G, Terrier-Lacombe MJ, Lellouch-Tubiana A, Valery CA, Sainte-Rose C, Morizet J, Ardouin P, Riou G, Kalifa C, Gouyette A. Tumorigenicity of cerebellar primitive neuro-ectodermal tumors in athymic mice correlates with poor prognosis in children. Int J Cancer. 1996; 69: 146–51. doi: 10.1002/(SICI)1097-0215(19960422)69:2<146::AID-IJC14>3.0.CO;2-7.
30. Gaspar N, Grill J, Geoerger B, Lellouch-Tubiana A, Michalowski MB, Vassal G. p53 Pathway dysfunction in primary childhood ependymomas. Pediatr Blood Cancer. 2006; 46: 604–13. doi: 10.1002/pbc.20532.
31. Caretti V, Sewing AC, Lagerweij T, Schellen P, Bugiani M, Jansen MH, van Vuurden DG, Navis AC, Horsman I, Vandertop WP, Noske DP, Wesseling P, Kaspers GJ, et al. Human pontine glioma cells can induce murine tumors. Acta Neuropathol. 2014; 127: 897–909. doi: 10.1007/s00401-014-1272-4.
32. Shcherbo D, Merzlyak EM, Chepurnykh TV, Fradkov AF, Ermakova GV, Solovieva EA, Lukyanov KA, Bogdanova EA, Zaraisky AG, Lukyanov S, Chudakov DM. Bright far-red fluorescent protein for whole-body imaging. Nat Methods. 2007; 4: 741–6. doi: 10.1038/nmeth1083.
33. Elso CM, Roberts LJ, Smyth GK, Thomson RJ, Baldwin TM, Foote SJ, Handman E. Leishmaniasis host response loci (lmr1-3) modify disease severity through a Th1/Th2-independent pathway. Genes Immun. 2004; 5: 93–100. doi: 10.1038/sj.gene.6364042.
34. Baldwin T, Sakthianandeswaren A, Curtis JM, Kumar B, Smyth GK, Foote SJ, Handman E. Wound healing response is a major contributor to the severity of cutaneous leishmaniasis in the ear model of infection. Parasite Immunol. 2007; 29: 501–13. doi: 10.1111/j.1365-3024.2007.00969.x.
35. Mangin JF. Entropy minimization for automatic correction of intensity nonuniformity. IEEE. 2000: 162-69. doi: 10.1109/MMBIA.2000.852374.