
INTRODUCTION
Lung cancer is one of the most common cancers worldwide and has the first leading cancer-related mortality with much poorer survival [1]. Non-small cell lung cancer (NSCLC) constitutes approximately 80% of total lung malignancies. Despite significant advances in multidisciplinary treatment modes, the 5-year survival rate of lung cancer is less than 15% [2, 3]. So far, only a few prognostic factors, such as sex, performance status, disease stage, and weight loss, have been identified [4]. Currently, using clinical parameters alone, we cannot accurately predict the clinical outcome of lung cancer patients. The discovery of molecular biological prognostic factors may aid in a more accurate prediction of clinical outcome of patients with NSCLC.
Chemerin is a novel adipokine, which plays an important role in adipogenesis and chemotaxis of the innate immune system [5]. Previous studies have indicated that chemerin expressions are downregulated in many carcinomas and are associated with poor differentiation [6–9]. However, other studies demonstrate that the expressions of chemerin are upregulated in grade III/IV glioma tissues and overexpression of chemerin in orals quamous cell carcinoma is correlated with poor clinical outcomes of patients [10, 11]. Recent research has shown that the levels of plasma chemerin in patients with lung cancer were significantly higher than those in healthy control [12]. However, the prognostic significance of chemerin expression in blood specimens from NSCLC patients has not yet been determined.
In this study, we investigated the correlation between serum chemerin levels and clinicopathological characteristics and survival. Our results showed that the evaluation of serum chemerin could be a valuable diagnostic and prognostic biomarker for NSCLC.
RESULTS
Clinical characteristics of patients
The mean age of the NSCLC patients (61.8 years) was not obviously different from healthy controls (62.6 years). The proportion of male gender accounted for 65.6% of the NSCLC patients and 57.5% of the healthy controls, respectively, with no significantly difference. At the time of diagnosis, 79 patients were at stage I + II and 110 patients were at stage III + IV, 53.4% of the patients with lymph node metastases, and 31.7% with distant metastases. Patient’s data were analyzed after a 5-year follow-up, and the median OS was 30 months, and median DFS was 21 months. The patient’ s characteristics are presented in Table 1.
Table 1: Clinicopathological variables of NSCLC patients and healthy controls
Variables |
NSCLC patients (n = 189) |
Healthy control (n = 120) |
|---|---|---|
Age (years) |
61.8 ± 11.2 |
62.6 ± 8.9 |
Gender (n, %) |
||
Male |
124 (65.6) |
69 (57.5) |
Female |
65 (34.4) |
51 (42.5) |
Histology |
||
ADC |
107(56.6) |
|
SCC |
82 (43.4) |
|
TNM stage |
||
I + II |
79 (41.8) |
|
III + IV |
110 (58.2) |
|
Differentiation |
||
Well-moderate |
120 (63.5) |
|
Poor |
69 (36.5) |
|
Lymph node metastases |
||
Negative |
88 (46.6) |
|
Positive |
101(53.4) |
|
Distant metastases |
||
Negative |
129 (68.3) |
|
Positive |
60 (31.7) |
Abbreviations: ADC, Adenocarcinoma; SCC, Squamous cell carcinoma.
Association between serum chemerin levels and clinicopathological variables
As shown in Figure 1A, the levels of serum chemerin were significantly higher in NSCLC patients compared with healthy controls (1783.16 ± 568.06 pg/ml vs. 1195.08 ± 229.94 pg/ml, P < 0.001). We further evaluated the clinicopathological significance of the serum chemerin levels in NSCLC patients. The association between the serum chemerin levels and clinicopathological variables in NSCLC patients were summarized in Table 2. As displayed in Figure 1B, when compared with the healthy controls, the serum chemerin levels were elevated in NSCLC patients at both early stage and advanced stage, and serum chemerin levels were even higher in advanced stage patients than those of early stage patients. Furthermore, the serum chemerin levels were obviously higher in patients with lymph node metastases than those without (Figure 1C, Table 2). Meanwhile, statistically significant differences in chemerin levels were found between NSCLC patients with distant metastases and those patients without distant metastases (Figure 1D, Table 2). Besides, the serum chemerin levels have no significant differences from other clinicopathological variables (Table 2). After all, these results indicated that serum chemerin levels increased in NSCLC patients, and associated with the progression and metastasis NSCLC, which could be serve as a potential biomarker to differentiate NSCLC patients from healthy controls, even the indicator for prognosis.
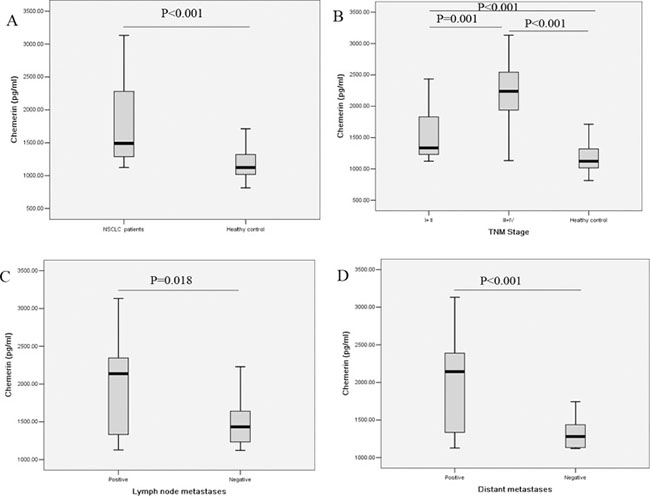
Figure 1: Comparison of serum chemerin levels (A) between healthy controls and NSCLC patients; (B) in healthy controls and NSCLC patients at different TNM stage; (C) in NSCLC patients with and without lymph node metastasis; (D) in NSCLC patients with and without distant metastasis.
Table 2: Association between serum chemerin levels and characteristical variables in NSCLC patients
Factors |
Number |
Chemerin (pg/ml) |
P- value |
|---|---|---|---|
Age (years) |
0.406 |
||
≥ 60 |
102 |
1872.21 ± 591.28 |
|
< 60 |
87 |
1717.35 ± 554.20 |
|
Gender |
0.537 |
||
Male |
124 |
1729.55 ± 542.69 |
|
Female |
65 |
1842.42 ± 604.05 |
|
Histology |
0.246 |
||
ADC |
107 |
1660.59 ± 481.93 |
|
SCC |
82 |
1873.76 ± 618.83 |
|
Differentiation |
0.193 |
||
Well-moderate |
120 |
1874.48 ± 587.40 |
|
Poor |
69 |
1630.96 ± 517.44 |
|
TNM stage |
0.001* |
||
I + II |
79 |
1529.54 ± 434.70 |
|
III + IV |
110 |
2163.59 ± 540.34 |
|
Lymph node metastases |
0.018* |
||
Negative |
88 |
1514.49 ± 380.02 |
|
Positive |
101 |
1944.36 ± 606.60 |
|
Distant metastases |
0.000* |
||
Negative |
129 |
1424.67 ± 332.11 |
|
Positive |
60 |
2179.39 ± 510.86 |
*Statistically significant difference (P < 0.05).
Abbreviations: ADC, Adenocarcinoma; SCC, Squamous cell carcinoma.
Diagnostic value of serum chemerin levels in NSCLC patients
To assess the performance of serum chemerin as a marker, ROC curves were used to calculate the sensitivity of this marker in separating NSCLC patients from healthy controls. As shown in Figure 2A, an area under the curve (AUC) value for serum chemerin reached 0.809 (confidence interval (95% CI) 0.722–0.896). With a cut-off value of 1500 pg/ml, serum chemerin has a sensitivity of 62.4%, a specificity of 67.5%. These results indicated that serum chemerin was a valuable biomarker for NSCLC diagnosis.
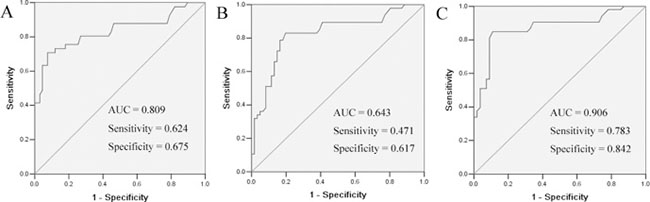
Figure 2: ROC curves for the serum chemerin (A) and CEA (B) and chemerin + CEA (C) in differentiating NSCLC patients and healthy controls. The areas under the curve of serum chemerin, CEA and chemerin + CEA were 0.809, 0.64 and 0.906, respectively.
The diagnostic threshold afforded by the ROC analysis for CEA was 5.0 ng/ml. The area under the CEA ROC was 0.643 (95% CI 0.644–0.841). It was lower compared with the areas of chemerin (Figure 2B). The combined diagnostic value of chemerin and CEA in NSCLC was further detected. The results showed that the combined detection of these two indices had a sensitivity of 78.3% and a specificity of 84.2%. The combination of chemerin and CEA produced better sensitivity and specificity than chemerin and CEA alone (Figure 2C).
Serum chemerin levels are an independent prognostic indicator for NSCLC patient survival
To evaluate the prognostic significance of the serum chemerin levels, we used serum chemerin cut-off value 1500 pg/ml, which was calculated from previous ROC analysis, as a threshold to partitioned 189 NSCLC patients into two groups, high serum chemerin group (chemerin ≥ 1500 pg/ml, n = 118) and low serum chemerin group (chemerin < 1500 pg/ml, n = 71). Univariate analysis showed that serum chemerin levels were significantly correlated OS and PFS (Table 3). In multivariate analysis, high chemerin was found to be significantly associated with a shorter PFS and OS. Kaplan-Meier survival curves further demonstrate that lung cancer patients with high chemerin have substantially shorter PFS and OS, compared to those with low chemerin patients (Figure 3). As expected, TNM stage, lymph node metastases and distant metastases were found to be strongly associated with decreased PFS and OS, in both univariate and multivariate analyses.
Table 3: Univariate and multivariate Cox analysis of variables considered for PFS and OS of NSCLC patients
Variables |
PFS |
OS |
||||
|---|---|---|---|---|---|---|
HR |
95% CI |
P-value |
HR |
95% CI |
P-value |
|
Univariate analysis |
||||||
Age (≥ 60 vs. < 60) |
1.061 |
0.803–1.404 |
0.676 |
1.144 |
0.900–1.453 |
0.271 |
Gender(male vs. famale) |
1.187 |
0.884–1.594 |
0.255 |
1.222 |
0.529–2.870 |
0.645 |
Histology (ADC vs. SCC) |
0.689 |
0.351–1.353 |
0.279 |
0.721 |
0.385–1.347 |
0.305 |
Differentiation (well-moderate vs. poor) |
1.333 |
0.645–2.756 |
0.438 |
1.134 |
0.483–2.665 |
0.773 |
TNM stage (I + II vs. III + IV) |
1.292 |
1.186–1.407 |
0.001* |
1.700 |
1.345–2.147 |
0.001* |
Lymph node metastases (positive vs. negative) |
1.732 |
1.076–2.788 |
0.024* |
1.943 |
1.099–3.435 |
0.022* |
Distant metastases (positive vs. negative) |
1.710 |
1.101–2.654 |
0.017* |
1.815 |
0.907–3.633 |
0.024* |
Chemerin (high vs. low) |
1.859 |
1.494–2.314 |
0.001* |
2.931 |
1.765–4.869 |
0.001* |
Multivariate analysis |
||||||
Age (≥ 60 vs. < 60) |
1.240 |
0.486–4.995 |
0.583 |
1.152 |
0.698–1.902 |
0.579 |
Gender (male vs. famale) |
1.468 |
0.677–2.358 |
0.290 |
1.428 |
0.987–2.549 |
0.078 |
Histology (ADC vs. SCC) |
0.671 |
0.346–1.320 |
0.238 |
1.186 |
0.734–1.916 |
0.487 |
Differentiation (well-moderatevs. poor) |
1.016 |
0.603–1.712 |
0.952 |
1.848 |
0.519–4.247 |
0.462 |
TNM stage (I + II vs. III + IV) |
1.600 |
1.129–2.691 |
0.008* |
1.850 |
1.301–2.630 |
0.001* |
Lymph node metastases (positive vs. negative) |
2.133 |
1.153–3.944 |
0.016* |
1.611 |
1.036–2.506 |
0.034* |
Distant metastases (positive vs. negative) |
2.623 |
1.264–4.085 |
0.001* |
2.881 |
1.460–5.687 |
0.002* |
Chemerin (high vs. low) |
1.898 |
1.112–3.239 |
0.019* |
2.339 |
1.377–3.974 |
0.002* |
*Statistically significant difference (P < 0.05).
Abbreviations: PFS, Progression-free survival; OS, Overall survival; ADC, Adenocarcinoma; SCC, Squamous cell carcinoma; HR, Hazard ratio; CI, Confidence interval.
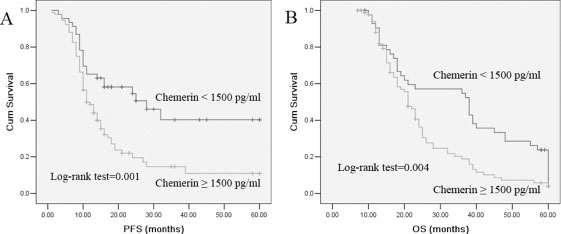
Figure 3: Kaplan–Meier survival curves for PFS and OS in patients with chemerin -high and -low NSCLC. Log-rank test determined that the PFS and OS in high chemerin group were significantly longer than those in the low chemerin group (P = 0.001; P = 0.004).
DISCUSSION
In the present study, the diagnostic and prognosis value of serum chemerin levels in NSCLC patients were evaluated. We found that serum chemerin levels were obviously elevated in NSCLC patients compared with the controls. Unfavorable clinicopathological variables, TNM stage, lymph node metastasis, and distant metastasis were associated with high serum chemerin levels. Kaplan-Meier and Cox regression analysis revealed that high chemerin levels were correlated with poor survival and it could become an independent prognostic factor for NSCLC. Furthermore, ROC analysis displayed that serum chemerin had a potential to distinguish NSCLC patients from healthy controls. The combined diagnostic value of the chemerin and CEA in NSCLC was also analyzed. The results showed that the combined detection of these two indices had a better diagnostic value than the use of a single index. Our results suggest that serum chemerin may serve as a useful serum biomarker for the diagnosis and prognosis of NSCLC patients.
Adipokines are multifunctional peptide hormones that perform essential regulatory functions related to energy balance, satiety, and immunity [13, 14]. Many studies have demonstrated that adipokines play important roles in tumor angiogenesis, invasion, differentiation, and progression [15–17]. Chemerin, a member of adipokines, plays an important role in regulating angiogenesis, cell proliferation and migration, inflammation, glucose, insulin signaling, and lipid metabolism [18–20]. Although the dysregulated expression of chemerin in the tumor tissues has been reported, the results are inconsistent [6–11, 21]. One possible explanation for these inconsistencies is that chemerin expression may vary in different types of cancers, which are common phenomena in tumor biology [22].
So far, a large number of studies demonstrate the relationship between expression of chemerin in tumor tissues and the clinical outcome of some cancers [6–11]. However, there is a paucity of literature on the association of serum chemerin levels with prognosis of lung cancers. In the current study, serum chemerin levels were determined and found to be the independent prognostic factor for patients with lung cancer. Thus, the results of our study indicated that chemerin levels in blood might help for predicting the prognosis of patients with lung cancer.
In summary, our results showed that serum chemerin levels significantly elevated in NSCLC patients compared with the controls, and there was a strong association between high serum chemerin levels and TNM stages, lymph node metastasis, and distant metastasis. Furthermore, NSCLC patients with higher serum chemerin levels had poorer prognosis, suggesting that serum chemerin may be a useful clinical biomarkers in diagnosing, progression and prognostic evaluation in NSCLC.
MATERIALS AND METHODS
Patients
One hundred and eighty-nine NSCLC patients diagnosed and treated in the Nanjing Chest Hospital, from January 2010 to January 2014 were enrolled in this study. Patients who suffered hyperlipidemia, metabolic syndrome, infection, cardiovascular disease, liver disease, previous malignancy, or received adjuvant therapy before surgery were excluded from the study. All patients’ histopathological classification was determined according to the WHO criteria, and staged classification was defined according to the 7th edition of UICC TNM staging system [23]. One hundred and twenty healthy controls were recruited from healthy unrelated subjects whose age and gender matched subjects who did not have any family history cancer were recruited in this study.
Follow-up lasted through December 2015, with a median follow-up period of 22 months for living patients (range, 3–60 months). Progression-free survival (PFS) was defined as the time interval between the date of diagnosis and the date of disease relapse. Overall survival (OS) was defined as the time interval between the date of diagnosis and the date of death.
The study protocol was approved by the ethics committee of Nanjing Chest Hospital. All patients provided written informed consent before enrollment.
Measurement of serum chemerin and CEA levels
Serum samples from each individual were obtained at the time of diagnosis, before any therapeutic measures were started. Samples were centrifuged at 1500 × g for 20 min at −4°C. The supernatant was stored at −70°C for assessment of the levels of chemerin. The chemerin levels were determined by sandwich ELISA with the commercial chemerin ELISA kit (Mil-lipore, USA). The CEA levels were measured by electrochemiluminescence immunoassays. The normal upper limit for this assay was 5 ng/ml. All samples were blinded to the technologists running the assays, and the code was broken to the statisticians after the database was constructed.
Statistical analysis
Statistical software (SPSS for Windows, version 18) was used for the analysis. All variables under normal distribution were shown as the mean ± standard deviation. The differences between groups were determined by Mann-Whitney U test, and Pearson chi-square test or Fisher’s exact test was tested for categorical values. To determine the diagnostic accuracy of chemerin, receiver operating characteristic (ROC) curves was retrieved from logistic regression analysis and the area under the curve (AUC) was calculated. Univariate survival analysis was performed using the Kaplan-Meier method and the log-rank test. Multivariate analysis was conducted to determine an independent impact on survival using the Cox proportional hazard method. P < 0.05 was considered statistically significant.
CONFLICTS OF INTEREST
The authors declare that they have no competing interests.
REFERENCES
1. DeSantis CE, Lin CC, Mariotto AB, Siegel RL, Stein KD, Kramer JL, Alteri R, Robbins AS, Jemal A. Cancer treatment and survivorship statistics, 2014. CA Cancer J Clin. 2014; 64:252–71.
2. Reck M, Heigener DF, Mok T, Soria JC, Rabe KF. Management of non-small-cell lung cancer: recent developments. Lancet. 2013; 382:709–19.
3. Gumireddy K, Li A, Chang DH, Liu Q, Kossenkov AV, Yan J, Korst RJ, Nam BT, Xu H, Zhang L, Ganepola GA, Showe LC, Huang Q. AKAP4 is a circulating biomarker for non-small cell lung cancer. Oncotarget. 2015; 6:17637–47. doi: 10.18632/oncotarget.3946.
4. Xu CH, Sheng ZH, Hu HD, Hao KK, Wang QB, Yu LK. Elevated expression of Cripto-1 correlates with poor prognosis in non-small cell lung cancer.Tumour Biol. 2014; 35:8673–8.
5. Rourke JL, Dranse HJ, Sinal CJ. Towards an integrative approach to under-standing the role of chemerin in human health and disease. Obes Rev. 2013; 14:245–62.
6. Pachynski RK, Zabel BA, Kohrt HE, Tejeda NM, Monnier J, Swanson CD, Holzer AK, Gentles AJ, Sperinde GV, Edalati A, Hadeiba HA, Alizadeh AA, Butcher EC. The chemoattractant chemerin suppresses melanoma by recruiting natural killer cell antitumor defenses. J Exp Med. 2012; 209:1427–35.
7. Zheng Y, Luo S, Wang G, Peng Z, Zeng W, Tan S, Xi Y, Fan J. Downregulation of tazarotene induced gene-2 (TIG2) in skin squamous cell carcinoma. Eur J Dermatol. 2008; 18:638–41.
8. Zhao S, Li C, Ye Y, Peng F, Chen Q. Expression of chemerin correlates with a favorable prognosis in patients with non-small cell lung cancer. Lab Med. 2011; 42:553–7.
9. Lin W, Chen YL, Jiang L, Chen JK. Reduced expression of chemerin is associated with a poor prognosis and a lowed infiltration of both dendritic cells and natural killer cells in human hepatocellular carcinoma. Clin Lab. 2011; 57:879–85.
10. Yamaguchi Y, Du XY, Zhao L, Morser J, Leung LL. Proteolytic cleavage of chemerin protein is necessary for activation to the active form, Chem157S, which functions as a signaling molecule in glioblastoma. J Biol Chem. 2011; 286:39510–9.
11. Wang N, Wang QJ, Feng YY, Shang W, Cai M. Overexpression of chemerin was associated with tumor angiogenesis and poor clinical outcome in squamous cell carcinoma of the oral tongue. Clin Oral Investig. 2014; 18:997–1004.
12. Qu X, Han L, Wang S, Zhang Q, Yang C, Xu S, Zhang L. Detection of chemerin and It’s clinical significance in peripheral blood of patients with lung cancer. Zhongguo Fei Ai Za Zhi. 2009; 12:1174–7.
13. Falcao-Pires I, Castro-Chaves P, Miranda-Silva D, Lourenco AP, Leite-Moreira AF. Physiological, pathological and potential therapeutic roles of adipokines. Drug Discov Today. 2012; 17:880–9.
14. Raucci R, Rusolo F, Sharma A, Colonna G, Castello G, Costantini S. Functional and structural features of adipokine family. Cytokine. 2013; 61:1–14.
15. Gati A, Kouidhi S, Marrakchi R, El Gaaied A, Kourda N, Derouiche A, Chebil M, Caignard A, Perier A. Obesityand renal cancer: Role of adipokines in the tumor-immune system conflict. Oncoimmunology. 2014; 3:e27810.
16. Nakajima TE, Yamada Y, Hamano T, Furuta K, Matsuda T, Fujita S, Kato K, Hamaguchi T, Shimada Y. Adipocytokines as new promising markers of colorectal tumors: adiponectin for colorectal adenoma, and resistin and visfatin for colorectal cancer. Cancer Sci. 2010; 101:1286–91.
17. Surmacz E. Leptin and adiponectin: emerging therapeutic targets in breast cancer. J Mammary Gland Biol Neoplasia. 2013; 18:321–32.
18. Kaur J, Adya R, Tan BK, Chen J, Randeva HS. Identification of chemerin receptor (ChemR23) in human endothelial cells: chemerin-induced endothelial angiogenesis. Biochem Biophys Res Commun. 2010; 391:1762–8.
19. Landgraf K, Friebe D, Ullrich T, Kratzsch J, Dittrich K, Herberth G, Adams V, Kiess W, Erbs S, Körner A. Chemerinas a mediator between obesity and vascular inflammation in children. J Clin Endocrinol Metab. 2012; 97:E556–64.
20. Zabel BA, Kwitniewski M, Banas M, Zabieglo K, Murzyn K, Cichy J. Chemerin regulation and role in host defense. Am J Clin Exp Immunol. 2014; 3:1–19.
21. Wang C, Wu WK, Liu X, To KF, Chen GG, Yu J, Ng EK. Increased serum chemerin level promotes cellular invasiveness in gastric cancer: a clinical and experimental study. Peptides. 2014; 51:131–8.
22. Oliveira-Ferrer L, Tilki D, Ziegeler G, Hauschild J, Loges S, Irmak S, Kilic E, Huland H, Friedrich M, Ergün S. Dual role of carcinoembryonic antigen-related cell adhesion molecule 1 in angiogenesis and invasion of human urinary bladder cancer. Cancer Res. 2004; 64:8932–8.
23. Goldstraw P, Crowley J, Chansky K, Giroux DJ, Groome PA, Rami-Porta R, Postmus PE, Rusch V, Sobin L, International Association for the Study of Lung Cancer International Staging C, Participating I. The IASLC Lung Cancer Staging Project: proposals for the revision of the TNM stage groupings in the forthcoming (seventh) edition of the TNM Classification of malignant tumours. J Thorac Oncol. 2007; 2:706–14.