
INTRODUCTION
Gliomas represent approximately 30% of all central nervous system tumors and 80% of malignant brain tumors [1]. The methods of 6-week radiation therapy and concomitant temozolomide chemotherapy and 6 times of adjuvant temozolomide chemotherapy after surgical resection are widely employed in the treatment scheme [2]. However, this treatment protocol increased the risk of brain tissue radiation injury and recurrent in patients with glioma. One of the most common treatment-related symptoms is pseudoprogression. It is defined that growth of existing lesions or appearance of new lesions within 12 weeks of completion of radiation therapy may be the result of treatment effects rather than growth of tumor. During continued follow-up, if lesion stabilizes or shrinks, the initial growth is confirmed pseudoprogression [3]. Previous studies also suggested that enlarged and enhanced lesions on MR images may represent pseudoprogression in 46.8-64% of the cases [4]. Much effort has been taken to distinguish the progression from pseudoprogression through advanced MR imaging techniques, such as DWI and dynamic susceptibility contrast PWI. Because the ADC values in necrotic are usually higher than recurrent tissue. However, this method is limited because of the differences of tumor type. Reduced diffusion can represent highly cellular tumor areas and inflammatory [5].
The ways of dealing with the radiation injury and recurrent of tumor are largely different in clinical practice. It is important to differentiate the radiation injury and recurrent. The perfusion-weighted imaging technical is an advanced imaging method, and has been widely used in the diagnostic of tumor. The cerebral blood volume (rCBV) is one of the perfusion-weighted imaging index, and can evaluate the blood supply and density of microvessel. Kim et al reported a histogram analysis of high relative cerebral blood volume, the sensitivity and specificity are 90.2% and 91.1% with a cut-off of 1.7 for differentiating tumor recurrence and radiation injury s [6]. However, CBV also has some limitations because most of lesions have variable tumor fractions. The CBV from tumoral comments may affect cerebral blood volume itself. To overcome the shortage of these methods, Cha et al compared the subtracted histogram mode with a multiparametric approach, and found that the latter method is more accurate, with 81.8% sensitivity and 100% specificity [7]. Martinez et al reported that rCBV was useful for differentiating between pseudoprogression and true progression in our sample, with sensitivity=100% and specificity=100% for rCBV [8]. Some studies have reported the diagnostic value of rCBV mean in recurrent and radiation injury. However, all of them were limited in some factors such as small sample size. The aim of this study was to give an accurate and systematical evaluation for diagnostic value of recurrent and radiation injury in glioma patients.
RESULTS
Study selection and study characteristics
The initial search returned 992 records, of which 105 were excluded for duplicate studies. Then 872 studies were excluded for various reasons (comments, reviews, case reports, or not relevant studies) on the basis of title, abstract and full text. The remaining 15 records were included in the final analysis [6–8, 9–20]. Please see more details in Figure 1.
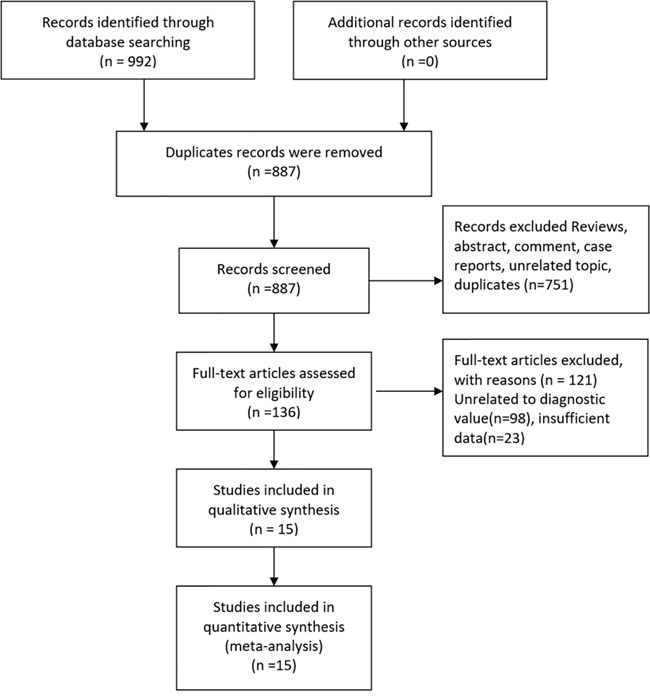
Figure 1: Flow diagram of studies selection process.
The main characteristics of the included studies are presented in Table 1. The included studies were published from 2009 to 2015. In total, 576 participants with glioma are enrolled. The reference standard of include studies is from clinical or history pathology. Chemotherapy patients received are Temozolomide, and some of them also received radiation treatment. Gender ratio among studies is comparable.
Table 1: Characteristics of the included studies in the meta-analysis
Author |
Year |
Country |
Mean |
Gender (M/F) |
Sample |
Radiation doses(Gy) |
Chemotherapy |
Cut-off |
TP |
FP |
FN |
TN |
|---|---|---|---|---|---|---|---|---|---|---|---|---|
Barajas |
2009 |
USA |
54.2 |
33/24 |
57 |
59.4 |
Tenozolomide |
1.75 |
36 |
6 |
10 |
14 |
Hu |
2009 |
USA |
47.7 |
11/2 |
40 |
63 |
- |
0.71 |
22 |
0 |
2 |
16 |
Bobek |
2010 |
Poland |
38.5 |
3/5 |
11 |
60 |
Tenozolomide |
1.25 |
3 |
0 |
2 |
6 |
Kim |
2010 |
Korea |
46.1 |
8/2 |
10 |
60.1 |
Tenozolomide |
3.69 |
4 |
0 |
0 |
6 |
Ozsunar |
2010 |
Turkey |
42.0 |
22/8 |
32 |
- |
- |
1.30 |
19 |
3 |
3 |
7 |
Prat |
2010 |
Spain |
- |
14/10 |
24 |
- |
- |
1.0 |
8 |
1 |
0 |
9 |
Hu |
2011 |
USA |
- |
- |
31 |
- |
- |
1.14 |
13 |
2 |
2 |
14 |
Seeger |
2013 |
Germany |
53.6 |
24/16 |
40 |
60 |
Tenozolomide |
2.25 |
19 |
4 |
4 |
13 |
Wang |
2013 |
China |
47.0 |
15/8 |
23 |
>54 |
- |
1.3 |
9 |
1 |
4 |
9 |
Young |
2013 |
USA |
58.0 |
14/6 |
20 |
59.4 |
Tenozolomide |
2.4 |
16 |
1 |
0 |
3 |
Cha |
2014 |
Korea |
49.0 |
18/17 |
35 |
- |
Tenozolomide |
1.8 |
9 |
4 |
2 |
20 |
Di |
2014 |
Italy |
62.5 |
18/11 |
29 |
60 |
Tenozolomide |
NA |
18 |
1 |
3 |
7 |
Martinez |
2014 |
Spanish |
48.0 |
14/20 |
34 |
57.7 |
Tenozolomide |
0.9 |
17 |
0 |
0 |
17 |
He |
2014 |
China |
45.0 |
60/34 |
94 |
- |
- |
NA |
53 |
25 |
7 |
9 |
Yin |
2015 |
China |
43.0 |
50/46 |
96 |
- |
- |
NA |
67 |
18 |
5 |
6 |
Quality evaluation
The evaluation of quality is shown in Supplementary Figure 1 and Supplementary Figure 2. As we can see, 3 studies in patient’s selection, 1 study of index test, 3 study of reference standard, and 1 of flow and timing are considered as high risk bias. For applicability concerns, 3 studies of index test and 3 studies of reference standard are treated as high concern. But viewed as a whole, the quality of included studies is relevant high.
Pooled diagnostic values
The Spearman test indicated that there is no threshold effect within studies (r=-0.099, P=0.741). Random-effects models were used in present analyses because the heterogeneity within studies are more than 50%. The pooled sensitivity and specificity were 0.88 (95%CI: 0.82-0.92, Figure 2) and 0.85 (95%CI: 0.68-0.93, Figure 3). The pooled positive likelihood ratio is 5.73 (95%CI: 2.56-12.81), negative likelihood ratio is 0.15 (95%CI: 0.10-0.22), and the diagnostic odds ratio is 39.34 (95%CI: 13.96-110.84). The summary receiver operator characteristic is 0.91 (95%CI: 0.88-0.93, Figure 4). The diagnostic accuracy of mean cerebral blood volume is relatively high. The Fangan plot was shown in Figure 5. If the pre-test probability is 20%, the post-test probability is approximately 59% through positive likelihood ratio and 4% through negative likelihood ratio. The diagnostic accuracy is high.
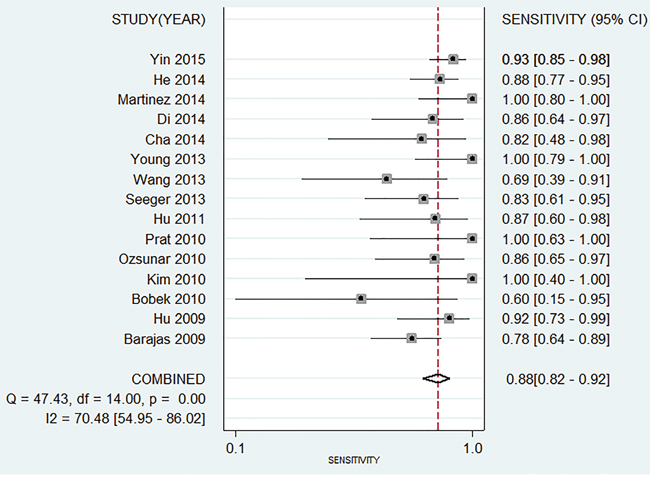
Figure 2: Forest plot of pooled sensitivity of mean cerebral blood volume for recurrent and radiation injury in glioma patients.
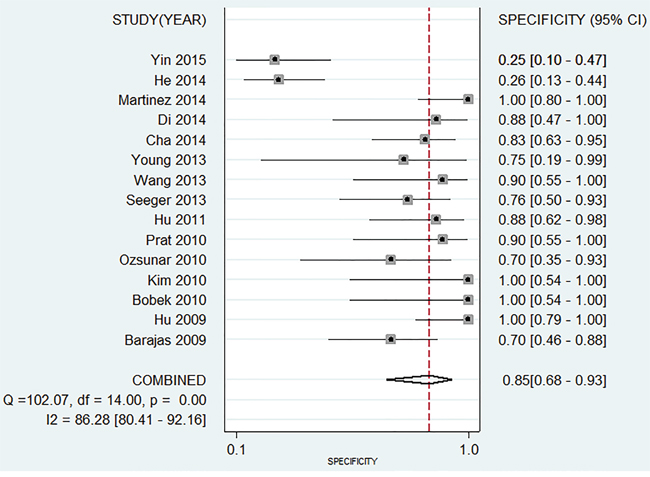
Figure 3: Forest plot of pooled specificity of mean cerebral blood volume for recurrent and radiation injury in glioma patients.
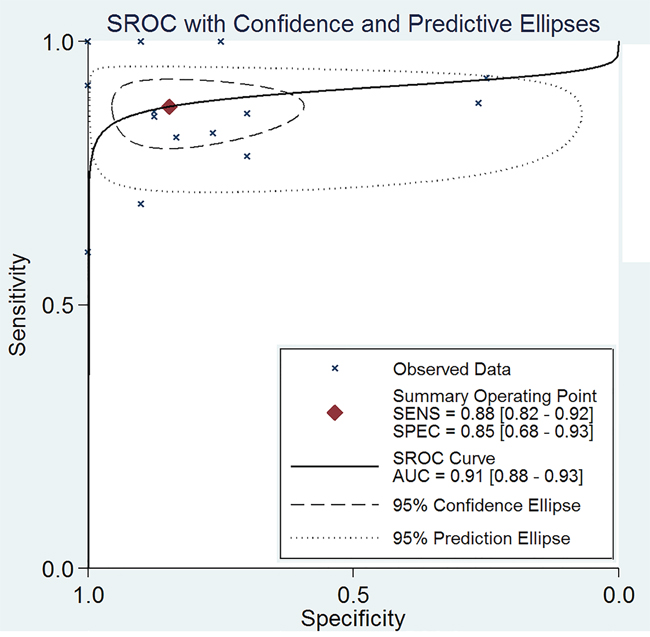
Figure 4: The SROC curve of mean cerebral blood volume for recurrent and radiation injury in glioma patients.
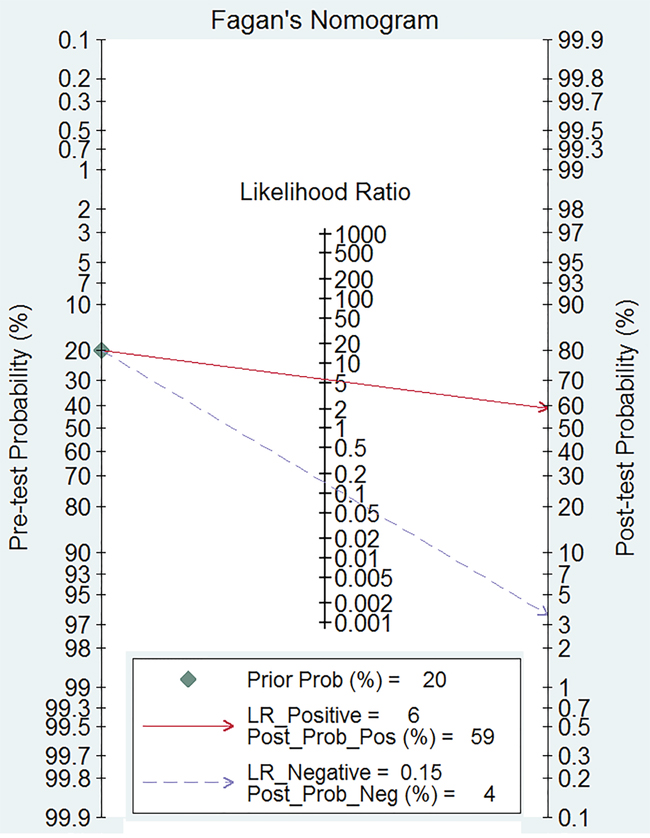
Figure 5: Fagan diagram evaluating the overall diagnostic value of mean cerebral blood volume for recurrent and radiation injury in glioma patients.
Sensitivity analysis and publication bias
We conducted sensitivity analyses through sequentially excluding some certain studies, and the summary sensitivity and specificity, positive likelihood ratio, negative likelihood ratio and summary receiver operator characteristic were altered (data were not given), indicating that the pooled estimations were stable. We used Deek’s plot to evaluate the publication bias. The bias test shown existence of publication bias (t=2.30 P=0.039) as indicated in Figure 6.
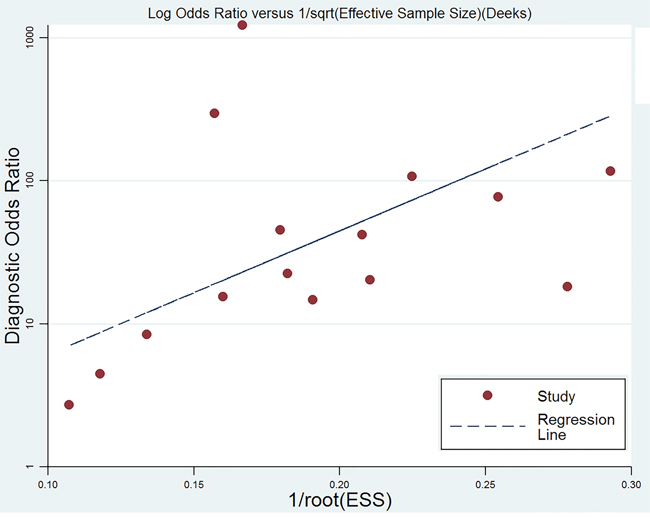
Figure 6: Deek’s funnel plot to evaluate the publication bias.
DISCUSSION
Our study suggested that mean cerebral blood volume could aid in the prediction of the presence of recurrent and radiation injury in glioma patients (AUC=0.91). The mean cerebral blood volume showed high sensitivity (0.88, 95%CI: 0.82-0.92) and specificity (0.85, 95%CI: 0.68-0.93). These data indicate that mean cerebral blood volume is a useful diagnostic tool for differentiate recurrent and radiation injury in glioma patients.
The perfusion-weighted imaging is mainly used to evaluate the vessel physiological status and hemodynamic [21, 22]. Many parameters of perfusion are involved in the progression and prognosis of tumor. The rapid growth and proliferation in glioma needs nutrients and oxygen. The lack of supply will stimulate the tumor cell to secret many vascular growth factors and accelerate the tumor angiogenesis. Blood perfusion and volume from tumor tissue will also increase. However, this kind of tumor vessel is different from normal one. The hemodynamics in the brain tissue will change, especially in tumor lesions. The necrosis areas of cerebral tissue caused by radiation therapy presented different characteristics. The radiation can lead to a series of tissue injury, such as vascular endothelial cell injury, hemal wall thinning, transparent degeneration and fibrin necrosis, resulting in vascular occlusion and brain tissue necrosis [23]. The blood perfusion of necrosis areas caused by radiation will be reduced. The clinical parameters of perfusion-weighted imaging could differentiate the recurrent and necrosis lesions from the pseudoprogression. Our results found mean cerebral blood volume is an effective tool for recurrent and radiation injury in patients with glioma. Higher diagnostic odds ratio means better diagnostic values (0-100) The diagnostic odds ratio is 39.4. The positive likelihood ratio and negative likelihood ratio can explain the diagnostic value better. The two parameters are 5.73 and 0.15, which means probability of glioma recurrence is higher than radiation injury by 5.73 times when mean cerebral blood volume of lesions is higher than cut-off value. The probability is 15% when lesions area is lower that cut-off value. All of these showed the diagnostic accuracy of mean cerebral blood volume in patients with glioma.
The present meta-analysis has several strengths. First, a series of study focused on the diagnostic value of mean cerebral blood volume for recurrent and radiation injury in patients with glioma. As far as we know, this is the first meta-analysis and systematic review to the evaluate the diagnostic value of mean cerebral blood volume for glioma patients. Second, our meta-analysis is strictly in accordance with the latest Preferred Reporting Items for Systematic Reviews and Meta-Analyses Protocols. Also, most of all included studies were relevant high-quality. Third, study selection, data extraction, and evaluation of the risk of bias were carried out by two authors independently, which effectively reduces the risk of selection bias.
Several limitations of this meta-analysis merit consideration. The present meta-analysis showed significant heterogeneity across the included studies. The results of meta-analysis should be interpreted with cautions due to the heterogeneity. The threshold effects test showed no significance (r=0.099, P=0.741), which means other potential factors may influence the sources of heterogeneity. The reasons could be as following: First, the included studies in the meta-analysis did not use the same cut-off. Second, the clinical characteristics of study population, such as mean age, duration of disease, radiation doses, and chemotherapy among the selected studies. The available information showed that mean ages ranged from 38.5 to 62.5. Mean age and treatment methods are associated with recurrence and radiation injury of glioma. Thus, these factors could be a significant source of heterogeneity. Third, the population included in single study are from different areas, and the ethnicity may have a substantial effect on the diagnostic value [24]. Besides, we could not conduct subgroup analyses because the sample size of these is relevant small. Finally, the Deek’s plot suggested the publication bias may exist, which potentially results in overstatement of the diagnostic value.
In conclusion, mean cerebral blood volume is an effective diagnostic tool for differentiating recurrent and radiation injury in glioma patient’s glioma. It can effectively differentiate pseudoprogression from true progression in glioma patients. However, the results should be interpreted with caution because of the potential publication bias.
MATERIALS AND METHODS
Literature search
Ethical approval is not applicable for the present study since this is a meta-analysis based on previous published studies. The present meta-analysis is in accordance with the Preferred Reporting Items for Systematic Reviews and Meta-Analyses Protocols (PRISMA-2009 checklist) [25].
We identified relevant studies by searching PubMed, Web of Science, China National Knowledge Infrastructure, and Wanfang databases from inception to August 8, 2016. Electronic searches were performed using exploded medical subject heading and corresponding keywords, including “brain neoplasms OR glioma”, “perfusion MRI OR perfusion magnetic resonance imaging”. No language restriction was applicable. We also reviewed the reference lists of review articles to identify the other potentially eligible studies.
Selection criteria
Two authors (LZZ and LYY) independently evaluated the eligibility of all studies. Any disagreements were resolved by fully discussion. The following criteria were required for included studies: (1) Study design: a retrospective or prospective study; (2) Patients: new or increased enhancing lesions appeared in the radiotherapy target area in patients with glioma; (3) Diagnostic: recurrent and radiation injury in glioma patients were diagnosed by perfusion-weighted Imaging; (4) Data: study could supply sufficient data for calculating four values (TP: true positives, FP: false positives, FN: false negatives, and TN: true negatives). Study focused on other intracranial tumors, that can’t supply relevant data for analysis were excluded. When multiple publications were published from the same study, we used the one with the largest sample size.
Data extraction
A standard Excel Sheet was used to collect data. LZZ conducted data extraction, and YSP checked the final data. The following information were extracted for included studies: surname of the first author, publication year, country, mean age of study population, gender ratio (Male/Female), sample size, reference standard, chemotherapy or radiation doses records, and values of screening (TP, FP, FN, TN). We tried to contact the authors of the study by e-mails for obtaining the relevant information if necessary.
Quality evaluation
The Quality Assessment of Diagnostic Accuracy Studies 2 (QUADAS-2) was used to evaluate the quality of included studies [26]. The QUADAS-2 scale quantitated the quality of study through 4 key domains: patient selection, index test, reference standard, and flow of patients through the study and time of index tests and reference standard. Each domain consists of two section: bias of risk and applicability. If responses of all questions are YES, then we give a low risk bias judgment, or else potential bias risk may exist. Applicability are divided into three levels: high, unclear and low.
Statistical analysis
We calculated the sensitivity, specificity, positive likelihood ratios (PLRs), negative likelihood ratios (NLRs), diagnostic odds ratios (DORs), summary receiver operator characteristic (SROC) curve area and their 95% confidence intervals (CIs) through bivariate mixed effects models [27]. Heterogeneity within studies were evaluated using Cochran Q statistic and quantified with I2 statistic. I2>50% and P<0.05 presented the existence of heterogeneity [28]. Fagan plots was used to show the relationship between the prior test probability, the likelihood ration, and posterior test probability, and Deek’s funnel plot was used to evaluate the publication bias [29, 30]. We used the Stata 11.0 (Corp, College Station TX, USA) to conduct the whole analyses, and considered P<0.05 as a significant level.
Abbreviations
rCBV, cerebral blood volume; TP, true positive; FP, false positive; FN, false negative; TN, true negative; QUADAS-2, Quality Assessment of Diagnostic Accuracy Studies; PLRs, positive likelihood ratios; NLRs, negative likelihood ratios; DORs, diagnostic odds ratios; SROC, summary receiver operator characteristic curve area; CI, confidence interval.
ACKNOWLEDGMENTS
LZZ and SLF designed this study and contributed substantially to the design of the search strategy. LZZ and LYY searched and selected the trials and extracted data. ZQ and HXQ performed the analysis and interpreted the data. LZZ wrote the manuscript. LZZ and LYY critically reviewed the manuscript. LZZ, LYY and FJ participated in the data extraction and critically revised it. LZZ and SLF proofread the final version. All authors read and approved the final manuscript.
CONFLICTS OF INTEREST
The authors declare that they have no conflicts of interest.
REFERENCES
1. Ostrom QT, Gittleman H, Liao P, Rouse C, Chen Y, Dowling J, Wolinsky Y, Kruchko C, Barnholtz-Sloan J. CBTRUS statistical report: primary brain and central nervous system tumors diagnosed in the United States in 2007-2011. Neuro Oncol. 2014, 16: v1-v63.
2. Stupp R, Mason WP, van den Bent MJ, Weller M, Fisher B, Taphoorn MJ, Belanger K, Brandes AA, Marosi C, Bogdahn U, Curschmann J, Janzer RC, Ludwin SK, Gorlia T, Allgeier A, Lacombe D, Cairncross JG, Eisenhauer E, Mirimanoff RO. Radiotherapy plus concomitant and adjuvant temozolomide for glioblastoma. N Engl J Med. 2005, 352: 987-996.
3. Wen PY1, Macdonald DR, Reardon DA, Cloughesy TF, Sorensen AG, Galanis E, Degroot J, Wick W, Gilbert MR, Lassman AB, Tsien C, Mikkelsen T, Wong ET, Chamberlain MC, Stupp R, Lamborn KR, Vogelbaum MA, van den Bent MJ, Chang SM. Updated response assessment criteria for high-grade gliomas: response assessment in neuro-oncology working group. J Clin Oncol: Off J Am Soc Clin Oncol. 2010, 28: 1963-72.
4. Husby JA, Espeland A, Kalyanpur A, Brocker C, Haldorsen IS. Double reading of radiological examinations in Norway. Acta Radiol. 2011, 52: 516-521.
5. Baek HJ, Kim HS, Kim N, Choi YJ, Kim YJ. Percent change of perfusion skewness and kurtosis: a potential imaging biomarker for early treatment response in patients with newly diagnosed glioblastomas. Radiology. 2012, 264: 834-843.
6. Kim HS, Kim JH, Kim SH, Cho KG, Kim SY. Posttreatment high-grade glioma: usefulness of peak height position with semiquantitative MR perfusion histogram analysis in an entire contrast-enhanced lesion for predicting volume fraction of recurrence. Radiology. 2010, 256: 906-915.
7. Cha J, Kim ST, Kim HJ, Kim BJ, Kim YK, Lee JY, Jeon P, Kim KH, Kong DS, Nam DH. Differentiation of tumor progression from pseudoprogression in patients with posttreatment glioblastoma using multiparametric histogram analysis. AJNR Am J Neuroradiol. 2014, 35: 1309-1317.
8. Martinez-Martinez A, Martinez-Bosch J. [Perfusion magnetic resonance imaging for high grade astrocytomas: Can cerebral blood volume, peak height, and percentage of signal intensity recovery distinguish between progression and pseudoprogression?]. [Article in Spanish]. Radiologia. 2014, 56: 35-43.
9. Barajas RJ, Chang JS, Segal MR, Parsa AT, McDermott MW, Berger MS, Cha S. Differentiation of recurrent glioblastoma multiforme from radiation necrosis after external beam radiation therapy with dynamic susceptibility-weighted contrast-enhanced perfusion MR imaging. Radiology. 2009, 253: 486-496.
10. Bobek-Billewicz B, Stasik-Pres G, Majchrzak H, Zarudzki L. Differentiation between brain tumor recurrence and radiation injury using perfusion, diffusion-weighted imaging and MR spectroscopy. Folia Neuropathol. 2010, 48: 81-92.
11. Di Costanzo A, Scarabino T, Trojsi F, Popolizio T, Bonavita S, de Cristofaro M, Conforti R, Cristofano A, Colonnese C, Salvolini U, Tedeschi G. Recurrent glioblastoma multiforme versus radiation injury: a multiparametric 3-T MR approach. Radiol Med. 2014, 119: 616-624.
12. Hu LS, Baxter LC, Smith KA, Feuerstein BG, Karis JP, Eschbacher JM, Coons SW, Nakaji P, Yeh RF, Debbins J, Heiserman JE. Relative cerebral blood volume values to differentiate high-grade glioma recurrence from posttreatment radiation effect: direct correlation between image-guided tissue histopathology and localized dynamic susceptibility-weighted contrast-enhanced perfusion MR imaging measurements. AJNR Am J Neuroradiol. 2009, 30: 552-558.
13. Hu X, Wong KK, Young GS, Guo L, Wong ST. Support vector machine multiparametric MRI identification of pseudoprogression from tumor recurrence in patients with resected glioblastoma. J Magn Reson Imaging. 2011, 33: 296-305.
14. Wang YL, Liu MY, Wang Y, Xiao HF, Sun L, Zhang J, Ma L. Differentiation between glioma recurrence and radiation-induced brain injuried using perfusion-weighted magnetic resonance imaging. Acta Acad Medi Sinicae. 2013, 35: 416-721.
15. Ozsunar Y, Mullins ME, Kwong K, Hochberg FH, Ament C, Schaefer PW, Gonzalez RG, Lev MH. Glioma recurrence versus radiation necrosis? A pilot comparison of arterial spin-labeled, dynamic susceptibility contrast enhanced MRI, and FDG-PET imaging. Acad Radiol. 2010, 17: 282-290.
16. Prat R, Galeano I, Lucas A, Martinez JC, Martin M, Amador R, Reynes G. Relative value of magnetic resonance spectroscopy, magnetic resonance perfusion, and 2-(18F) fluoro-2-deoxy-D-glucose positron emission tomography for detection of recurrence or grade increase in gliomas. J Clin Neurosci. 2010, 17: 50-53.
17. Young RJ, Gupta A, Shah AD, Graber JJ, Chan TA, Zhang Z, Shi W, Beal K, Omuro AM. MRI perfusion in determining pseudoprogression in patients with glioblastoma. Clin Imaging. 2013, 37: 41-49.
18. Yin D, Zhao Y. Value of MR spectroscopy and MR perfusion imaging in brain tumor recurrence diagnosis. Modern Oncology. 2015: 1655-1658.
19. He Z, Zhang Z, Tang J, Yang F. Comparison of diagnostic values between enhacnced MRI and F-FDG PET/CT in recurrence lesions of glioma. Lab Med Clin 2014: 3-5.
20. Seeger A, Braun C, Skardelly M, Paulsen F, Schittenhelm J, Ernemann U, Bisdas S. Comparison of three different MR perfusion techniques and MR spectroscopy for multiparametric assessment in distinguishing recurrent high-grade gliomas from stable disease. Acad Radiol. 2013, 20: 1557-1565.
21. Law M, Young RJ, Babb JS, Peccerelli N, Chheang S, Gruber ML, Miller DC, Golfinos JG, Zagzag D, Johnson G. Gliomas: predicting time to progression or survival with cerebral blood volume measurements at dynamic susceptibility-weighted contrast-enhanced perfusion MR imaging. Radiology. 2008, 247: 490-498.
22. Jain R, Ellika SK, Scarpace L, Schultz LR, Rock JP, Gutierrez J, Patel SC, Ewing J, Mikkelsen T. Quantitative estimation of permeability surface-area product in astroglial brain tumors using perfusion CT and correlation with histopathologic grade. AJNR Am J Neuroradiol. 2008, 29: 694-700.
23. Ellika SK, Jain R, Patel SC, Scarpace L, Schultz LR, Rock JP, Mikkelsen T. Role of perfusion CT in glioma grading and comparison with conventional MR imaging features. AJNR Am J Neuroradiol. 2007, 28: 1981-1987.
24. Beauchesne PD, Bertrand S, Branche R, Linke SP, Revel R, Dore JF, Pedeux RM. Human malignant glioma cell lines are sensitive to low radiation doses. Int J Cancer. 2003, 105: 33-40.
25. Moher D, Liberati A, Tetzlaff J, Altman DG, The PRISMA Group. Preferred Reporting Items for Systematic Reviews and Meta-Analyses: The PRISMA Statement. PLoS Med. 2009, 6: e1000097.
26. Whiting PF, Rutjes AW, Westwood ME, Mallett S, Deeks JJ, Reitsma JB, Leeflang MM, Sterne JA, Bossuyt PM. QUADAS-2: a revised tool for the quality assessment of diagnostic accuracy studies. Ann Intern Med. 2011, 155: 529-536.
27. Reitsma JB, Glas AS, Rutjes AW, Scholten RJ, Bossuyt PM, Zwinderman AH. Bivariate analysis of sensitivity and specificity produces informative summary measures in diagnostic reviews. J Clin Epidemiol. 2005; 58:982-990.
28. Higgins JP, Thompson SG, Deeks JJ, Altman DG. Measuring inconsistency in meta-analyses. BMJ. 2003, 327: 557-560.
29. Egger M, Davey SG, Schneider M, Minder C. Bias in meta-analysis detected by a simple, graphical test. BMJ. 1997, 315: 629-634.
30. Begg CB, Mazumdar M. Operating characteristics of a rank correlation test for publication bias. Biometrics. 1994, 50: 1088-1101.