
INTRODUCTION
Although the incidence of gastric cancer has significantly decreased worldwide, it is still the second most common malignancy in China [1]. Thus, identification of its risk factors for prognosis remains greatly important to clinicians. A variety of factors have been adequately analyzed in order to evaluate their predictive value of prognosis for gastric cancer, including tumor diameter [2], T stage [3], N stage [4], tumor markers [5, 6] and other novel indexes [7–9].
Till now, the most commonly used classification is TNM staging system including T stage, N stage and distant metastasis, which was recommended by American Joint Committee on Cancer (AJCC) [10] and Japanese Gastric Cancer Association (JGCA) [11]. However, the tumor diameter, as an important prognostic factor which was demonstrated in many other tumors [12–15] as well as gastric cancer [16], has not been included in the TNM staging system yet. Thus, in present study, we defined a new index—tumor volume (V) by the formula V = Tumor diameter × (T stage)2/2, and investigated the prognostic value of tumor volume and VNM for gastric cancer.
RESULTS
General features of gastric cancer patients
There were 2662 males (78.1%) and 747 females (21.9%). The patient age ranged from 20 to 90 years (median, 58; mean, 57). The follow up time ranged from 1 to 75 months (median, 24.9; mean, 28.1). The 1-, 3- and 5-year overall survival rate was 89.0%, 66.6% and 57.9%, respectively. There were 1705 patients in training set and 1704 patients in validation set. The clinicopathological characteristics were comparable between training and validation set (Table 1).
Table 1: Clinicopathological characteristics of patients in training and validation set
Characteristics |
Training set |
Validation set |
P value |
||||||||||
|---|---|---|---|---|---|---|---|---|---|---|---|---|---|
V1 |
V2 |
V3 |
V4 |
V5 |
P value |
V1 |
V2 |
V3 |
V4 |
V5 |
P value |
||
Age |
0.311 |
0.461 |
0.989 |
||||||||||
≤ 60 |
213 |
110 |
324 |
226 |
139 |
203 |
107 |
321 |
240 |
140 |
|||
> 60 |
127 |
68 |
214 |
174 |
110 |
124 |
72 |
206 |
183 |
108 |
|||
Gender |
0.576 |
0.068 |
0.051 |
||||||||||
Male |
268 |
149 |
425 |
312 |
201 |
242 |
152 |
403 |
325 |
185 |
|||
Female |
72 |
29 |
113 |
88 |
48 |
85 |
27 |
124 |
98 |
63 |
|||
Tumor location |
< 0.001 |
< 0.001 |
0.850 |
||||||||||
Upper third |
53 |
48 |
195 |
153 |
90 |
61 |
48 |
181 |
159 |
85 |
|||
Middle third |
58 |
22 |
84 |
58 |
50 |
52 |
27 |
98 |
64 |
41 |
|||
Lower third |
218 |
96 |
230 |
151 |
67 |
202 |
99 |
222 |
156 |
89 |
|||
Upper-middle or middle-lower |
11 |
12 |
29 |
38 |
42 |
12 |
5 |
26 |
44 |
33 |
|||
Macroscopic type |
< 0.001 |
< 0.001 |
0.387 |
||||||||||
Early stage |
309 |
2 |
0 |
0 |
0 |
291 |
1 |
0 |
0 |
0 |
|||
Bormann I |
6 |
22 |
50 |
34 |
29 |
7 |
15 |
39 |
36 |
19 |
|||
Bormann II |
11 |
119 |
164 |
76 |
44 |
19 |
124 |
173 |
65 |
35 |
|||
Bormann III |
1 |
24 |
265 |
212 |
131 |
2 |
25 |
251 |
255 |
137 |
|||
Bormann IV |
2 |
4 |
40 |
56 |
32 |
0 |
9 |
38 |
41 |
50 |
|||
Differentiation degree |
< 0.001 |
< 0.001 |
0.736 |
||||||||||
Well differentiated |
101 |
19 |
44 |
20 |
8 |
114 |
14 |
44 |
20 |
4 |
|||
Moderately differentiated |
90 |
44 |
160 |
86 |
48 |
88 |
68 |
146 |
100 |
37 |
|||
Poorly differentiated |
136 |
105 |
304 |
264 |
164 |
114 |
92 |
321 |
271 |
185 |
|||
Mucinous or signet ring cell |
10 |
9 |
26 |
25 |
28 |
11 |
5 |
16 |
30 |
22 |
|||
Tumor diameter* |
< 0.001 |
< 0.001 |
0.954 |
||||||||||
≤ 2.5 cm |
232 |
47 |
52 |
0 |
0 |
230 |
52 |
58 |
0 |
0 |
|||
2.5–4.3 cm |
96 |
129 |
243 |
79 |
2 |
75 |
126 |
252 |
87 |
2 |
|||
4.3–5.5 cm |
7 |
0 |
206 |
103 |
4 |
15 |
0 |
186 |
107 |
3 |
|||
> 5.5 cm |
5 |
2 |
37 |
218 |
243 |
7 |
1 |
31 |
229 |
243 |
|||
T stage |
< 0.001 |
< 0.001 |
0.699 |
||||||||||
T1 |
326 |
2 |
0 |
0 |
0 |
306 |
1 |
0 |
0 |
0 |
|||
T2 |
14 |
169 |
79 |
0 |
0 |
20 |
174 |
78 |
0 |
0 |
|||
T3 |
0 |
6 |
389 |
218 |
14 |
1 |
4 |
395 |
229 |
8 |
|||
T4a |
0 |
1 |
69 |
180 |
220 |
0 |
0 |
53 |
193 |
230 |
|||
T4b |
0 |
0 |
1 |
2 |
15 |
0 |
0 |
1 |
1 |
10 |
|||
N stage |
< 0.001 |
< 0.001 |
0.587 |
||||||||||
N0 |
288 |
86 |
158 |
67 |
22 |
274 |
88 |
155 |
69 |
26 |
|||
N1 |
32 |
40 |
138 |
64 |
24 |
32 |
41 |
146 |
88 |
26 |
|||
N2 |
14 |
25 |
114 |
91 |
61 |
16 |
30 |
105 |
96 |
43 |
|||
N3a |
5 |
24 |
102 |
125 |
82 |
5 |
16 |
92 |
121 |
103 |
|||
N3b |
1 |
3 |
26 |
53 |
60 |
0 |
4 |
29 |
49 |
50 |
|||
Vessel invasion |
< 0.001 |
< 0.001 |
0.874 |
||||||||||
Positive |
45 |
65 |
209 |
233 |
187 |
51 |
60 |
214 |
235 |
180 |
|||
Negative |
182 |
58 |
166 |
80 |
40 |
175 |
55 |
139 |
102 |
49 |
|||
Neural invasion |
< 0.001 |
< 0.001 |
0.347 |
||||||||||
Positive |
62 |
87 |
314 |
278 |
218 |
70 |
75 |
302 |
313 |
215 |
|||
Negative |
128 |
38 |
63 |
37 |
8 |
119 |
39 |
56 |
24 |
16 |
|||
TNM stage |
< 0.001 |
< 0.001 |
0.239 |
||||||||||
IA |
279 |
1 |
0 |
0 |
0 |
260 |
1 |
0 |
0 |
0 |
|||
IB |
39 |
81 |
29 |
0 |
0 |
41 |
85 |
35 |
0 |
0 |
|||
IIA |
17 |
45 |
140 |
41 |
3 |
20 |
43 |
132 |
42 |
0 |
|||
IIB |
5 |
24 |
140 |
72 |
20 |
4 |
29 |
143 |
71 |
27 |
|||
IIIA |
0 |
26 |
105 |
65 |
24 |
2 |
21 |
102 |
110 |
27 |
|||
IIIB |
0 |
1 |
96 |
139 |
64 |
0 |
0 |
98 |
120 |
43 |
|||
IIIC |
0 |
0 |
28 |
83 |
138 |
0 |
0 |
17 |
80 |
151 |
|||
VNM stage |
< 0.001 |
< 0.001 |
0.963 |
||||||||||
IA |
288 |
0 |
0 |
0 |
0 |
274 |
0 |
0 |
0 |
0 |
|||
IB |
32 |
86 |
0 |
0 |
0 |
32 |
88 |
0 |
0 |
0 |
|||
IIA |
14 |
40 |
161 |
0 |
0 |
16 |
41 |
166 |
0 |
0 |
|||
IIB |
6 |
25 |
143 |
67 |
0 |
5 |
30 |
139 |
69 |
0 |
|||
IIIA |
0 |
27 |
107 |
64 |
0 |
0 |
20 |
106 |
88 |
0 |
|||
IIIB |
0 |
0 |
127 |
91 |
46 |
0 |
0 |
116 |
96 |
52 |
|||
IIIC |
0 |
0 |
0 |
178 |
203 |
0 |
0 |
0 |
170 |
196 |
|||
Tumor diameter*: Tumor diameter was divided into 4 subgroups according to the 3 optimal cutoff points calculated by X-tile software (Supplementary Figure 1).
Definition of V stage and VNM stage
Tumor volume was calculated by the formula V = Tumor diameter × (T stage)2/2 (1 represents T1 stage, 2 represents T2 stage, 3 represents T3 stage, 4 represents T4a stage, and 5 represents T4b stage). The 4 optimal cutoff points of tumor volume (all P < 0.05) in training set were showed in Figure 1. Then, V stage was defined according to the 4 cutoff points: V1 (≤ 3.5), V2 (3.5–8.6), V3 (8.6–25.0), V4 (25.0–45.0) and V5 (> 45.0). VNM system was designed as combination of V stage, N stage and M stage on the basis of 7th edition of AJCC cancer staging manual.
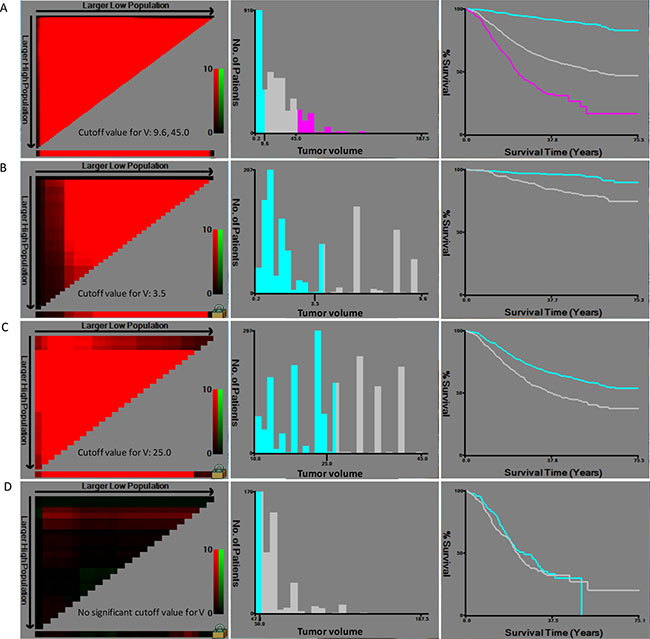
Figure 1: Calculation of cutoff points of tumor volume by X-tile in training set. (A) Three subgroups were built according to the 2 optimal cutoff points (9.6, 45.0, P < 0.001); (B) Two subgroups were built according to the optimal cutoff point (3.5, P < 0.001) for patients with tumor volume between 0 and 9.6. (C) Two subgroups were built according to the optimal cutoff point (25.0, P < 0.001) for patients with tumor volume between 9.6 and 45.0. (D) No cutoff point was obtained for patients with tumor volume exceed 45.0.
The correlation between V stage and other factors were analyzed in Table 1. Both in training and validation set, V stage was found to be significantly associated with tumor location (P < 0.001), macroscopic type (P < 0.001), differentiation degree (P < 0.001), tumor diameter (P < 0.001), T stage (P < 0.001), N stage (P < 0.001), vessel invasion (P < 0.001), neural invasion (P < 0.001) and TNM stage (P < 0.001). Compared with the small tumor volume-patients, patients with larger tumor volume were found more frequently in Borrmann type III or IV, having a higher proportion in poor differentiation, in advanced T stage and N stage, in positive vessel and neural invasion and in advanced TNM stage.
Prognostic value of V stage in gastric cancer
Prognostic predictors were identified by univariate and multivariate analysis in training set (Table 2). Age (P = 0.025), tumor location (P = 0.004), macroscopic type (P < 0.001), differentiation degree (P < 0.001), tumor diameter (P < 0.001), T stage (P < 0.001), N stage (P < 0.001), V stage (P < 0.001), vessel invasion (P < 0.001) and neural invasion (P < 0.001) were risk factors for prognosis of gastric cancer. Multivariate analysis (Table 2) showed that age (P = 0.016), macroscopic type (P = 0.001), N stage (P < 0.001) and V stage (P < 0.001) were independent prognostic factors for gastric cancer.
Table 2: Univariate and multivariate analysis of overall survival in training set
Characteristics |
Univariate analysis |
Multivariate analysis |
C-index |
AIC |
||||
|---|---|---|---|---|---|---|---|---|
β |
HR (95% CI) |
P value |
β |
HR (95% CI) |
P value |
|||
Age |
0.203 |
1.225 (1.026–1.464) |
0.025 |
0.283 |
1.327 (1.053–1.671) |
0.016 |
0.528 |
3936.8 |
Gender |
0.017 |
1.017 (0.818–1.265) |
0.879 |
0.499 |
3935.5 |
|||
Tumor location |
0.003 |
1.003 (1.001–1.006) |
0.004 |
0.516 |
3937.0 |
|||
Macroscopic type |
0.540 |
1.716 (1.566–1.879) |
< 0.001 |
0.257 |
1.292 (1.109–1.507) |
0.001 |
0.653 |
3832.8 |
Differentiation degree |
0.422 |
1.525 (1.352–1.720) |
< 0.001 |
0.593 |
3894.7 |
|||
Tumor diameter |
0.632 |
1.882 (1.721–2.058) |
< 0.001 |
0.686 |
3835.3 |
|||
T stage |
0.736 |
2.087 (1.889–2.306) |
<0.001 |
0.681 |
3780.3 |
|||
N stage |
0.657 |
1.930 (1.798–2.072) |
< 0.001 |
0.561 |
1.753 (1.576–1.949) |
< 0.001 |
0.736 |
3698.2 |
V stage |
0.681 |
1.975 (1.820–2.144) |
< 0.001 |
0.340 |
1.405 (1.235–1.599) |
< 0.001 |
0.715 |
3768.2 |
Vessel invasion |
1.087 |
2.966 (2.282–3.855) |
< 0.001 |
0.614 |
3871.8 |
|||
Neural invasion |
1.237 |
3.445 (2.395–4.955) |
< 0.001 |
0.579 |
3880.2 |
|||
HR: Hazard ratio; CI: Confidence interval.
The prognostic value of V stage was also analyzed in validation set using the cutoff points from training set (Table 3). V stage was still the independent prognostic factor for gastric cancer in validation set (P = 0.045).
Table 3: Univariate and multivariate analysis of overall survival in validation set
Characteristics |
Univariate analysis |
Multivariate analysis |
C-index |
AIC |
||||
|---|---|---|---|---|---|---|---|---|
β |
HR (95% CI) |
P value |
β |
HR (95% CI) |
P value |
|||
Age |
0.355 |
1.426 (1.193–1.705) |
< 0.001 |
0.312 |
1.366 (1.093–1.707) |
0.006 |
0.512 |
4137.4 |
Gender |
0.128 |
1.136 (0.922–1.399) |
0.230 |
0.546 |
4146.5 |
|||
Tumor location |
0.005 |
1.005 (1.003–1.008) |
< 0.001 |
0.495 |
4146.4 |
|||
Macroscopic type |
0.587 |
1.798 (1.629–1.984) |
< 0.001 |
0.174 |
1.190 (1.018–1.391) |
0.029 |
0.657 |
4032.1 |
Differentiation degree |
0.473 |
1.606 (1.417–1.819) |
< 0.001 |
0.591 |
4112.3 |
|||
Tumor diameter |
0.519 |
1.681 (1.541–1.833) |
< 0.001 |
0.656 |
4039.4 |
|||
T stage |
0.752 |
2.121 (1.906–2.359) |
< 0.001 |
0.332 |
1.394 (1.071–1.815) |
0.014 |
0.686 |
3979.3 |
N stage |
0.637 |
1.891 (1.762–2.029) |
< 0.001 |
0.485 |
1.625 (1.471–1.795) |
<0.001 |
0.728 |
3919.9 |
V stage |
0.646 |
1.907 (1.752–2.076) |
< 0.001 |
0.200 |
1.221 (1.004–1.486) |
0.045 |
0.701 |
3962.4 |
Vessel invasion |
1.173 |
3.230 (2.490–4.190) |
< 0.001 |
0.627 |
4062.3 |
|||
Neural invasion |
1.214 |
3.366 (2.318–4.887) |
< 0.001 |
0.574 |
4095.7 |
|||
HR: Hazard ratio; CI: Confidence interval.
Comparison of predictive value of V and VNM stage
C-index and AIC were calculated in order to assess the predictive accuracy and prognostic discriminatory ability of each factor for prognosis of gastric cancer in training set (Table 2). A larger C-index and smaller AIC value of V stage were found when compared with tumor diameter (C-index: 0.715 vs 0.686; AIC: 3768.2 vs 3835.3, P < 0.001) and T stage (C-index: 0.715 vs 0.681; AIC: 3768.2 vs 3780.3, P < 0.001) (Figure 2A). VNM stage also revealed significant superiority to TNM stage in predictive accuracy and prognostic discriminatory ability (C-index: 0.756 vs 0.743; AIC: 3667.2 vs 3668.8, P < 0.001) (Figure 2C).
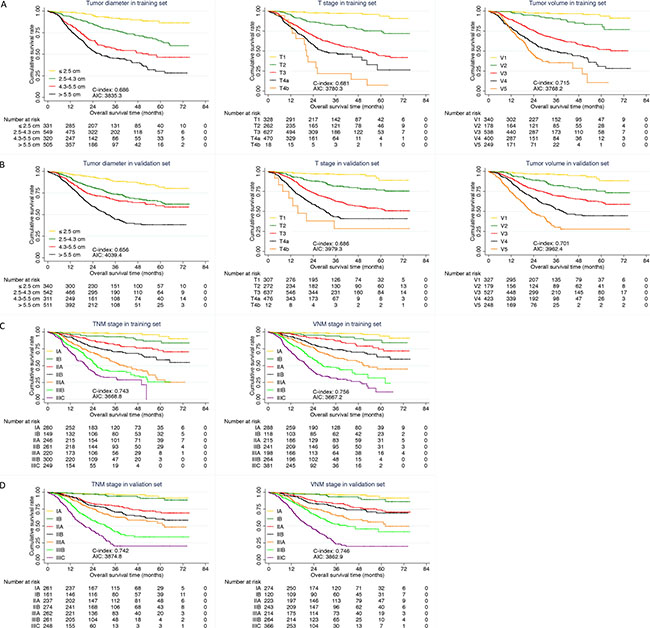
Figure 2: Comparison of predictive value. (A) Comparison among tumor diameter, T stage and V stage in training set; (B) Comparison among tumor diameter, T stage and V stage in validation set; (C) Comparison between TNM and VNM stage in training set; (D) Comparison between TNM and VNM stage in validation set.
In validation set, the predictive accuracy and prognostic discriminatory ability of V stage and VNM stage were still better than that of tumor diameter, T stage (Table 3, Figure 2B) and TNM stage (Figure 2D) respectively.
Multivariable models and nomograms
Two multivariable prediction models were built in training set. TNM model was based on the selection of age, gender, tumor location, macroscopic type, differentiation degree, T stage, N stage, vessel invasion and neural invasion. VNM model was based on the selection of age, gender, tumor location, macroscopic type, differentiation degree, N stage, V stage, vessel invasion and neural invasion. Finally, results of the two multivariable regression models were showed in Table 4. Consistent with the results of multivariate analysis above, V stage was still selected as an independent prognostic factor in VNM model.
Table 4: Multivariable models for predicting overall survival in training set
Characteristics |
TNM model |
VNM model |
||||
|---|---|---|---|---|---|---|
β |
HR (95% CI) |
P value |
β |
HR (95% CI) |
P value |
|
Age |
0.307 |
1.359 (1.080–1.711) |
0.009 |
0.288 |
1.334 (1.059–1.680) |
0.015 |
Macroscopic type |
0.269 |
1.309 (1.121–1.529) |
0.001 |
0.253 |
1.288 (1.103–1.503) |
0.001 |
Differentiation degree |
0.166 |
1.181 (0.966–1.443) |
0.105 |
0.198 |
1.219 (1.000–1.487) |
0.005 |
T stage |
0.412 |
1.510 (1.269–1.798) |
< 0.001 |
— |
— |
— |
N stage |
0.562 |
1.754 (1.575–1.954) |
< 0.001 |
0.541 |
1.719 (1.543–1.913) |
< 0.001 |
V stage |
— |
— |
— |
0.331 |
1.392 (1.223–1.585) |
< 0.001 |
C-index |
0.767 |
0.775 |
||||
AIC |
3648.7 |
3635.6 |
||||
C-index: Harrell’s concordance index; AIC: Akaike Information Criterion;
HR: Hazard ratio; CI: Confidence interval.
Two nomograms were developed for predicting overall survival in training set (Figure 3A and 3C). The VNM model showed significant advantages than TNM model in predictive accuracy and prognostic discriminatory ability (C-index: 0.775 vs 0.767; AIC: 3635.6 vs 3648.7, P < 0.001) (Table 4). The calibration curves of the two models both showed good agreement between predicted and actual outcomes (Figure 3B and 3D).
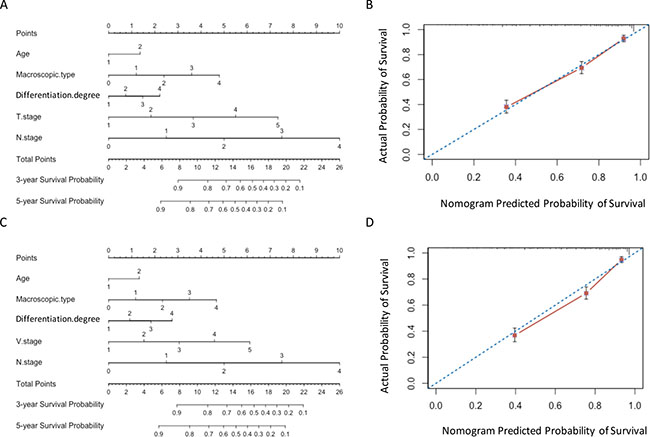
Figure 3: Nomograms in training set. (A) and (B) Nomogram plots and calibration curves of TNM stage; (C) and (D) Nomogram plots and calibration curves of VNM stage.
The results in validation set were consistent with those in training set. The predictive accuracy and prognostic discriminatory ability of VNM model were significant better than those of TNM model (Table 5). The predicted survival of the two models showed good agreement with observed survival (Figure 4).
Table 5: Multivariable models for predicting overall survival in validation set
Characteristics |
TNM model |
VNM model |
||||
|---|---|---|---|---|---|---|
β |
HR (95% CI) |
P value |
β |
HR (95% CI) |
P value |
|
Age |
0.358 |
1.430 (1.144–1.787) |
0.002 |
0.322 |
1.380 (1.104–1.726) |
0.005 |
Macroscopic type |
0.201 |
1.223 (1.048–1.427) |
0.011 |
-0.193 |
1.213 (1.040–1.415) |
0.014 |
Vessel invasion |
0.244 |
1.227 (0.951–1.714) |
0.105 |
0.320 |
1.378 (1.029–1.844) |
0.031 |
T stage |
0.505 |
1.657 (1.380–1.990) |
< 0.001 |
— |
— |
— |
N stage |
0.475 |
1.607 (1.447–1.785) |
< 0.001 |
0.442 |
1.556 (1.400–1.730) |
< 0.001 |
V stage |
— |
— |
— |
0.379 |
1.461 (1.276–1.672) |
< 0.001 |
C-index |
0.767 |
0.769 |
||||
AIC |
3848.6 |
3848.4 |
||||
C-index: Harrell’s concordance index; AIC: Akaike Information Criterion;
HR: Hazard ratio; CI: Confidence interval.
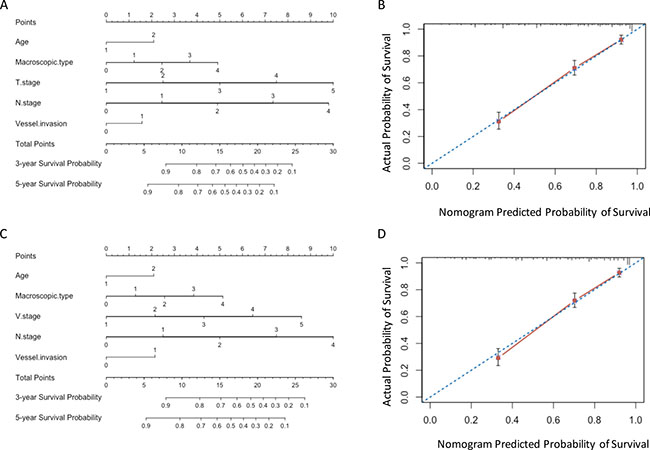
Figure 4: Nomograms in validation set. (A) and (B) Nomogram plots and calibration curves of TNM stage; (C) and (D) Nomogram plots and calibration curves of VNM stage.
Comparison of formulas
In order to evaluate the superiority of the current volume calculating formula, we further validated the formula reported in the previous study using our center’s data (Table 6). The results showed that the V stage, VNM stage and the multivariable model calculated by current formula had a larger C-index and a smaller AIC value than those calculated by the previous formula (all P < 0.001).
Table 6: Comparison and validation between the two formulas
Current formula |
Previous formula |
P value |
|||
|---|---|---|---|---|---|
C-index |
AIC |
C-index |
AIC |
||
Training group |
|||||
V stage |
0.715 |
3768.2 |
0.693 |
3845.4 |
< 0.001 |
VNM stage |
0.756 |
3667.2 |
0.732 |
3753.3 |
< 0.001 |
Multivariable model |
0.775 |
3635.6 |
0.764 |
3712.6 |
< 0.001 |
Validation group |
|||||
V stage |
0.701 |
3962.4 |
0.684 |
3993.3 |
< 0.001 |
VNM stage |
0.746 |
3862.9 |
0.723 |
3917.5 |
< 0.001 |
Multivariable model |
0.769 |
3848.4 |
0.756 |
3908.2 |
< 0.001 |
Current formula: V = Tumor diameter × (T stage)2/2;
Previous formula [33]: V = pT × (tumor size/2)2.
DISCUSSION
The current study investigated the prognostic value of tumor volume for gastric cancer. The results showed that the predictive value of V stage for gastric cancer was superior to tumor diameter and T stage. VNM staging system could significantly improve the predictive accuracy and prognostic discriminatory ability for gastric cancer.
The actual malignancy of gastric cancer is complex due to the variety of appearances and patterns of invasion [17]. Up to now, T stage and N stage were demonstrated to be the most significant prognostic factors for gastric cancer in several previous studies [18–20]. Tumor diameter, which has been considered as a rough indicator of tumor size for gastric cancer [21, 22], was closely related with histologic type, lymph node metastasis, tumor invasion, vessel invasion, neural invasion and peritoneal metastasis [23–25]. Further investigations demonstrated that tumor diameter was an independent prognostic factor for gastric cancer [26–28]. Saito et al. [28] found that tumor diameter could also be used to predict the recurrence site of gastric cancer. Moreover, Deng et al. [29] demonstrated that tumor diameter represented better prognostic stratification ability compared with T stage, while Zhao et al. [16] reported that the prognostic prediction value was comparable between the two variables. In both studies above, they replaced T stage with tumor diameter in the TNM staging system and found that the new classification was more competent in predicting the prognosis of gastric cancer than the current TNM staging system.
However, tumor diameter or T stage alone could not accurately reflect the actual tumor burden of gastric cancer due to this cancer’s complicated morphology and inconsistent pattern of invasion [2, 17, 27, 28]. Thus, a new index which could better reflect the actual size of this tumor is needed.
Tumor volume, which could accurately reflect the tumor burden, may possess significant prognostic value for gastric cancer. Moreover, tumor volume was reported as an independent prognostic factor in several cancers, such as non-small-cell lung carcinoma [30], nasopharyngeal carcinoma [31] and malignant melanoma [32]. However, study assessing the predictive value of tumor volume for gastric cancer is lacking. Up to date, there is only one study reported by Jiang et al [33] that calculated tumor volume via the formula V = pT × (tumor size/2)2 demonstrated tumor volume maybe more reliable than T stage in predicting prognosis of gastric cancer in a cohort of 497 patients. Further, they conducted a VNM staging system by replacing the T stage with tumor volume and found that it was more appropriate than the current TNM staging system in predicting prognosis of gastric cancer patients.
In current study, we calculated the tumor volume based on the formula V = Tumor diameter × T stage2/2. The mathematic model of tumor volume referred to the formula V = length × width2/2 in the tumor bearing mouse model [34]. We used tumor diameter instead of the length and replaced the width with T stage. We first used the C-index and AIC value to evaluate the predictive accuracy and prognostic discriminatory ability for tumor volume, respectively. The predictive value of V stage was higher than tumor diameter and T stage. However, accurate prediction of prognosis is more determined by the staging system than a variable alone [12]. We then conducted the VNM stage on the basis of the two most powerful prognostic predictors—V stage and N stage. The predictive accuracy and prognostic discriminatory ability of VNM stage was better than those of TNM stage.
Further, two nomograms were developed for predicting the overall survival. The VNM model had significant advantages in the predictive accuracy and prognostic discriminatory ability than TNM model. The predicted survival of VNM model showed well agreement with the actual survival.
A good staging system, which could not only be able to predict survival, but also guide the adjuvant therapy, is of great importance for patients with gastric cancer [35]. The predictive superiority of tumor volume demonstrated in current study was consistent with Jiang’s findings [33]. To show the improvement we got in this study, we then validated their formula using our data and found that the tumor volume calculated by our formula V = Tumor diameter × T stage2/2 revealed better predictive accuracy and prognostic discriminatory ability.
There are also some limitations in our present study. First, it was a retrospective study of a single center’s experiences. Multi-center studies are needed to verify the predictive value of tumor volume. Second, the calculation of tumor volume is not simple and immediate. Thus, a more convenient and accurate index which could reflect the tumor burden is needed.
MATERIALS AND METHODS
From September 2008 to March 2015, a total of 3409 gastric cancer patients who received radical gastrectomy in our department were retrospectively analyzed. The inclusion criteria were listed as follows: 1) without neoadjuvant chemotherapy; 2) without multiple stomach tumors or distant metastasis; 3) with complete follow-up records. This study was approved by the Ethics Committee of Xijing Hospital, and written informed consent was obtained from all patients before surgery.
All of the patients received radical gastrectomy according to the recommendation of Japanese Gastric Cancer Treatment Guidelines [11]. The patients were followed up till November 2015 by enhanced chest and abdominal CT and gastroscopy every 3 months.
Clinicopathological data including age, gender, tumor location, macroscopic type, tumor diameter, differentiation degree, T stage, N stage, vessel invasion, neural invasion and TNM stage were recorded. Tumor diameter was measured and defined as the maximum diameter of the tumor according to the Japanese classification of gastric carcinoma: 3rd English edition [36]. The TNM stage were defined on the basis of 7th edition of AJCC cancer staging manual [10].
Data were processed using SPSS 22.0 for Windows (SPSS Inc., Chicago, IL, USA). With the X-tile software (Yale University) [37], the 3409 patients were randomly divided into training set and validation set according to sample size ratio of 1:1. The optimal cut-off values of tumor volume were calculated using X-tile software (Supplementary). Discrete variables were analyzed using the Chi-square test or Fisher’s exact test. Risk factors for survival were identified by univariate analysis and Cox’s proportional hazards regression model was employed for multivariate analysis. Overall survival was analyzed by the Kaplan-Meier method and differences between curves were compared using log-rank test. A backward procedure based on the Akaike information criterion (AIC) was used for multivariable selection. Nomogram and calibration curve were displayed using the package of Regression Modeling Strategies (http://CRAN.R-project.org/package=rms) in R (version3.1.2, http://www.R-project.org/). AIC and concordance index (C-index) values within a cox proportional hazard regression model were calculated in order to compare the prognostic discriminatory ability and predictive accuracy of variables using the package of Harrell Miscellanceous (http://CRAN.R-project.org/package=Hmisc.). A smaller AIC value indicated a better discriminatory ability [38], whereas a larger C-index represented a more predictive accuracy [39]. The likelihood ratio χ2 test was used to compare the different C-indexes between different models. The two-tail P value was considered to be statistically significant at the 5% level.
CONCLUSIONS
Tumor volume was significantly associated with clinicopathological features and prognosis of gastric cancer. The predictive value of tumor volume was higher than tumor diameter and T stage. In comparison with TNM staging system, VNM staging system could improve the predictive accuracy and prognostic discriminatory ability for gastric cancer.
Abbreviations
V: Tumor volume; TNM: Tumor-nodes-metastasis classification; AJCC: American Joint Committee on Cancer; JGCA: Japanese Gastric Cancer Association; AIC: Akaike information criterion; C-index: Concordance index.
ACKNOWLEDGMENTS AND FUNDING
This study was supported in part by grants from the National Natural Scientific Foundation of China [NO. 31100643, 31570907, 81300301, 81572306, 81502403, XJZT12Z03].
CONFLICTS OF INTEREST
There are no financial or other relations that could lead to a conflicts of interest.
REFERENCES
1. Chen W, Zheng R, Baade PD, Zhang S, Zeng H, Bray F, Jemal A, Yu XQ, He J. Cancer statistics in China, 2015. CA Cancer J Clin. 2016; 66:115–32. doi: 10.3322/caac.21338.
2. Lu J, Huang CM, Zheng CH, Li P, Xie JW, Wang JB, Lin JX. Consideration of tumor size improves the accuracy of TNM predictions in patients with gastric cancer after curative gastrectomy. Surg Oncol. 2013; 22:167–71. doi: 10.1016/j.suronc.2013.05.002.
3. Yasuda K, Shiraishi N, Inomata M, Shiroshita H, Izumi K, Kitano S. Prognostic significance of macroscopic serosal invasion in advanced gastric cancer. Hepatogastroenterology. 2007; 54:2028–31.
4. Sekiguchi M, Oda I, Taniguchi H, Suzuki H, Morita S, Fukagawa T, Sekine S, Kushima R, Katai H. Risk stratification and predictive risk-scoring model for lymph node metastasis in early gastric cancer. J Gastroenterol. 2016. doi: 10.1007/s00535-016-1180-6.
5. Deng K, Yang L, Hu B, Wu H, Zhu H, Tang C. The prognostic significance of pretreatment serum CEA levels in gastric cancer: a meta-analysis including 14651 patients. PLoS One. 2015; 10: e0124151. doi: 10.1371/journal.pone.0124151.
6. Hwang GI, Yoo CH, Sohn BH, Shin JH, Park YL, Kim HD, Kim YS, Han WK, Pae WK. Predictive value of preoperative serum CEA, CA19-9 and CA125 levels for peritoneal metastasis in patients with gastric carcinoma. Cancer Res Treat. 2004; 36:178–81. doi: 10.4143/crt.2004.36.3.178.
7. Ohashi T, Komatsu S, Ichikawa D, Kosuga T, Okamoto K, Konishi H, Shiozaki A, Fujiwara H, Otsuji E. Tumor Index as a Combined Indicator of Tumor Depth and Size in Gastric Cancer. Anticancer Res. 2016; 36:1895–900.
8. Melling N, Gruning A, Tachezy M, Nentwich M, Reeh M, Uzunoglu FG, Vashist YK, Izbicki JR, Bogoevski D. Glasgow Prognostic Score may be a prognostic index for overall and perioperative survival in gastric cancer without perioperative treatment. Surgery. 2016; 159:1548–56. doi: 10.1016/j.surg.2016.01.018.
9. Zhao LY, Li CC, Jia LY, Chen XL, Zhang WH, Chen XZ, Yang K, Liu K, Wang YG, Xue L, Zhang B, Chen ZX, Chen JP, et al. Superiority of lymph node ratio-based staging system for prognostic prediction in 2575 patients with gastric cancer: validation analysis in a large single center. Oncotarget. 2016; 7:51069–51081. doi: 10.18632/oncotarget.9714.
10. Washington K. 7th edition of the AJCC cancer staging manual: stomach. Ann Surg Oncol. 2010; 17:3077–9. doi: 10.1245/s10434-010-1362-z.
11. Japanese Gastric Cancer A. Japanese gastric cancer treatment guidelines 2010 (ver. 3). Gastric Cancer. 2011; 14:113–23. doi: 10.1007/s10120-011-0042-4.
12. Wu J, Chen QX. Prognostic and predictive significance of tumor length in patients with esophageal squamous cell carcinoma undergoing radical resection. BMC Cancer. 2016; 16: 394. doi: 10.1186/s12885-016-2417-8.
13. Hattori A, Matsunaga T, Takamochi K, Oh S, Suzuki K. Neither Maximum Tumor Size nor Solid Component Size Is Prognostic in Part-Solid Lung Cancer: Impact of Tumor Size Should Be Applied Exclusively to Solid Lung Cancer. Ann Thorac Surg. 2016; 102:407–15. doi: 10.1016/j.athoracsur.2016.02.074.
14. Stein RG, Wollschlager D, Kreienberg R, Janni W, Wischnewsky M, Diessner J, Stuber T, Bartmann C, Krockenberger M, Wischhusen J, Wockel A, Blettner M, Schwentner L, et al. The impact of breast cancer biological subtyping on tumor size assessment by ultrasound and mammography - a retrospective multicenter cohort study of 6543 primary breast cancer patients. BMC Cancer. 2016; 16: 459. doi: 10.1186/s12885-016-2426-7.
15. Liu Z, Tian Y, Liu S, Xu G, Guo M, Lian X, Fan D, Zhang H, Feng F. Clinicopathological feature and prognosis of primary hepatic gastrointestinal stromal tumor. Cancer Med. 2016. doi: 10.1002/cam4.808.
16. Zhao LY, Zhang WH, Chen XZ, Yang K, Chen XL, Liu K, Zhang B, Chen ZX, Chen JP, Zhou ZG, Hu JK. Prognostic Significance of Tumor Size in 2405 Patients With Gastric Cancer: A Retrospective Cohort Study. Medicine (Baltimore). 2015; 94: e2288. doi: 10.1097/MD.0000000000002288.
17. Japanese Gastric Cancer A. Japanese Classification of Gastric Carcinoma - 2nd English Edition. Gastric Cancer. 1998; 1: 10-24. doi: 10.1007/s101209800016.
18. Roder JD, Bottcher K, Siewert JR, Busch R, Hermanek P, Meyer HJ. Prognostic factors in gastric carcinoma. Results of the German Gastric Carcinoma Study 1992. Cancer. 1993; 72:2089–97.
19. Tabuenca AD, Aitken DR, Ihde JK, Smith J, Garberoglio C. Factors influencing survival in advanced gastric cancer. Am Surg. 1993; 59:855–9.
20. Bozzetti F, Bonfanti G, Morabito A, Bufalino R, Menotti V, Andreola S, Doci R, Gennari L. A multifactorial approach for the prognosis of patients with carcinoma of the stomach after curative resection. Surg Gynecol Obstet. 1986; 162:229–34.
21. Hiki Y, Shimao H, Mieno H, Sakakibara Y, Kobayashi N, Saigenji K. Modified treatment of early gastric cancer: evaluation of endoscopic treatment of early gastric cancers with respect to treatment indication groups. World J Surg. 1995; 19:517–22.
22. Sano T, Kobori O, Muto T. Lymph node metastasis from early gastric cancer: endoscopic resection of tumour. Br J Surg. 1992; 79:241–4.
23. Giuliani A, Caporale A, Di Bari M, Demoro M, Gozzo P, Corona M, Miccini M, Ricciardulli T, Tocchi A. Maximum gastric cancer diameter as a prognostic indicator: univariate and multivariate analysis. J Exp Clin Cancer Res. 2003; 22:531–8.
24. Xu CY, Shen JG, Shen JY, Chen WJ, Wang LB. Ulcer size as a novel indicator marker is correlated with prognosis of ulcerative gastric cancer. Dig Surg. 2009; 26:312–6. doi: 10.1159/000231881.
25. Adachi Y, Oshiro T, Mori M, Maehara Y, Sugimachi K. Tumor size as a simple prognostic indicator for gastric carcinoma. Ann Surg Oncol. 1997; 4:137–40.
26. Bilici A, Uygun K, Seker M, Ustaalioglu BB, Aliustaoglu M, Temiz S, Aksu G, Gezen C, Yavuzer D, Kaya S, Salepci T, Mayadagli A, Gumus M. The effect of tumor size on overall survival in patients with pT3 gastric cancer: experiences from 3 centers. Onkologie. 2010; 33:676–82. doi: 10.1159/000322215.
27. Kunisaki C, Makino H, Takagawa R, Oshima T, Nagano Y, Kosaka T, Ono HA, Otsuka Y, Akiyama H, Ichikawa Y, Shimada H. Tumor diameter as a prognostic factor in patients with gastric cancer. Ann Surg Oncol. 2008; 15:1959–67. doi: 10.1245/s10434-008-9884-3.
28. Saito H, Osaki T, Murakami D, Sakamoto T, Kanaji S, Oro S, Tatebe S, Tsujitani S, Ikeguchi M. Macroscopic tumor size as a simple prognostic indicator in patients with gastric cancer. Am J Surg. 2006; 192:296–300. doi: 10.1016/j.amjsurg.2006.03.004.
29. Deng J, Zhang R, Pan Y, Ding X, Cai M, Liu Y, Liu H, Bao T, Jiao X, Hao X, Liang H. Tumor size as a recommendable variable for accuracy of the prognostic prediction of gastric cancer: a retrospective analysis of 1,521 patients. Ann Surg Oncol. 2015; 22:565–72. doi: 10.1245/s10434-014-4014-x.
30. Lebioda A, Makarewicz R, Malkowski B, Dancewicz M, Kowalewski J, Windorbska W. Measurement of primary tumor volume by PET-CT to evaluate risk of mediastinal nodal involvement in NSCLC patients with clinically negative N2 lymph nodes. Rep Pract Oncol Radiother. 2013; 18:76–81. doi: 10.1016/j.rpor.2012.11.002.
31. Wu Z, Su Y, Zeng RF, Gu MF, Huang SM. Prognostic value of tumor volume for patients with nasopharyngeal carcinoma treated with concurrent chemotherapy and intensity-modulated radiotherapy. J Cancer Res Clin Oncol. 2014; 140:69–76. doi: 10.1007/s00432-013-1542-x.
32. Voss B, Wilop S, Jonas S, El-Komy MH, Schaller J, von Felbert V, Megahed M. Tumor volume as a prognostic factor in resectable malignant melanoma. Dermatology. 2014; 228:66–70. doi: 10.1159/000356121.
33. Jiang N, Deng JY, Ding XW, Liu Y, Liang H. Tumor volume as a prognostic factor was superior to the seventh edition of the pT classification in resectable gastric cancer. Eur J Surg Oncol. 2015; 41:315–22. doi: 10.1016/j.ejso.2014.11.045.
34. Naito S, von Eschenbach AC, Giavazzi R, Fidler IJ. Growth and metastasis of tumor cells isolated from a human renal cell carcinoma implanted into different organs of nude mice. Cancer Res. 1986; 46:4109–15.
35. Rice TW, Rusch VW, Ishwaran H, Blackstone EH, Worldwide Esophageal Cancer C. Cancer of the esophagus and esophagogastric junction: data-driven staging for the seventh edition of the American Joint Committee on Cancer/International Union Against Cancer Cancer Staging Manuals. Cancer. 2010; 116:3763–73. doi: 10.1002/cncr.25146.
36. Japanese Gastric Cancer A. Japanese classification of gastric carcinoma: 3rd English edition. Gastric Cancer. 2011; 14:101–12. doi: 10.1007/s10120-011-0041-5.
37. Camp RL, Dolled-Filhart M, Rimm DL. X-tile: a new bio-informatics tool for biomarker assessment and outcome-based cut-point optimization. Clin Cancer Res. 2004; 10:7252–9. doi: 10.1158/1078-0432.CCR-04-0713.
38. Deng J, Zhang R, Wu L, Zhang L, Wang X, Liu Y, Hao X, Liang H. Superiority of the ratio between negative and positive lymph nodes for predicting the prognosis for patients with gastric cancer. Ann Surg Oncol. 2015; 22:1258–66. doi: 10.1245/s10434-014-4121-8.
39. Huitzil-Melendez FD, Capanu M, O’Reilly EM, Duffy A, Gansukh B, Saltz LL, Abou-Alfa GK. Advanced hepatocellular carcinoma: which staging systems best predict prognosis? J Clin Oncol. 2010; 28:2889–95. doi: 10.1200/JCO.2009.25.9895.