
INTRODUCTION
Primary effusion lymphoma (PEL) is a rare B-cell malignancy that originates from B cells latently infected with Kaposi’s sarcoma-associated herpesvirus (KSHV, also known as human herpesvirus-8, HHV8). PEL is almost exclusively observed in immunosuppressed patients, such as organ transplant recipients and HIV-infected patients [1]. PEL is an aggressive and incurable malignancy, with a median survival of about 6 months even under standard multi-agent chemotherapy [2]. Currently, combinational chemotherapy is the standard of care for PEL, however, the myelosuppressive effects of systemic cytotoxic chemotherapy synergize with those caused by antiretroviral therapy or immune suppression [3, 4]. Therefore, there is still an urgent need to identify new druggable targets and develop effective therapeutic strategy for those PEL patients.
Sphingolipid biosynthesis involves hydrolysis of ceramides to generate sphingosine which is subsequently phosphorylated by one of two sphingosine kinase isoforms (SphK1 or SphK2) to generate sphingosine-1-phosphate (S1P) [5, 6]. Bioactive sphingolipids, including ceramides and S1P, act as signaling molecules that regulate apoptosis and tumor cell survival [5]. In contrast to the generally pro-apoptotic function of ceramides, S1P promotes cell proliferation and survival [6]. We recently reported that one novel and selective SphK2 inhibitor, ABC294640, induces dose-dependent, caspase-mediated apoptosis in PEL cells, and suppresses PEL tumor progression in vivo [7]. Our additional data indicated that several exogenous ceramide and dh-ceramide species, such as C18-Cer and dhC16-Cer, also displayed anti-cancer activities for KSHV+ PEL cells in vitro and in vivo [8]. However, the underlying mechanisms for these exogenous ceramides “killing” PEL cells still require further investigation, which will be helpful to better understand PEL pathogenesis and identify more potential therapeutic targets. In the current study, we used the Illumina microarray to determine the altered gene profile in one KSHV+ PEL cell-line, BCBL-1, exposure to dhC16-Cer. We found that a subset of tumor suppressor genes (TSGs) was up-regulated from dhC16-Cer treated BCBL-1 cells. One of these elevated TSGs, Thrombospondin-1 (THBS1) was required for dhC16-Cer induced PEL cell cycle arrest. Moreover, dhC16-Cer up-regulation of THBS1 was through the suppression of multiple KSHV microRNAs expression.
RESULTS
Transcriptomic analysis of the gene profile altered in dhC16-Cer treated KSHV+ PEL cells
We first used the HumanHT-12 v4 Expression BeadChip (Illumina), which contains more than 47,000 probes derived from the NCBI RefSeq Release 38 and other sources, to study the gene profile altered within BCBL-1 cells exposure to dhC16-Cer. We found that 101 genes were significantly up-regulated and 79 were down-regulated (≥ 2 fold and p < 0.05) within dhC16-Cer treated BCBL-1 cells when compared to vehicle treated cells. The top 20 up-regulated or down-regulated candidate genes were listed in Tables 1 and 2, respectively. For validation of microarray analysis, we next selected 5 candidate genes from Tables 1 and 2, respectively, to perform qRT-PCR analysis. Our results indicated that all of the 10 selected genes were significantly altered in a manner comparable to those found in the microarray data, demonstrating the credibility of our results. Specifically, CCL3, TRIML2, RHOB, THBS1 and KLF6 were significantly up-regulated, while DHRS2, HIST2H2AA3, H2AFJ, RGS2 and GADD45B were significantly down-regulated within BCBL-1 cells exposure to dhC16-Cer (Figure 1). We also performed enrichment analysis of these significantly altered candidates by using the Gene Ontology (GO) Processes and Process Networks modules from Metacore Software (Thompson Reuters). Our analysis showed that these significantly altered candidates belong to several functional categories, including cell cycle regulation, apoptosis/anti-apoptosis, cell proliferation, DNA damage and the unfolded protein response (UPR) (Figure 2). In addition, the detailed top 3 scored map (map with the lowest p value) based on the enrichment distribution sorted by ‘Statistically significant Maps’ set were shown in Supplementary Figures 1–3, respectively, including the dCTP/dUTP metabolism, cell cycle_start of DNA replication in early S phase and cell cycle_role of 14-3-3 proteins in cell cycle regulation.
Table 1: The top 20 genes up-regulated within dhC16-Cer treated KSHV+ BCBL-1 cells (vs vehicle-treated cells)
Gene Symbol |
Gene Description |
Fold |
|---|---|---|
CCL3L3 |
Chemokine (C-C motif) ligand 3-like 3 |
20.96 |
CCL3 |
Chemokine (C-C motif) ligand 3 |
14.52 |
TRIML2 |
Tripartite motif family-like 2 |
6.1 |
RHOB |
Ras homolog gene family, member B |
5.19 |
RNF145 |
Ring finger protein 145 |
5.05 |
LOC731042 |
PREDICTED: Hypothetical protein LOC731042 |
4.99 |
LDLR |
Low density lipoprotein receptor (familial hypercholesterolemia) |
4.83 |
THBS1 |
Thrombospondin 1 |
4.21 |
KLF6 |
Kruppel-like factor 6 |
3.96 |
EIF2AK3 |
Eukaryotic translation initiation factor 2-alpha kinase 3 |
3.85 |
KLF2 |
Kruppel-like factor 2 |
3.72 |
UHRF1 |
Ubiquitin-like with PHD and ring finger domains 1 |
3.63 |
ZFP42 |
Zinc finger protein 42 homolog |
3.6 |
APOBEC3B |
Apolipoprotein B mRNA editing enzyme, catalytic polypeptide-like 3B |
3.4 |
RRM2 |
Ribonucleotide reductase M2 polypeptide |
3.32 |
LOC440871 |
PREDICTED: Similar to Ig kappa chain V-III region VH precursor |
3.32 |
INSIG1 |
Insulin induced gene 1 |
3.28 |
DTL |
Denticleless homolog |
3.17 |
SPRR1A |
Small proline-rich protein 1A |
3.05 |
CCR7 |
Chemokine (C-C motif) receptor 7 |
3.03 |
Table 2: The top 20 genes down-regulated within dhC16-Cer treated KSHV+ BCBL-1 cells (vs vehicle-treated cells)
Gene Symbol |
Gene Description |
Fold |
|---|---|---|
HSPA6 |
Heat shock 70kDa protein 6 |
0.03 |
HSPA7 |
Heat shock 70kDa protein 7 |
0.04 |
DHRS2 |
Dehydrogenase/reductase (SDR family) member 2 |
0.12 |
HIST2H2AA3 |
Histone cluster 2, H2aa3 |
0.16 |
HIST2H2AA4 |
Histone cluster 2, H2aa4 |
0.16 |
HSPA1B |
Heat shock 70kDa protein 1B |
0.18 |
H2AFJ |
H2A histone family, member J |
0.2 |
RGS2 |
Regulator of G-protein signalling 2 |
0.2 |
GADD45B |
Growth arrest and DNA-damage-inducible, beta |
0.21 |
HIST2H2AC |
Histone cluster 2, H2ac |
0.22 |
MIR1974 |
MicroRNA 1974 |
0.22 |
CYP4F11 |
Cytochrome P450, family 4, subfamily F, polypeptide 11 |
0.29 |
ACTA2 |
Actin, alpha 2, smooth muscle, aorta |
0.29 |
HIST1H1C |
Histone cluster 1, H1c |
0.3 |
RAB38 |
RAB38, member RAS oncogene family |
0.3 |
KLHL13 |
Kelch-like 13 |
0.32 |
FOSB |
FBJ murine osteosarcoma viral oncogene homolog B |
0.33 |
HIST1H4H |
Histone cluster 1, H4h |
0.35 |
SDSL |
Serine dehydratase-like |
0.35 |
LAMA5 |
Laminin, alpha 5 |
0.37 |
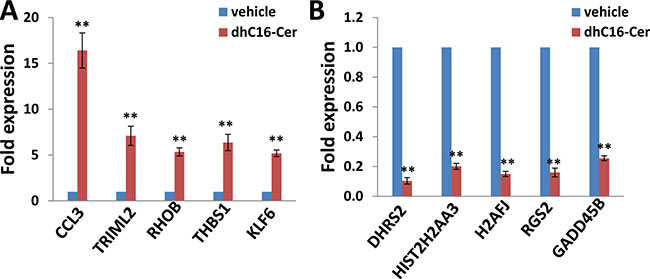
Figure 1: Experimental validation of gene profile alterations in dhC16-Cer treated PEL cells. (A–B) The transcriptional levels of 5 selected candidate genes that were up-regulated or down-regulated in dhC16-Cer treated BCBL-1 cells from microarray data were validated by using qRT-PCR. Error bars represent the S.E.M. for 3 independent experiments. ** = p < 0.01 (vs vehicle treated cells).
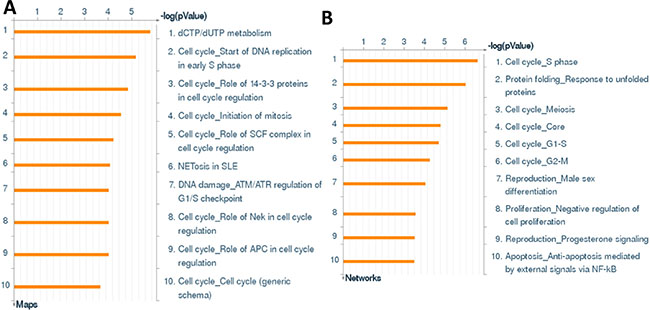
Figure 2: The enrichment analysis of gene profile alterations in dhC16-Cer treated PEL cells. (A–B) The enrichment analysis of gene profile significantly altered (up/down ≥ 2 fold and p < 0.05) in dhC16-Cer treated BCBL-1 cells was performed using the Metacore Software (Thompson Reuters) Modules: Gene Ontology Processes (A) and Process Networks (B).
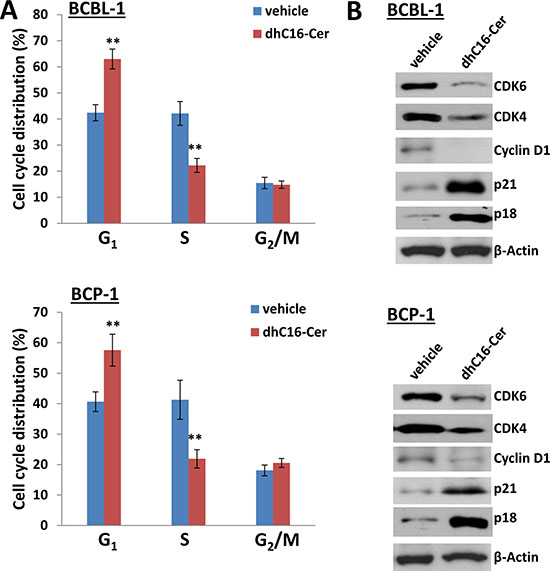
Figure 3: dhC16-Cer treatment causes G1 cell cycle arrest in PEL cells. (A) BCBL-1 and BCP-1 were incubated with dhC16-Cer (40 μM) or vehicle for 24 h, then stained by propidium iodide (PI) and analyzed by flow cytometry. Error bars represent the S.E.M. for 3 independent experiments. ** = p < 0.01. (B) The expression of cell cycle/check-point related proteins was measured by immunoblots.
One of the major features is that many cell cycle check point or regulatory proteins were altered within dhC16-Cer treated PEL cells, implying that dhC16-Cer treatment can affect PEL cell cycle. For functional validation, we found that dhC16-Cer treatment significantly caused G1 cell cycle arrest as well as reducing S phase subpopulation for 2 KSHV+ PEL cell-lines, BCBL-1 and BCP-1 (Figure 3A). Immunoblots analysis confirmed that dhC16-Cer reduced the expression of check-point regulatory proteins such as CDK4, CDK6 and Cyclin D1, but increased the expression of p18 and p21 within both PEL cell-lines (Figure 3B).
dhC16-Cer treatment up-regulates a subset of tumor suppressor genes (TSGs) from KSHV+ PEL cells
Interestingly, we noticed a subset of TSGs up-regulated within dhC16-Cer treated PEL cells based on our microarray data when crosslinked to the TSG database (https://bioinfo.uth.edu/TSGene/), which were listed in Supplementary Table 1. We therefore selected 10 TSGs (including AIM2, BTG3, CHD5, E2F2, EDNRB, KLF6, RHOB, S100A2, THBS1 and USP12) and our qRT-PCR analysis confirmed their significant up-regulation in dhC16-Cer treated BCBL-1 and BCP-1 cell-lines, when compared to vehicle controls (Figure 4). Among these TSGs, S100A2 and THBS1 have been reported as direct cellular targets by multiple KSHV microRNAs [10, 11]. Repression of THBS1 expression also reduced downstream TGF-β signaling activities [10], which are related to enhance cell survival and angiogenesis for KSHV-infected cells [12, 13]. However, the cellular function of THBS1 in KSHV+ PEL cells, especially for cell cycle regulation remains unclear. So we determined to select THBS1 for further functional study.
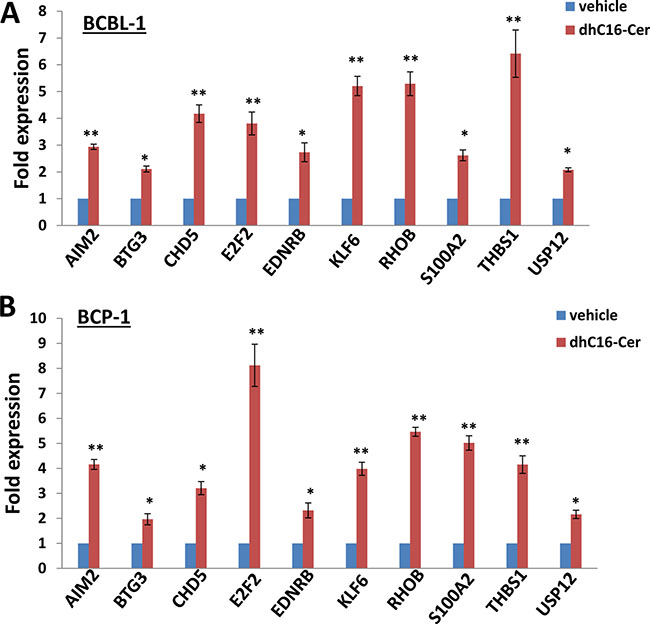
Figure 4: dhC16-Cer treatment up-regulates a subset of tumor suppressor genes from PEL cells. (A–B) BCBL-1 and BCP-1 were incubated with dhC16-Cer (40 μM) or vehicle for 24 h, then gene transcripts were quantified by using qRT-PCR. Error bars represent the S.E.M. for 3 independent experiments. * = p < 0.05, ** = p < 0.01 (vs vehicle treated cells).
THBS1 is required for dhC16-Cer induced KSHV+ PEL cell cycle arrest
We first found low basal level of THBS1 expression in both PEL cell-lines, BCBL-1 and BCP-1, as described previously [11]. In contrast to this, dhC16-Cer treatment greatly increased THBS1 expression in both PEL cell-lines (Figure 5A). We next silenced THBS1 with specific siRNA, which simultaneously increasing CDK6 but reducing p21 expression within dhC16-Cer treated PEL cells when compared to negative siRNA transfected controls (Figure 5B). By using the flow cytometry analysis, we found that “knocked-down” THBS1 significantly reduced G1 phase subpopulation while increasing S phase subpopulation for PEL cells exposure to dhC16-Cer. However, we noticed that “knock-down” THBS1 alone could not completely rescue PEL cells from dhC16-Cer induced G1 cell cycle arrest, implying other cellular regulators involved in this process as well (Figure 5C).
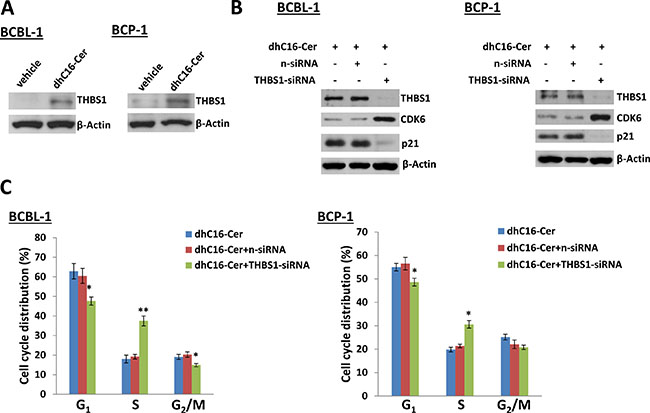
Figure 5: Up-regulation of THBS1 is required for dhC16-Cer caused PEL cell cycle arrest. (A) BCBL-1 and BCP-1 were incubated with dhC16-Cer (40 μM) or vehicle for 24 h, then protein expression was measured by immunoblots. (B–C) PEL cells were first transfected with either negative control siRNA (n-siRNA) or THBS1-siRNA for 48 h, then incubated with dhC16-Cer (40 μM) for additional 24 h. The protein expression and cell cycle were measured by using immunoblots and flow cytometry as described above. Error bars represent the S.E.M. for 3 independent experiments. * = p < 0.05,** = p < 0.01.
dhC16-Cer up-regulation of THBS1 is through repression of KSHV microRNAs
KSHV encodes 25 mature microRNAs (miRNAs) derived from 12 precursor miRNAs (pre-miRs), which are highly expressed within KSHV infected cells and KSHV+ tumor tissues [14–16]. KSHV miRNAs not only promote viral latency but also modulate a lot of cellular functions important to virus infected cell survival and pathogenesis, by targeting viral genes or cellular factors [17–20]. Previous studies have reported that THBS1 can be directly targeted by multiple KSHV miRNAs (e.g. miR-K12-1, -3, -4, -5, -6, -7, -9 and -11) at its 3′UTR region [10, 11]. Therefore, we hypothesize whether dhC16-Cer increasing THBS1 expression through regulation of KSHV miRNAs. To prove that, we first found that dhC16-Cer treatment dramatically repressed the expression of several KSHV-miRNAs, including miR-K12-1, -3, -4, -5, -9 and -11 from BCBL-1 and BCP-1 cell-lines by using qRT-PCR analysis (Figure 6A and Supplementary Figure 4). Next, we selected miR-K12-1 and miR-K12-11 for further experiments, and rescued their expression with recombinant constructs as described previously [10], which successfully reducing THBS1 and p21 expression while increasing CDK6 expression from dhC16-Cer treated BCBL-1 cells (Figure 6B and Supplementary Figure 5). By using the flow cytometry analysis, we confirmed that overexpression of miR-K12-1 and/or miR-K12-11 significantly reduced G1 phase subpopulation while increasing S phase subpopulation for PEL cells exposure to dhC16-Cer (Figure 6C). Together, these data demonstrated that multiple KSHV miRNAs are really involved in dhC16-Cer up-regulation of THBS1 from PEL cells and causing tumor cell cycle arrest.
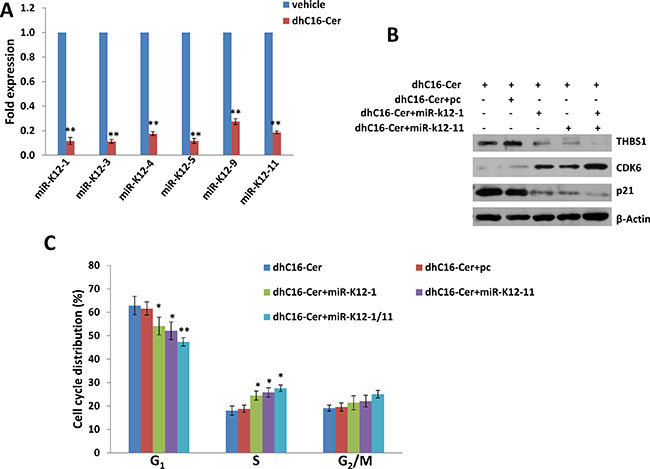
Figure 6: Up-regulation of THBS1 by dhC16-Cer is through suppression of KSHV microRNAs. (A) BCBL-1 were incubated with dhC16-Cer (40 μM) or vehicle for 24 h, then KSHV microRNA transcripts were quantified using qRT-PCR as described in Methods. (B–C) BCBL-1were first transfected with control vector (pc), vectors encoding miR-K12-1 or miR-K12-11 or both for 48 h. Thereafter, cells were incubated with dhC16-Cer (40 μM) for additional 24 h. The protein expression and cell cycle were measured by using immunoblots and flow cytometry as described above. Error bars represent the S.E.M. for 3 independent experiments. * = p < 0.05, ** = p < 0.01.
DISCUSSION
To our knowledge, this is the first transcriptomic analysis of the gene profile altered in KSHV+ PEL cell-line exposure to exogenous ceramides. We found that exogenous dhC16-Cer treatment affected many cellular genes expression, while most of them, their functional contribution to PEL pathogenesis remain largely unknown. For example, several chemokines or their receptors such as CCL3, CCL3L3 and CCR7 were up-regulated in dhC16-Cer treated PEL cells. In addition to its pro-inflammatory activities, CCL3 (also known as Macrophage inflammatory protein-1α, MIP-1α) negatively regulates the proliferation of hematopoietic stem/progenitor cells (HSPCs) [21, 22]. There is accumulating evidence supporting a crucial involvement of CCL3 in the pathophysiology of several types of leukemia arising from neoplastic transformation of HSPCs, such as chronic myeloid leukemia (CML), acute myeloid leukemia (AML) and chronic lymphocytic leukemia (CLL) [21, 23, 24]. Recent findings support CCL3 and CCL4 protein concentrations as biomarkers for B cell receptor (BCR) pathway activation and prognosis in diffuse large B cell lymphoma (DLBCL) [25]. However, the role of CCL3 and its signaling in PEL pathogenesis requires further investigation.
Notably, we found a subset of TSGs up-regulated in dhC16-Cer treated PEL cells, however, most of them have never been reported related to KSHV pathogenesis or tumorigenesis. For example, RHOB is a mainly endosomal small GTPase that regulates actin organization and vesicle trafficking, which resulting in the suppression of cancer cell proliferation, survival, invasion, and metastasis [26]. In support of its role as a negative modifier of cancer progression, targeted deletion of RHOB in mice can increase tumor formation initiated by Ras mutation [27]. Another TSG, KLF6, is frequently inactivated by loss of heterozygozity (LOH), somatic mutation, and/or decreased expression in human cancer [28]. KLF6 has been found to regulate multiple signaling pathways, including transactivation of p21 in a p53-independent manner, reduction of Cyclin D1/CDK4 complexes via interaction with Cyclin D1, inhibition of c-Jun proto-oncoprotein activities and decreased vascular endothelial growth factor (VEGF) expression [29–31].
We found that one of TSGs, THBS1 is required for dhC16-Cer induced PEL cell cycle arrest, due to suppression of KSHV miRNAs expression. Previous studies have reported that THBS1 can be directly targeted by multiple KSHV miRNAs at its 3′UTR region [10, 11]. Since most of KSHV miRNAs promote viral latency, our recent data indicate that targeting sphingolipid metabolism by either sphingosine kinase inhibitor or exogenous ceramide species induces viral lytic gene expression from KSHV latently infected cells [8, 32]. Our previous study also found that the SphK2 inhibitor, ABC294640, repressed KSHV microRNAs expression from virus-infected endothelial cells [32]. Therefore, our findings support the possibility that sphingolipid metabolism can manipulate viral factors (e.g. miRNA) to regulate host cellular genes (e.g. TSG). The remaining question is how exogenous ceramides (e.g. dhC16-Cer) can regulate viral miRNAs synthesis/expression. Dicer is a central regulator of miRNA maturation, encoding an enzyme that cleaves double-stranded RNA or stem-loop-stem RNA into 20–25 nucleotide long small RNA [33]. One recent study has reported that Cyclin D1 (−/−) cells are defective in pre-miRNA processing which is restored by Cyclin D1 rescue [34]. Here we found that dhC16-Cer treatment caused PEL G1 cell cycle arrest via reducing Cyclin D1 expression. It will be interested to determine whether Cyclin D1 is involved in dhC16-Cer suppression of KSHV miRNAs expression in future study.
Our data demonstrate that exogenous ceramides display anti-cancer activities for PEL through regulation of both host and oncogenic virus factors. Targeting sphingolipid metabolism by exogenous ceramides or other ceramide analogs may represent a promising therapeutic strategy against these virus-associated malignancies.
MATERIALS AND METHODS
Cell culture and reagents
Body cavity-based lymphoma cells (BCBL-1, KSHV+/EBVneg) were kindly provided by Dr. Dean Kedes (University of Virginia) and maintained in RPMI 1640 medium (Gibco) with supplements as described previously [9]. BCP-1 (KSHV+/EBVneg) cells were purchased from ATCC and maintained in complete RPMI 1640 medium (ATCC) supplemented with 20% FBS. All cells were incubated at 37°C in 5% CO2. All experiments were carried out using cells harvested at low (< 20) passages. dhC16-Cer was purchased from Avanti Polar Lipids.
Microarray
Microarray analysis was performed and analyzed at the Stanley S. Scott Cancer Center’s Translational Genomics Core at LSUHSC. Total RNA was isolated using Qiagen RNeasy kit (Qiagen), and 500 ng of total RNA was used to synthesize dscDNA. Biotin-labeled RNA was generated using the TargetAmp-Nano Labeling Kit for Illumina Expression BeadChip (Epicentre), and hybridized to the HumanHT-12 v4 Expression BeadChip (Illumina) at 58°C for 16 h. The chip was washed, stained with streptavadin-Cy3, and scanned with the Illumina BeadStation 500 and BeadScan. Using the Illumina’s GenomeStudio software, we normalized the signals using the “cubic spline algorithm” that assumes that the distribution of transcript abundance is similar in all samples. The background signal was removed using the “detection p-value algorithm” to remove targets with signal intensities equal or lower than that of irrelevant probes (with no known targets in the human genome but thermodynamically similar to the relevant probes). The microarray experiments were performed twice for each group and the average values were used for analysis. Common and unique sets of genes and enrichment analysis were performed using the MetaCore Software (Thompson Reuters). The microarray original data have been submitted to Gene Expression Omnibus (GEO) database (Accession number: GSE90038).
Transfection assays
Cells were also transfected in 12-well plates using Lipofectamine 2000 (Invitrogen) for 48 h and constructs for overexpression of miR-K12-1 and miR-K12-11 as previously described [10]. Transfection efficiency was normalized through co-transfection of a lacZ reporter construct and determination of β-galactosidase activity using a commercial β-galactosidase enzyme assay system according to the manufacturer’s instructions (Promega). For RNA interference, THBS1 ON-TARGET plus SMART pool siRNA, or negative control siRNA (n-siRNA) (Dharmacon), were delivered using the DharmaFECT transfection reagent according to the manufacturer’s instructions.
Cell cycle analysis
PEL cell pellets were fixed in 70% ethanol, and incubated at 4°C overnight. Cell pellets were re-suspended in 0.5 mL of 0.05 mg/mL propidium iodide (PI) plus 0.2 mg/mL RNaseA and incubated at 37°C for 30 min. Cell cycle distribution was analyzed on a FACS Calibur 4-color flow cytometer (BD Bioscience).
Immunoblotting
Total cell lysates (20 μg) were resolved by 10% SDS–PAGE, transferred to nitrocellulose membranes, and immunoblotted with antibodies for THBS1, Cyclin D1, CDK4, CDK6, p18, p21 (Cell Signaling) and β-Actin (Sigma) for loading controls. Immunoreactive bands were identified using an enhanced chemiluminescence reaction (Perkin-Elmer), and visualized by autoradiography.
qRT-PCR
Total RNA was isolated using the RNeasy Mini kit (QIAGEN), and cDNA was synthesized from equivalent total RNA using a SuperScript III First-Strand Synthesis SuperMix Kit (Invitrogen) according to the manufacturer’s instructions. Primers used for amplification of target genes are listed in Supplementary Table 2. Amplification was carried out using an iCycler IQ Real-Time PCR Detection System, and cycle threshold (Ct) values were tabulated in duplicate for each gene of interest in each experiment. “No template” (water) controls were used to ensure minimal background contamination. Using mean Ct values tabulated for each gene, and paired Ct values for β-actin as a loading control, fold changes for experimental groups relative to assigned controls were calculated using automated iQ5 2.0 software (Bio-rad). For amplification of viral miRNAs, cDNA was synthesized using the Taqman miRNA RT kit (Applied Biosystems), and qPCR was performed using the Taqman MicroRNA Assays kit (Applied Biosystems) and a 7500 Real Time PCR System. Fold changes for microRNA were calculated using paired Ct values for RNU6B as recommended by the manufacturer (Applied Biosystems).
Statistical analysis
Significance for differences between experimental and control groups was determined using the two-tailed Student’s t-test (Excel 8.0), and p values < 0.0 5 or < 0.01 were considered significant or highly significant, respectively.
ACKNOWLEDGMENTS AND FUNDING
This work was supported by grants from a DOD Career Development Award to Z.Q. (CA140437), the SOM Research Enhancement Funding (2015–2016) to Z.Q., the Leukemia Research Foundation (2016–2017) to Z.Q., a Louisiana Clinical and Translational Science Center Pilot grant (U54GM104940 from NIH) to Z.Q. and Z.L., as well as awards from the National Natural Science Foundation of China (81272191, 81472547, 81672924 to Z.Q. and 81400164 to L.D.). J.Q. was supported by funding from Shanghai Science and Technology committee (14411971400) and Pudong Science and Technology committee, Shanghai (PK2013-17). Funding sources had no role in study design, data collection and analysis, decision to publish, or preparation of the manuscript.
CONFLICTS OF INTEREST
All the authors declare no conflicts of interest.
REFERENCES
1. Cesarman E, Chang Y, Moore PS, Said JW, Knowles DM. Kaposi’s sarcoma-associated herpesvirus-like DNA sequences in AIDS-related body-cavity-based lymphomas. N Engl J Med. 1995; 332:1186–1191.
2. Chen YB, Rahemtullah A, Hochberg E. Primary effusion lymphoma. Oncologist. 2007; 12:569–576.
3. Simonelli C, Spina M, Cinelli R, Talamini R, Tedeschi R, Gloghini A, Vaccher E, Carbone A, Tirelli U. Clinical features and outcome of primary effusion lymphoma in HIV-infected patients: a single-institution study. J Clin Oncol. 2003; 21:3948–3954.
4. Boulanger E, Gerard L, Gabarre J, Molina JM, Rapp C, Abino JF, Cadranel J, Chevret S, Oksenhendler E. Prognostic factors and outcome of human herpesvirus 8-associated primary effusion lymphoma in patients with AIDS. J Clin Oncol. 2005; 23:4372–4380.
5. Ogretmen B, Hannun YA. Biologically active sphingolipids in cancer pathogenesis and treatment. Nat Rev Cancer. 2004; 4:604–616.
6. Takabe K, Paugh SW, Milstien S, Spiegel S. “Inside-out” signaling of sphingosine-1-phosphate: therapeutic targets. Pharmacol Rev. 2008; 60:181–195.
7. Qin Z, Dai L, Trillo-Tinoco J, Senkal C, Wang W, Reske T, Bonstaff K, Del Valle L, Rodriguez P, Flemington E, Voelkel-Johnson C, Smith CD, Ogretmen B, et al. Targeting Sphingosine Kinase Induces Apoptosis and Tumor Regression for KSHV-Associated Primary Effusion Lymphoma. Mol Cancer Ther. 2014; 13:154–164.
8. Dai L, Trillo-Tinoco J, Bai A, Chen Y, Bielawski J, Del Valle L, Smith CD, Ochoa AC, Qin Z, Parsons C. Ceramides promote apoptosis for virus-infected lymphoma cells through induction of ceramide synthases and viral lytic gene expression. Oncotarget. 2015; 6:24246–24260. doi: 10.18632/oncotarget.4759.
9. Dai L, Cao Y, Chen Y, Parsons C, Qin Z. Targeting xCT, a cystine-glutamate transporter induces apoptosis and tumor regression for KSHV/HIV-associated lymphoma. J Hematol Oncol. 2014; 7:30.
10. Samols MA, Skalsky RL, Maldonado AM, Riva A, Lopez MC, Baker HV, Renne R. Identification of cellular genes targeted by KSHV-encoded microRNAs. PLoS pathogens. 2007; 3:e65.
11. Haecker I, Gay LA, Yang Y, Hu J, Morse AM, McIntyre LM, Renne R. Ago HITS-CLIP expands understanding of Kaposi’s sarcoma-associated herpesvirus miRNA function in primary effusion lymphomas. PLoS Pathog. 2012; 8:e1002884.
12. Lei X, Zhu Y, Jones T, Bai Z, Huang Y, Gao SJ. A Kaposi’s sarcoma-associated herpesvirus microRNA and its variants target the transforming growth factor beta pathway to promote cell survival. J Virol. 2012; 86:11698–11711.
13. DiMaio TA, Gutierrez KD, Lagunoff M. Kaposi’s sarcoma-associated herpesvirus downregulates transforming growth factor beta2 to promote enhanced stability of capillary-like tube formation. J Virol. 2014; 88:14301–14309.
14. Marshall V, Parks T, Bagni R, Wang CD, Samols MA, Hu J, Wyvil KM, Aleman K, Little RF, Yarchoan R, Renne R, Whitby D. Conservation of virally encoded microRNAs in Kaposi sarcoma—associated herpesvirus in primary effusion lymphoma cell lines and in patients with Kaposi sarcoma or multicentric Castleman disease. J Infect Dis. 2007; 195:645–659.
15. O’Hara AJ, Chugh P, Wang L, Netto EM, Luz E, Harrington WJ, Dezube BJ, Damania B, Dittmer DP. Pre-micro RNA signatures delineate stages of endothelial cell transformation in Kaposi sarcoma. PLoS pathogens. 2009; 5:e1000389.
16. Cullen BR. Herpesvirus microRNAs: phenotypes and functions. Curr Opin Virol. 2011; 1:211–215.
17. Bellare P, Ganem D. Regulation of KSHV lytic switch protein expression by a virus-encoded microRNA: an evolutionary adaptation that fine-tunes lytic reactivation. Cell Host Microbe. 2009; 6:570–575.
18. Lu F, Stedman W, Yousef M, Renne R, Lieberman PM. Epigenetic regulation of Kaposi’s sarcoma-associated herpesvirus latency by virus-encoded microRNAs that target Rta and the cellular Rbl2-DNMT pathway. J Virol. 2010; 84:2697–2706.
19. Liang D, Gao Y, Lin X, He Z, Zhao Q, Deng Q, Lan K. A human herpesvirus miRNA attenuates interferon signaling and contributes to maintenance of viral latency by targeting IKKepsilon. Cell Res. 2011; 21:793–806.
20. Bai Z, Huang Y, Li W, Zhu Y, Jung JU, Lu C, Gao SJ. Genomewide mapping and screening of Kaposi’s sarcoma-associated herpesvirus (KSHV) 3′ untranslated regions identify bicistronic and polycistronic viral transcripts as frequent targets of KSHV microRNAs. J Virol. 2014; 88:377–392.
21. Baba T, Mukaida N. Role of macrophage inflammatory protein (MIP)-1alpha/CCL3 in leukemogenesis. Mol Cell Oncol. 2014; 1:e29899.
22. Graham GJ, Wright EG, Hewick R, Wolpe SD, Wilkie NM, Donaldson D, Lorimore S, Pragnell IB. Identification and characterization of an inhibitor of haemopoietic stem cell proliferation. Nature. 1990; 344:442–444.
23. Owen-Lynch PJ, Czaplewski LG, Hunter MG, Whetton AD. The growth inhibitory role and potential clinical value of macrophage inflammatory protein 1 alpha in myeloid leukaemias. Leuk Lymphoma. 1998; 30:41–53.
24. Davids MS, Brown JR. Targeting the B cell receptor pathway in chronic lymphocytic leukemia. Leuk Lymphoma. 2012; 53:2362–2370.
25. Takahashi K, Sivina M, Hoellenriegel J, Oki Y, Hagemeister FB, Fayad L, Romaguera JE, Fowler N, Fanale MA, Kwak LW, Samaniego F, Neelapu S, Xiao L, et al. CCL3 and CCL4 are biomarkers for B cell receptor pathway activation and prognostic serum markers in diffuse large B cell lymphoma. Br J Haematol. 2015; 171:726–735.
26. Huang M, Prendergast GC. RhoB in cancer suppression. Histol Histopathol. 2006; 21:213–218.
27. Liu AX, Rane N, Liu JP, Prendergast GC. RhoB is dispensable for mouse development, but it modifies susceptibility to tumor formation as well as cell adhesion and growth factor signaling in transformed cells. Mol Cell Biol. 2001; 21:6906–6912.
28. DiFeo A, Martignetti JA, Narla G. The role of KLF6 and its splice variants in cancer therapy. Drug Resist Updat. 2009; 12:1–7.
29. Narla G, Heath KE, Reeves HL, Li D, Giono LE, Kimmelman AC, Glucksman MJ, Narla J, Eng FJ, Chan AM, Ferrari AC, Martignetti JA, Friedman SL. KLF6, a candidate tumor suppressor gene mutated in prostate cancer. Science. 2001; 294:2563–2566.
30. Benzeno S, Narla G, Allina J, Cheng GZ, Reeves HL, Banck MS, Odin JA, Diehl JA, Germain D, Friedman SL. Cyclin-dependent kinase inhibition by the KLF6 tumor suppressor protein through interaction with cyclin D1. Cancer Res. 2004; 64:3885–3891.
31. Slavin DA, Koritschoner NP, Prieto CC, Lopez-Diaz FJ, Chatton B, Bocco JL. A new role for the Kruppel-like transcription factor KLF6 as an inhibitor of c-Jun proto-oncoprotein function. Oncogene. 2004; 23:8196–8205.
32. Dai L, Plaisance-Bonstaff K, Voelkel-Johnson C, Smith CD, Ogretmen B, Qin Z, Parsons C. Sphingosine kinase-2 maintains viral latency and survival for KSHV-infected endothelial cells. PLoS One. 2014; 9:e102314.
33. Gregory RI, Chendrimada TP, Shiekhattar R. MicroRNA biogenesis: isolation and characterization of the microprocessor complex. Methods Mol Biol. 2006; 342:33–47.
34. Yu Z, Wang L, Wang C, Ju X, Wang M, Chen K, Loro E, Li Z, Zhang Y, Wu K, Casimiro MC, Gormley M, Ertel A, et al. Cyclin D1 induction of Dicer governs microRNA processing and expression in breast cancer. Nat Commun. 2013; 4:2812.