
INTRODUCTION
Lung cancer is one of the most common malignant tumors and has a relatively poor 5-year relative survival rate in the world [1, 2]. There are two major forms of lung cancer: non-small cell lung cancer (NSCLC) and small cell lung cancer (SCLC), and NSCLC accounts for more than 80% of lung cancer. The exact mechanisms of underlying lung cancer are not fully elucidated. Smoking is considered to be a major environmental risk factor for lung cancer, but there are still 15% of male lung cancer cases and 53% of female lung cancer cases are not due to smoking [3]. A growing number of studies have indicated that genetic aberrations may be important in the genesis and development of human cancer [4–6]. Therefore, deep exploration of the relationship between genetic aberrations and NSCLC is needed to enhance risk prediction and improve prognosis.
The genesis and development of cancer is a multistage process which involves many genes and their interactions, and traditional studies that focus on single gene could no longer meet the demand any more. Microarray technology has been widely applied to global assessment of differentially expressed genes (DEGs) in many diseases. And then, by using bioinformatics method and experimental technology, the key genes involved in the pathogenesis of disease were found from candidate DEGs [7–9].
Any changes in DNA may influence the amino acid sequence or protein abundance. Single nucleotide polymorphisms (SNPs) are the most common type of genetic variation in human. It is characterized by a single nucleotide change in genome. The SNPs on exon usually brings the changes of amino acid sequence and further affect the function of protein. Those SNPs located at introns especially around 3′ untranslated regions (3′UTR), promoter elements and splicing sites are thought that they were likely to influence the expression level of proteins [10].
In this study, we analyzed the microarray data downloaded from Gene Expression Omnibus (GEO) and screened the DEGs between NSCLC and adjacent tissues. We then integrated DEGs results to carry out protein-protein interaction (PPI) network construction. Thereafter, we scanned those SNPs in the significant nodes (hub proteins) in PPI network, and found those functional SNPs may affect hub proteins level. At last, we systematically analyzed the association between these SNPs and NSCLC risk and overall survival.
RESULTS
DEGs analysis
Finally, we got 2295 DEGs in lung squamous cell carcinoma and 967 DEGs in lung adenocarcinoma, after the two groups of DEGs took the intersection, finally we got 488 DEGs (118 up-regulated and 370 down-regulated). Volcano plots for DEGs in lung adenocarcinoma and lung squamous cell carcinoma were shown in Figure 1.
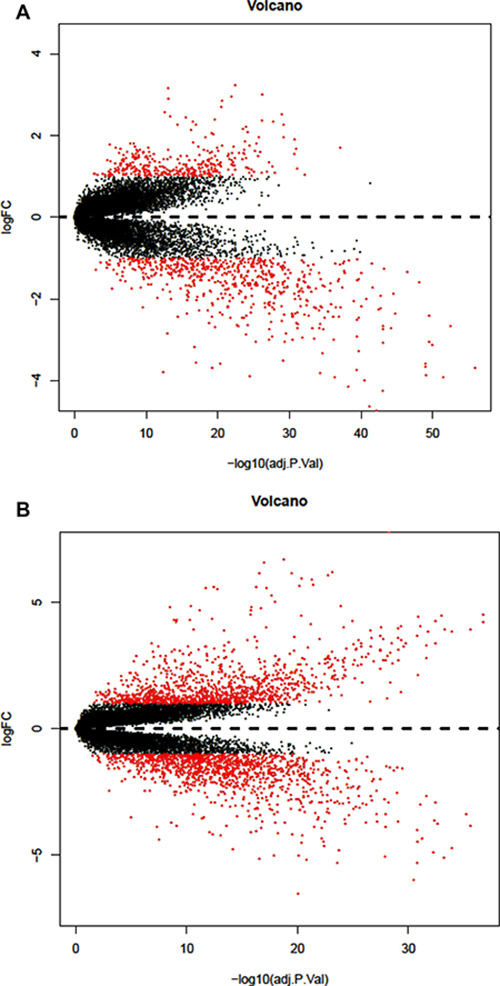
Figure 1: Volcano plot of differentially expressed genes. (A) DEGs of lung adenocarcinoma (B) DEGs of lung squamous cell carcinoma.
PPI network construction and hub genes in the PPI network
In order to further insight about the interaction between DEGs, we used STRING database to construct the PPI network. The PPI network (Figure 2) consisted of 376 nodes interacting by 2418 edges, the remaining 112 DEGs failed to form the PPI pairs. A great number of proteins interacting with others have relatively high degrees, which were considered as hub proteins, which are more likely to play a critical role in the genesis and development of cancer. The hub proteins and the number of their interactions were shown in Figure 3. There are 29 proteins whose degree is greater than 15, FOS (degree = 60) is the protein with the highest degree in the PPI network.
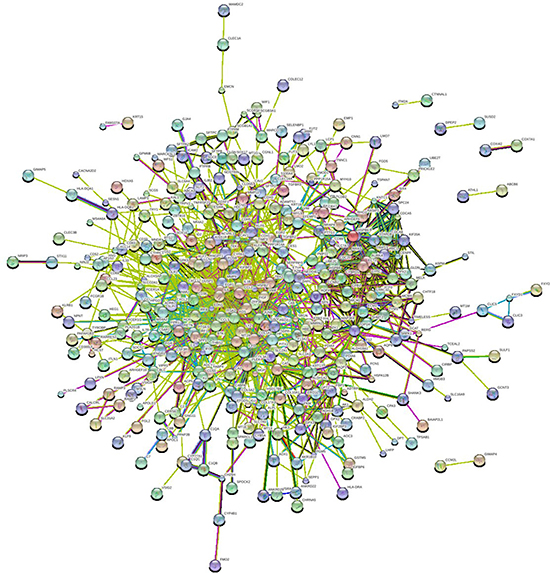
Figure 2: PPI network of differentially expressed genes (DEGs). Each node represents one DEG; edges indicate the interaction relationship.
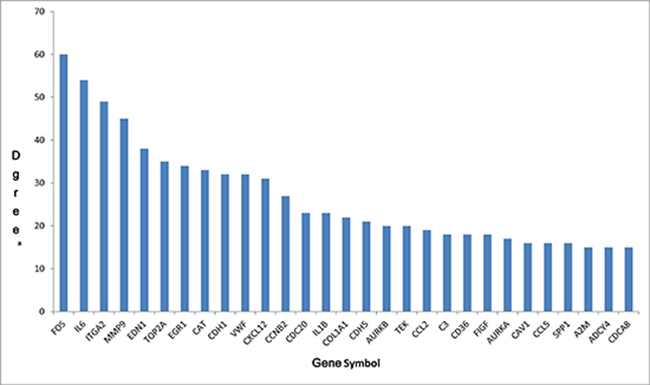
Figure 3: The hub genes in PPI network and their corresponding degree. (A) The number of direct interactions of genes in the PPI network.
Population characteristics
Finally 402 NSCLC patients and 395 cancer-free controls were included in the present study, the basic information of all subjects have been described in Table 1. All subjects were Chinese female non-smokers, and there was no significant difference in age between two groups (p = 0.692). Among cases, there were 322 adenocarcinomas, 66 Squamous cell carcinomas and 14 other tumors with a variety of different pathologies.
Table 1: Characteristics of NSCLC cases and cancer-free controls
Variables |
Cases (%) |
Controls (%) |
P value |
|---|---|---|---|
Females |
402 |
395 |
|
Mean age (years) |
56.45 ± 11.45 |
56.13 ± 11.64 |
0.692 |
Histological |
|||
Adenocarcinoma |
322 (80.1%) |
||
Squamous cell carcinoma |
66 (16.4%) |
||
Othersa |
14 (3.5%) |
a including adenosquamous carcinoma, and large cell lung cancer.
Results of SNPs selection
After database annotation, we selected 8 SNPs in hub genes which may be related to gene expression. The detail of the 8 SNPs is listed in Table 2. Among them, 1 SNPs located in 3′UTR region may fall into miRNA binding site; 2 SNPs located in splicing site; 2 SNPs may be an eQTL; and 3 SNPs were predicted fall intoTFBS.
Table 2: Single nucleotide polymorphism in hub genes
SNP |
Chr location |
Gene |
position |
Major/minor allele |
Function predication |
|---|---|---|---|---|---|
rs4754 |
chr4:88902691 |
SPP1 |
synonymous |
C/T |
Splicing (ESE or ESS)a |
rs959173 |
chr7:116182053 |
CAV1 |
intron |
T/C |
eQTLb + TFBSb |
rs2069837 |
chr7:22768026 |
IL6 |
intron |
A/G |
TFBSabc |
rs2066992 |
chr7:22768248 |
IL6 |
intron |
T/G |
TFBSabc |
rs2239144 |
chr12:6196182 |
VWF |
intron |
G/T |
TFBSbc |
rs7306706 |
chr12:6215633 |
VWF |
intron |
G/A |
eQTLb |
rs3181385 |
chr14:24787587 |
ADCY4 |
3′UTR |
T/C |
miRNA binding sitea |
rs423490 |
chr19:6697405 |
C3 |
synonymous |
G/A |
Splicing (ESE or ESS)a |
Abbreviations: ESE, exonic splicing enhancer; ESS, exonic splicing silencer; eQTL, expression Quantitative Trait Loci; TFBS, transcription factor binding site.
apredict by SNPinfo web server; b predict by Regulome DB database, c predict by HaploReg database.
Genetic polymorphisms and NSCLC risk
Genotype distributions of the 8 SNPs are consistent with HWE in control group (p > 0.05). The distribution of genotypes and allele frequencies between cases and controls were summarized in Table 3. For rs4754, the A allele is a protective allele for NSCLC risk (adjusted OR = 0.762, 95% CI = 0.614–0.946, p = 0.014). Take rs4754-CC genotype as reference, TT genotype showed a relatively low risk of NSCLC (adjusted OR = 0.530, 95% CI = 0.317–0.884, p = 0.015). Compared with homozygous carriers of rs959173-TT genotype, TC genotype and TC + CC dominant model showed a lower risk of NSCLC (adjusted OR = 0.567, 95% CI = 0.347–0.928, p = 0.024; adjusted OR = 0.576, 95% CI = 0.354–0.936, p = 0.026, respectively). For rs2239144 we observed significant differences, the GT and TT genotypes were associated with a 1.508-fold (95%CI=1.105–2.058, p = 0.010) and 2.183-fold (95% CI = 1.450–3.287, p < 0.001) increased risk of NSCLC compared with GG genotype, T allele is a risk allele for NSCLC (adjusted OR = 1.513, 95% CI = 1.237–1.850, p < 0.001).
Table 3: Distribution of genotypes and ORs for NSCLC cases and cancer free controls
SNP |
Genotype |
NSCLC cases (%) N = 402 |
Controls (%) N = 395 |
p of HWE |
Adjusted ORa |
95% CI |
P |
|---|---|---|---|---|---|---|---|
Rs4754 |
CC |
214 (53.2) |
183 (46.3) |
0.464 |
Ref |
||
CT |
160 (39.8) |
167 (42.3) |
0.820 |
0.612, 1.100 |
0.185 |
||
TT |
28 (7.0) |
45 (11.4) |
0.530 |
0.317, 0.884 |
0.015* |
||
Dominant model |
0.759 |
0.574, 1.002 |
0.052 |
||||
Recessive model |
0.583 |
0.356, 0.955 |
0.032* |
||||
Additive model |
T allele |
0.762 |
0.614, 0.946 |
0.014* |
|||
Rs959173 |
TT |
373 (92.8) |
348 (88.1) |
0.686 |
Ref |
||
TC |
28 (7.0) |
46 (11.6) |
0.567 |
0.347, 0.928 |
0.024* |
||
CC |
1 (0.2) |
1 (0.3) |
0.949 |
0.059, 15.327 |
0.971 |
||
Dominant model |
0.576 |
0.354, 0.936 |
0.026* |
||||
Recessive model |
1.019 |
0.063, 16.444 |
0.990 |
||||
Additive model |
C allele |
0.600 |
0.376, 0.957 |
0.032* |
|||
Rs2069837 |
AA |
260 (64.7) |
264 (66.8) |
0.548 |
Ref |
||
AG |
123 (30.6) |
120 (30.4) |
1.039 |
0.766, 1.408 |
0.806 |
||
GG |
19 (4.7) |
11 (2.8) |
1.754 |
0.819, 3.759 |
0.148 |
||
Dominant model |
1.099 |
0.820, 1.473 |
0.527 |
||||
Recessive model |
1.731 |
0.813, 3.688 |
0.155 |
||||
Additive model |
G allele |
1.141 |
0.888, 1.467 |
0.301 |
|||
Rs2066992 |
TT |
185 (46.0) |
201 (50.9) |
0.658 |
Ref |
||
TG |
174 (43.3) |
159 (40.3) |
1.185 |
0.883, 1.590 |
0.257 |
||
GG |
43 (10.7) |
35 (8.9) |
1.342 |
0.823, 2.190 |
0.239 |
||
Dominant model |
1.213 |
0.918, 1.602 |
0.174 |
||||
Recessive model |
1.229 |
0.768, 1.965 |
0.390 |
||||
Additive model |
G allele |
1.169 |
0.944, 1.447 |
0.152 |
|||
Rs2239144 |
GG |
124 (30.8) |
169 (42.8) |
0.270 |
Ref |
||
GT |
190 (47.3) |
171 (43.3) |
1.508 |
1.105, 2.058 |
0.010* |
||
TT |
88 (21.9) |
55 (13.9) |
2.183 |
1.450, 3.287 |
< 0.001* |
||
Dominant model |
1.675 |
1.252, 2.240 |
0.001* |
||||
Recessive model |
1.733 |
1.197, 2.509 |
0.004* |
||||
Additive model |
T allele |
1.513 |
1.237, 1.850 |
< 0.001* |
|||
Rs7306706 |
GG |
168 (41.8) |
154 (39.0) |
0.064 |
Ref |
||
GA |
181 (45.0) |
171 (43.3) |
0.970 |
0.718, 1.313 |
0.845 |
||
AA |
53 (13.2) |
70 (17.7) |
0.695 |
0.457, 1.056 |
0.086 |
||
Dominant model |
0.890 |
0.670, 1.181 |
0.419 |
||||
Recessive model |
0.705 |
0.479, 1.039 |
0.077 |
||||
Additive model |
A allele |
0.855 |
0.698, 1.047 |
0.130 |
|||
Rs3181385 |
TT |
343 (85.3) |
355 (89.9) |
0.074 |
Ref |
||
TC+CC |
59 (14.7) |
40 (10.1) |
1.523 |
0.992, 2.337 |
0.054 |
||
Additive model |
A allele |
1.373 |
0.915, 2.061 |
0.126 |
|||
Rs423490 |
GG |
347 (86.3) |
323 (81.8) |
0.155 |
Ref |
||
GA |
54 (13.4) |
71 (18.0) |
0.708 |
0.482, 1.041 |
0.079 |
||
AA |
1 (0.2) |
1 (0.3) |
0.941 |
0.059, 15.126 |
0.966 |
||
Dominant model |
0.711 |
0.485, 1.043 |
0.081 |
||||
Recessive model |
0.993 |
0.062, 15.939 |
0.996 |
||||
Additive model |
A allele |
0.736 |
0.512, 1.058 |
0.098 |
Then, we performed a stratification analysis by pathological type. As shown in Supplementary Table 1, there were statistical differences between rs2239144, rs3181385, rs4754 and risk of lung adenocarcinoma. As the small sample size of squamous cell carcinoma in the present study, the significant associations on squamous cell carcinoma need to be validated in a large sample size population.
Genetic polymorphisms and overall survival
Of the patients in this study, there were 312 NSCLC patients with prognostic information. The results of the relationship between 8 SNPs and survival time were summarized in Table 4. Patients with rs4754-CC genotype showed a significantly longer survival time compared with those with CT or TT genotypes (25.124 months vs. 21.181 months), as shown in Figure 4. The other 7 SNPs didn’t show any statistically significant correlation with survival time.
Table 4: Distribution of genotypes and survival time of patients
SNP |
Genotype |
NSCLC (%) (n = 312) |
MST (mon) |
Log-rank P |
Adjusted HRa |
95% CI |
|---|---|---|---|---|---|---|
Rs4754 |
CC |
168 (53.8) |
25.124 |
Ref |
||
CT |
121 (38.8) |
20.583 |
0.054 |
1.354 |
1.051,1.743* |
|
TT |
23 (7.4) |
24.172 |
1.037 |
0.638,1.685 |
||
Dominant model |
21.181 |
0.039* |
1.289 |
1.013,1.642* |
||
Recessive model |
23.218 |
0.625 |
0.908 |
0.567,1.454 |
||
Rs959173 |
TT |
289 (92.6) |
22.875 |
Ref |
||
TC+CC |
23 (7.4) |
28.555 |
0.195 |
0.720 |
0.445,1.163 |
|
Rs2069837 |
AA |
203 (65.1) |
23.116 |
Ref |
||
AG |
94 (30.1) |
22.876 |
0.552 |
1.013 |
0.777,1.319 |
|
GG |
15 (4.8) |
28.470 |
0.717 |
0.379,1.357 |
||
Dominant model |
23.627 |
0.811 |
0.968 |
0.751,1.248 |
||
Recessive model |
23.039 |
0.278 |
0.711 |
0.378,1.338 |
||
Rs2066992 |
TT |
142 (45.5) |
23.086 |
Ref |
||
TG |
135 (43.3) |
23.150 |
0.929 |
0.995 |
0.770,1.285 |
|
GG |
35 (11.2) |
24.772 |
0.919 |
0.616,1.372 |
||
Dominant model |
23.468 |
0.886 |
0.977 |
0.767,1.244 |
||
Recessive model |
23.110 |
0.701 |
0.930 |
0.636,1.360 |
||
Rs2239144 |
GG |
97 (31.1) |
21.946 |
Ref |
||
GT |
138 (44.2) |
23.096 |
0.262 |
0.923 |
0.698,1.220 |
|
TT |
77 (24.7) |
25.583 |
0.770 |
0.556,1.068 |
||
Dominant model |
23.972 |
0.255 |
0.860 |
0.666,1.110 |
||
Recessive model |
22.517 |
0.125 |
0.808 |
0.606,1.075 |
||
Rs7306706 |
GG |
134 (42.9) |
23.807 |
Ref |
||
GA |
137 (43.9) |
22.759 |
0.855 |
1.090 |
0.841,1.413 |
|
AA |
41 (13.1) |
23.553 |
1.052 |
0.719,1.539 |
||
Dominant model |
22.926 |
0.592 |
1.074 |
0.842,1.371 |
||
Recessive model |
23.248 |
0.976 |
0.998 |
0.699,1.426 |
||
Rs3181385 |
TT |
267 (85.6) |
23.298 |
Ref |
||
TC+CC |
45 (14.4) |
23.372 |
0.903 |
0.982 |
0.691,1.396 |
|
Rs423490 |
GG |
268 (85.9) |
23.821 |
Ref |
||
GA+AA |
44 (14.1) |
19.818 |
0.197 |
1.250 |
0.889,1.758 |
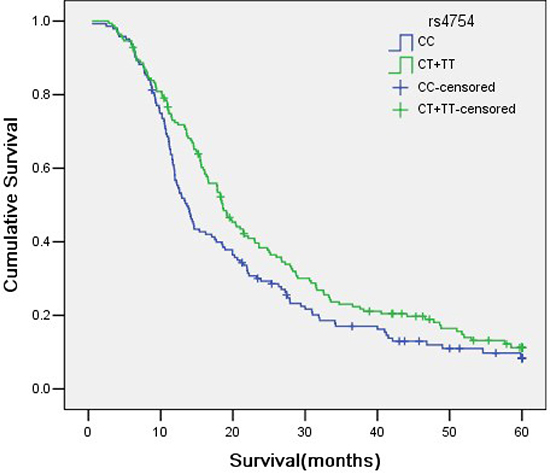
Figure 4: Genotypes of rs4754 SNP site in SPP1 and its association with NSCLC survival time.
DISCUSSION
NSCLC is an aggressive and genomically unstable malignancy. A comprehensive genome-wide gene analysis by using bioinformatics and experimental methods to identify some potentially important genomic alterations is imperative. To begin with, we conducted a systematic study, which identified 488 overlapped DEGs from two microarray datasets (Lung squamous carcinoma and lung adenocarcinoma). Next, some hub proteins with a relatively high degree were confirmed in PPI network, and some SNPs that may affect the expression of hub proteins were identified by SNP annotation databases. Finally, we investigated these SNPs as potential contributor to genetic risk and survival of NSCLC.
The results in our study suggested that there were 29 proteins with a higher degree of connectivity in the PPI network, including FOS, IL6 and MMP9. In our study we found that FOS and IL6 both with down regulation expression and they were the most significant hub proteins with degree of 60 and 54, respectively. In the previous study on FOS and lung cancer, some of the results were contradictory. One study on NSCLC found that c-FOS (a major member of the FOS family) was down regulation expression in malignant tissues compared with normal tissues. Another study found that the patients with higher expression level of c-FOS were corresponding with a shorter survival time [11]. More study should focus on the relationship between FOS and lung cancer to explore the mechanism between FOS and lung cancer. FOS family dimerize with JUN proteins to form AP-1 transcription factor complex, AP-1 could binding to the promoter and enhancer regions of target genes and regulate the transcription of target genes [11]. Previous study found that FOS overexpression can strongly enhance IL-6 to induced STAT3 transactivation, and involved in some cellular processes, including differentiation, proliferation and apoptosis [12]. Matrix metalloproteinases (MMPs) have been confirmed to be involved in the degradation of extracellular matrix components, which affect the physiological remodelling processes [13]. Our results show that MMP9 is relatively high expressed in lung cancer tissues. Previous research found that MMP9 was involved in lung-specific metastasis and was inducted by VEGFR-1 [14]. In lung carcinoma cell line, inactivation of MMP9 can inhibit tumor invasion [15]. Suggest us high expression of MMP9 may be associated with a poor prognosis in lung cancer
DNA genotype can affect gene expression, and gene expression can influence the onset and progression of diseases [16, 17]. Gene expression can be considered as a bridge between genotype and disease. In the human genome, SNP is the most universal genetic variant, which is a single base change at a specific site with the least allele frequency of 1% or greater [18]. SNPs in different gene regions will play different roles in biological processes, such as those non-synonymous SNPs in coding exons, which are considered to change the structure of protein by altering the amino acid sequence and further influence on diseases [19].
Alternative splicing of pre-mRNA is a critical regulatory mechanism for gene expression. Previous studies suggested that approximately 76% of genes produce alternatively spliced products, and about half of the transcript variants are caused by splicing variants [10, 20]. Abnormal splicing can affect mRNA and further influence the protein function. Some SNPs in exonic splice enhancer (ESE) or exonic splice silencer (ESS) have been confirmed to be likely to affect the risk of disease by causing aberrant splicing [21–24]. Secreted phosphoprotein 1 (SPP1) is a kind of important cytokine, which has been proved to play an important role in tumor progression and metastasis by regulating the cell signaling [25]. Rs4754 located at the fifth exon of SPP1 gene, and it was predicted located at ESE or ESS binding sites. Our study found that rs4754 could change the risk and survival of NSCLC. Previously, there were three studies on the relationship between rs4754 and cancer risk. The results of one study on gastric cancer are consistent with our findings that rs4754-C allele is a risk allele for cancer risk [26]. The results of the other two studies on nasopharyngeal carcinoma from a same Chinese population did not reach statistical significance [27, 28].
Transcription factor (TF) is a group of protein which can regulate gene expression and can be regarded as master regulators of gene expression. There are several factors that can affect the function of TF, such as availability of transcription factor binding site (TFBS) [29]. Some SNPs lie within the TFBS have been proved to be able to regulate gene expression by modif TFBS, such as abrogating an existing TFBS, creating a new TFBS or affecting the affinity between TF and TFBS [30–32]. IL-6 was initially thought to play a major role in immune and inflammatory responses, however IL6 abnormalities were found in many types of cancer, and some evidence showed that in cancer IL6 may play its downstream effects through JAK/STAT pathway [33–35]. Rs2069837 were predicted located at TFBS of IL6 gene. There are three articles about the association between rs2069837 and cancer risk, and their results consistently showed that the rs2069837-AA genotype was a protective factor for cervical cancer and hepatocellular carcinoma, one study found that rs2069837 were related to the IL6 expression level in cervical tissues. [36–38]. In our study the results were not statistically significant, further studies with lager sample size are needed to be conducted to explore the inconsistent result.
MiRNAs are short single-stranded noncoding RNAs, which regulate gene expression by post-transcriptionally regulation. MiRNAs through base pairing to the 3'UTR of target mRNAs lead to RNAs silencing [39]. SNPs located at miRNA binding sites can effect the base pairing between miRNA and target mRNA, which further affect miRNA-mediated genes expression. A number of studies have proved that SNPs mapping to miRNA binding sites can affect the expression level of target genes, thus involved in initiation and progression of disease [40–43]. Rs3181385 is a SNP located at miRNA binding site of ADCY4 gene, in the present study there is a bordering significant association with the risk of NSCLC. There was no previous studies that have explored the relationship between rs3181385 and disease. Further studies are needed to verify the result.
eQTL is those SNPs that can regulate gene expression levels, and can be simply defined as the SNPs which were statistically associated with mRNA expression levels [44–46]. In the field of disease risk prediction and precision medicine, eQTL is likely to become a potentially high efficiency and effective biomarker. In our study, CAV1 rs959173 was annotated as eQTL. One previously study found that rs959173-C allele was a protective allele and with a higher CAV1 protein level in systemic sclerosis patients. In our study, rs959173-C allele was a protective allele for NSCLC risk and the expression of CAV1 was down regulated in lung cancer tissue, which suggested us that rs959173 is likely to participate in the onset and development of NSCLC by affecting the expression of CAV1.
Over the last decade, genomewide association studies (GWAS) have identified a large number of disease-related SNPs covering more than 150 distinct diseases with a quite robust p value (p < 5 × 10⁻⁸). These disease-related SNPs, most of which we don’t know how they affect the disease [44, 47]. Here we conducted a joint analysis to find out those SNPs which may affect diseases mediated by gene expression, and further explore the relationship between functional SNP and NSCLC risk and prognosis. Today, a very large amount of multi-omic data was produced along with the rapid development of biological technology. Life science has entered the post-genomic era, and how to effeciently process and integrate these biological information has become the problem that we should pay attention to. In general, our study provides a novel research direction in the field of multi-omic data integration.
MATERIALS AND METHODS
Data preprocessing and identification of DEGs
We systematically searched the GEO database (http://www.ncbi.nlm.nih.gov/geo/) with the following keywords and their combinations: “lung cancer, homo sapiens, expression profiling by array”. Finally, we selected two datasets suitable for our study. We downloaded the gene expression profiles of GSE18842 [48] and GSE32863 [49] from GEO. We included all the 32 lung squamous cell carcinoma samples and 32 adjacent non-tumor lung samples from the GSE18842 dataset. The GSE32863 dataset, we included 58 lung adenocarcinoma and 58 adjacent non-tumor lung tissues.
We downloaded the raw data from the GEO database. Logarithmic transformation (base 2) was performed on the expression value for a global normalization. When multiple probes corresponding to the same gene, average values of these probes were treated as the expression level of the gene. One probe corresponding to more than one gene, this value will be ignored as the nonspecificity.
The limma package [50] in R language was adopted to identify the DEGs between cancer samples and normal sample. Only genes exhibiting with adjusted p < 0.05 and | log2fold change (FC) | > 1.0 were selected as significant DEGs.
PPI network construction
In order to reveal functional associations between proteins in a genome-wide scale, STRING online tool [51, 52] was used to construct a PPI network. In the PPI network, each node represents a protein, and each edge represents an interaction of pairwise proteins. The nodes with a relatively large number of edges were defined as hub proteins. In our study, the proteins with more than 15 edges were defined as hub protein.
Study subjects and follow-up
In the present study, we recruited 402 NSCLC patients and 395 age matched (± 5 years) controls during March 2010 to May 2013 in accordance with the China Medical University Review Board approval. In order to control the impact of smoking, all participants included in our study were Chinese female non-smokers. All of them have signed the informed consent. Patients were recruited from the First Affiliated Hospital of China Medical University and Liaoning Cancer hospital, and controls were recruited from medical examination centers in the same hospital during the same period.
The clinical data was obtained from clinical records. Demographics and environmental exposure information were collected by face-to-face interviews. Each subject was drawn blood of 10 ml. Patients were followed up by telephone every 3 months until April 1st, 2015 to ensure that each patient has sufficient follow-up time. In the present study, death from NSCLC cancer is defined as the outcome event.
SNPs selection and genotyping
Genomic DNA was isolated from blood samples by standard Phenol-chloroform Method. SNPs were genotyped by using the Illumina 660W SNP microarray (Illumina Inc San Diego, CA).
From dbSNP database, we obtained the candidate SNPs of those hub genes. Functional annotation of candidate SNPs were performed by SNPinfo web server [53], HaploReg resource V4.1 [54] and Regulome DB database [55]. We selected some SNPs that may affect gene expression with the following criterions: a. can be capture by Illumina 660 W SNP microarray probes; b. located at transcription factor binding site (TFBS), splicing sites or microRNA (miRNA) binding site; c. probably an expression Quantitative Trait Loci (eQTL); d. the minor allele frequency (MAF) > 0.05 in Chinese Han Beijing (CHB) population. and Followed these standards we finally got 8 SNPs which were investigated in the present study.
Statistical analysis
Hardy-Weinberg’s equilibrium (HWE) in controls was assessed by Pearson chi-squared test. Differences between cases and controls were calculated by t-test (continuous variable) or chi-squared text (categorical variable). The odds ratios (ORs) and their 95% confidence intervals (CIs) were calculated by logistic regression while adjusting for age to assess the relationship between SNP and lung cancer risk. Kaplan-Meier method and log-rank text were performed to evaluate the correlations between overall survival (OS) and genotypes. Hazard ratios (HRs) and their 95% CIs for OS were estimated by Cox proportionally hazards model. All data were analyzed by SPSS 22.0 (IBM, New York, NY, USA). A p < 0.05 was considered statistically significant.
ACKNOWLEDGMENTS
We thank the GEO database for making the data public. Heartfelt thanks to each author’s contribution.
CONFLICTS OF INTERST
The authors declare that there is no potential conflicts of interest.
GRANT SUPPORT
This study was supported by grants No. 81272293 from the National Natural Science Foundation of China.
Authors’ contributions
Conceived and designed the experiment: BZ ZY XF. Performed the experiments: XF LX XQ. Analyzed the data: XF XL. Contributed reagents/materials/analysis tools: BZ ZY YZ. Wrote the paper: XF BZ. Statistical analysis and interpretation: XF ZY.
REFERENCES
1. Miller KD, Siegel RL, Lin CC, Mariotto AB, Kramer JL, Rowland JH, Stein KD, Alteri R, Jemal A. Cancer treatment and survivorship statistics, 2016. CA Cancer J Clin. 2016; 66:271–89. doi: 10.3322/caac.21349.
2. Torre LA, Bray F, Siegel RL, Ferlay J, Lortet-Tieulent J, Jemal A. Global Cancer Statistics, 2012. CA Cancer J Clin. 2015; 65:87–108. doi: 10.3322/caac.21262.
3. Parkin DM, Bray F, Ferlay J, Pisani P. Global cancer statistics, 2002. CA Cancer J Clin. 2005; 55:74–108.
4. Wan Y, Wu W, Yin ZH, Guan P, Zhou BS. MDM2 SNP309, gene-gene interaction, and tumor susceptibility: an updated meta-analysis. Bmc Cancer. 2011; 11. doi: 10.1186/1471-2407-11-208.
5. Landi MT, Chatterjee N, Yu K, Goldin LR, Goldstein AM, Rotunno M, Mirabello L, Jacobs K, Wheeler W, Yeager M, Bergen AW, Li Q, Consonni D, et al. A Genome-wide Association Study of Lung Cancer Identifies a Region of Chromosome 5p15 Associated with Risk for Adenocarcinoma (vol 85, pg 679, 2009). Am J Hum Genet. 2011; 88:861-. doi: 10.1016/j.ajhg.2011.05.003.
6. Lan Q, Hsiung CA, Matsuo K, Hong YC, Seow A, Wang ZM, Hosgood HD, Chen KX, Wang JC, Chatterjee N, Hu W, Wong MP, Zheng W, et al. Genome-wide association analysis identifies new lung cancer susceptibility loci in never-smoking women in Asia. Nat Genet. 2012; 44:1330–5. doi: 10.1038/ng.2456.
7. Ji HB, Ramsey MR, Hayes DN, Fan C, McNamara K, Kozlowski P, Torrice C, Wu MC, Shimamura T, Perera SA, Liang MC, Cai DP, Naumov GN, et al. LKB1 modulates lung cancer differentiation and metastasis. Nature. 2007; 448:807-U7. doi: 10.1038/nature06030.
8. Cancer Genome Atlas Research N. Comprehensive molecular profiling of lung adenocarcinoma. Nature. 2014; 511:543–50. doi: 10.1038/nature13385.
9. Tonon G, Wong KK, Maulik G, Brennan C, Feng B, Zhang YY, Khatry DB, Protopopov A, You MJ, Aguirre AJ, Martin ES, Yang ZH, Ji HB, et al. High-resolution genomic profiles of human lung cancer. P Natl Acad Sci USA. 2005; 102:9625–30. doi: 10.1073/pnas.0504126102.
10. Kwan T, Benovoy D, Dias C, Gurd S, Provencher C, Beaulieu P, Hudson TJ, Sladek R, Majewski J. Genome-wide analysis of transcript isoform variation in humans. Nat Genet. 2008; 40:225–31. doi: 10.1038/ng.2007.57.
11. Milde-Langosch K. The Fos family of transcription factors and their role in tumourigenesis. Eur J Cancer. 2005; 41:2449–61. doi: 10.1016/j.ejca.2005.08.008.
12. Schuringa JJ, Timmer H, Luttickhuizen D, Vellenga E, Kruijer W. c-Jun and c-Fos cooperate with STAT3 in IL-6-induced transactivation of the IL-6 response element (IRE). Cytokine. 2001; 14:78–87. doi: 10.1006/cyto.2001.0856.
13. Murphy G, Nagase H. Progress in matrix metalloproteinase research. Mol Asp Med. 2008; 29:290–308. doi: 10.1016/j.mam.2008.05.002.
14. Hiratsuka S, Nakamura K, Iwai S, Murakami M, Itoh T, Kijima H, Shipley JM, Senior RM, Shibuya M. MMP9 induction by vascular endothelial growth factor receptor-1 is involved in lung-specific metastasis. Cancer Cell. 2002; 2:289–300. doi: 10.1016/S1535-6108(02)00153-8.
15. Jee BK, Park KM, Surendran S, Lee WK, Han CW, Kim YS, Lim Y. KAI1/CD82 suppresses tumor invasion by MMP9 inactivation via TIMP1 up-regulation in the H1299 human lung carcinoma cell line. Biochem Bioph Res Co. 2006; 342:655–61. doi: 10.1016/j.bbrc.2006.01.153.
16. Morley M, Molony CM, Weber TM, Devlin JL, Ewens KG, Spielman RS, Cheung VG. Genetic analysis of genome-wide variation in human gene expression. Nature. 2004; 430:743–7. doi: 10.1038/nature02797.
17. Dermitzakis ET. From gene expression to disease risk. Nat Genet. 2008; 40:492–3. doi: 10.1038/Ng0508-492.
18. Brookes AJ. The essence of SNPs. Gene (Amsterdam). 1999; 234:177–86. doi: 10.1016/S0378-1119(99)00219-X.
19. Yuan HY, Chiou JJ, Tseng WH, Liu CH, Liu CK, Lin YJ, Wang HH, Yao A, Chen YT, Hsu CN. FASTSNP: an always up-to-date and extendable service for SNP function analysis and prioritization. Nucleic Acids Res. 2006; 34:W635–W41. doi: 10.1093/nar/gkl236.
20. Johnson JM, Castle J, Garrett-Engele P, Kan ZY, Loerch PM, Armour CD, Santos R, Schadt EE, Stoughton R, Shoemaker DD. Genome-wide survey of human alternative pre-mRNA splicing with exon junction microarrays. Science. 2003; 302:2141–4. doi: 10.1126/science.1090100.
21. Antoniou AC, Sinilnikova OM, Simard J, Leone M, Dumont M, Neuhausen SL, Struewing JP, Stoppa-Lyonnet D, Barjhoux L, Hughes DJ, Coupier I, Belotti M, Lasset C, et al. RAD51 135G -> C modifies breast cancer risk among BRCA2 mutation carriers: Results from a combined analysis of 19 studies. Am J Hum Genet. 2007; 81:1186–200. doi: 10.1086/522611.
22. Onouchi Y, Gunji T, Burns JC, Shimizu C, Newburger JW, Yashiro M, Nakamura Y, Yanagawa H, Wakui K, Fukushima Y, Kishi F, Hamamoto K, Terai M, et al. ITPKC functional polymorphism associated with Kawasaki disease susceptibility and formation of coronary artery aneurysms. Nat Genet. 2008; 40:35–42. doi: 10.1038/ng.2007.59.
23. Uezato A, Yamamoto N, Iwayama Y, Hiraoka S, Hiraaki E, Umino A, Haramo E, Umino M, Yoshikawa T, Nishikawa T. Reduced cortical expression of a newly identified splicing variant of the DLG1 gene in patients with early-onset schizophrenia. Transl Psychiat. 2015; 5. doi: 10.1038/tp.2015.154.
24. Zhang YW, Lan Q, Rothman N, Zhu Y, Zahm SH, Wang SS, Holford TR, Leaderer B, Boyle P, Zhang B, Zou KY, Chanock S, Zheng TZ. A putative exonic splicing polymorphism in the BCL6 gene and the risk of non-Hodgkin lymphoma. J Natl Cancer I. 2005; 97:1616–8. doi: 10.1093/jnci/dji344.
25. Rangaswami H, Bulbule A, Kundu GC. Osteopontin: role in cell signaling and cancer progression. Trends Cell Biol. 2006; 16:79–87. doi: 10.1016/j.tcb.2005.12.005.
26. Qiu Y, Hu Y, Zhang ZY, Ye L, Xu FH, Schneider ME, Ma XL, Du YX, Zuo XB, Zhou FS, Chen G, Xie XS, Zhang Y, et al. Genetic association of osteopontin (OPN) and its receptor CD44 genes with susceptibility to Chinese gastric cancer patients. J Cancer Res Clin. 2014; 140:2143–56. doi: 10.1007/s00432-014-1761-9.
27. Wang JL, Nong LG, Tang YJ, Wei YS, Yang FL, Wang CF. Correlation between OPN gene polymorphisms and the risk of nasopharyngeal carcinoma. Med Oncol. 2014; 31. doi: 10.1007/s12032-014-0020-x.
28. Wang JL, Nong LG, Wei YS, Qin SY, Zhou Y, Tang YJ. Association of osteopontin polymorphisms with nasopharyngeal carcinoma risk. Hum Immunol. 2014; 75:76–80. doi: 10.1016/j.humimm.2013.09.014.
29. Herdegen T, Leah JD. Inducible and constitutive transcription factors in the mammalian nervous system: control of gene expression by Jun, Fos and Krox, and CREB/ATF proteins. Brain Res Rev. 1998; 28:370–490. doi: 10.1016/S0165-0173(98)00018-6.
30. Su JJ, Su JG, Shang XY, Wan QY, Chen XH, Rao YL. SNP detection of TLR8 gene, association study with susceptibility/resistance to GCRV and regulation on mRNA expression in grass carp, Ctenopharyngodon idella. Fish Shellfish Immun. 2015; 43:1–12. doi: 10.1016/j.fsi.2014.12.005.
31. Yee SW, Shima JE, Hesselson S, Nguyen L, De Val S, LaFond RJ, Kawamoto M, Johns SJ, Stryke D, Kwok PY, Ferrin TE, Black BL, Gurwitz D, et al. Identification and Characterization of Proximal Promoter Polymorphisms in the Human Concentrative Nucleoside Transporter 2 (SLC28A2). J Pharmacol Exp Ther. 2009; 328:699–707. doi: 10.1124/jpet.108.147207.
32. Hedrich WD, Hassan HE, Wang H. Insights into CYP2B6-mediated drug-drug interactions. Acta pharmaceutica Sinica B. 2016; 6:413–25. doi: 10.1016/j.apsb.2016.07.016.
33. Chevez ARD, Finke J, Bukowski R. The Role of Inflammation in Kidney Cancer. Adv Exp Med Biol. 2014; 816:197–234. doi: 10.1007/978-3-0348-0837-8_9.
34. Zimmers TA, Fishel ML, Bonetto A. STAT3 in the systemic inflammation of cancer cachexia. Semin Cell Dev Biol. 2016; 54:28–41. doi: 10.1016/j.semcdb.2016.02.009.
35. Hong DS, Angelo LS, Kurzrock R. Interleukin-6 and its receptor in cancer-Implications for translational therapeutics. Cancer. 2007; 110:1911–28. doi: 10.1002/cncr.22999.
36. Zheng XH, Han CP, Shan R, Zhang HT, Zheng ZM, Liu YS, Wang AG. Association of interleukin-6 polymorphisms with susceptibility to hepatocellular carcinoma. Int J Clin Exp Med. 2015; 8:6252–6. doi:
37. Shi TY, Zhu ML, He J, Wang MY, Li QX, Zhou XY, Sun MH, Shao ZM, Yu KD, Cheng X, Wu XH, Wei QY. Polymorphisms of the Interleukin 6 gene contribute to cervical cancer susceptibility in Eastern Chinese women. Hum Genet. 2013; 132:301–12. doi: 10.1007/s00439-012-1245-4.
38. Pu X, Gu Z, Wang X. Polymorphisms of the interleukin 6 gene and additional gene-gene interaction contribute to cervical cancer susceptibility in Eastern Chinese women. Archives of gynecology and obstetrics. 2016; 294:1305–10. doi: 10.1007/s00404-016-4175-x.
39. Bartel DP. MicroRNAs: Target Recognition and Regulatory Functions. Cell. 2009; 136:215–33. doi: 10.1016/j.cell.2009.01.002.
40. Cipolla GA, Park JK, de Oliveira LA, Lobo-Alves SC, de Almeida RC, Farias TDJ, Lemos DD, Malheiros D, Lavker RM, Petzl-Erler ML. A 3 ' UTR polymorphism marks differential KLRG1 mRNA levels through disruption of a miR-584-5p binding site and associates with pemphigus foliaceus susceptibility. Bba-Gene Regul Mech. 2016; 1859:1306–13. doi: 10.1016/j.bbagrm.2016.07.006.
41. Wang CJ, Zhao YF, Ming YM, Zhao SN, Guo ZJ. A polymorphism at the microRNA binding site in the 3-untranslated region of C14orf101 is associated with the risk of gastric cancer development. Exp Ther Med. 2016; 12:1867–72. doi: 10.3892/etm.2016.3521.
42. Wang XJ, Li W, Ma LK, Gao JS, Liu JT, Ping F, Nie M. Association study of the miRNA-binding site polymorphisms of CDKN2A/B genes with gestational diabetes mellitus susceptibility. Acta Diabetol. 2015; 52:951–8. doi: 10.1007/s00592-015-0768-2.
43. Gu SS, Rong H, Zhang GW, Kang LH, Yang M, Guan HJ. Functional SNP in 3-UTR MicroRNA-Binding Site of ZNF350 Confers Risk for Age-Related Cataract. Hum Mutat. 2016; 37:1223–30. doi: 10.1002/humu.23073.
44. Huang YT, VanderWeele TJ, Lin XH. Joint Analysis of Snp and Gene Expression Data in Genetic Association Studies of Complex Diseases. Ann Appl Stat. 2014; 8:352–76. doi: 10.1214/13-AOAS690.
45. Gilad Y, Rifkin SA, Pritchard JK. Revealing the architecture of gene regulation: the promise of eQTL studies. Trends in genetics. 2008; 24:408–15. doi: 10.1016/j.tig.2008.06.001.
46. Li L, Zhang X, Zhao H. eQTL. Methods in molecular biology (Clifton, NJ). 2012; 871:265–79. doi: 10.1007/978-1-61779-785-9_14.
47. Kim S, Misra A. SNP genotyping: Technologies and biomedical applications. Annu Rev Biomed Eng. 2007; 9:289–320. doi: 10.1146/annurev.bioeng.9.060906.152037.
48. Sanchez-Palencia A, Gomez-Morales M, Gomez-Capilla JA, Pedraza V, Boyero L, Rosell R, Farez-Vidal ME. Gene expression profiling reveals novel biomarkers in nonsmall cell lung cancer. Int J Cancer. 2011; 129:355–64. doi: 10.1002/ijc.25704.
49. Selamat SA, Chung BS, Girard L, Zhang W, Zhang Y, Campan M, Siegmund KD, Koss MN, Hagen JA, Lam WL, Lam S, Gazdar AF, Laird-Offringa IA. Genome-scale analysis of DNA methylation in lung adenocarcinoma and integration with mRNA expression. Genome Res. 2012; 22:1197–211. doi: 10.1101/gr.132662.111.
50. Smyth GK. Limma: Linear models for microarray data. Statistics for Biology and Health. 2005; 397–420.
51. von Mering C, Huynen M, Jaeggi D, Schmidt S, Bork P, Snel B. STRING: a database of predicted functional associations between proteins. Nucleic Acids Res. 2003; 31:258–61. doi: 10.1093/nar/gkg034.
52. Szklarczyk D, Franceschini A, Kuhn M, Simonovic M, Roth A, Minguez P, Doerks T, Stark M, Muller J, Bork P, Jensen LJ, von Mering C. The STRING database in 2011: functional interaction networks of proteins, globally integrated and scored. Nucleic Acids Res. 2011; 39:D561-D8. doi: 10.1093/nar/gkq973.
53. Xu ZL, Taylor JA. SNPinfo: integrating GWAS and candidate gene information into functional SNP selection for genetic association studies. Nucleic Acids Res. 2009; 37:W600–W5. doi: 10.1093/nar/gkp290.
54. Ward LD, Kellis M. HaploReg: a resource for exploring chromatin states, conservation, and regulatory motif alterations within sets of genetically linked variants. Nucleic Acids Res. 2012; 40:D930–D4. doi: 10.1093/nar/gkr917.
55. Boyle AP, Hong EL, Hariharan M, Cheng Y, Schaub MA, Kasowski M, Karczewski KJ, Park J, Hitz BC, Weng S, Cherry JM, Snyder M. Annotation of functional variation in personal genomes using RegulomeDB. Genome Res. 2012; 22:1790–7. doi: 10.1101/gr.137323.112.