
INTRODUCTION
Liposarcoma (LPS) is the most common sarcoma of adults, accounting for 15%–25% of all soft tissue sarcomas (STSs). According to its clinicopathological and molecular genetic characteristics, LPS can be subdivided into three categories: well-differentiated/dedifferentiated, myxoid/round cell, and pleomorphic. Of these categories well-differentiated/dedifferentiated LPS (WDLPS/DDLPS) occurs most frequently (48–58% of all LPS) [1–3]. Surgical excision remains the standard of care for localized WDLPS/DDLPS, as these tumors are largely resistant to conventional cytotoxic chemotherapy. WDLPS is a locally aggressive neoplasm, classified as an intermediate malignancy virtually incapable of systemic spread. While lesions located in surgically amenable soft tissue do not recur after complete excision with a clear margin, tumors occurring in deep anatomical sites, such as retroperitoneum, tend to cause death as a result of uncontrolled local recurrence or dedifferentiation and subsequent metastasis. Overall, mortality rates range from 0% for WDLPS of the extremities to > 80% for WDLPS of the retroperitoneum after long term follow-up [1, 2, 4]. DDLPS is traditionally defined as a high-grade non-lipogenic sarcoma with a juxtaposed WDLPS area, and most commonly occurs in the retroperitoneum. Local recurrence is observed in ≥ 40% of all cases and in almost 100% of cases with retroperitoneal location. Distant metastases are observed in 15%–20% of cases and they are associated with considerably worse prognosis, with an overall mortality rate of 28%–56% at 5 year follow-up [1, 2, 4].
WDLPS and DDLPS exhibit similar cytogenetic features, characterized by giant marker and ring chromosomes containing amplified sequences of the 12q13–15 region, in which the MDM2 (12q15) and CDK4 (12q13–14) genes are amplified in 95%–97% and 85%–92% of cases, respectively [5, 6]. Amplifications of MDM2 and CDK4 cause their overexpression. MDM2 protein binds to p53 protein and stimulates p53 degradation; hence MDM2 overexpression decreases apoptosis. CDK4 phosphorylates RB1 and prevents its interaction with the E2F transcription factor; hence CDK4 overexpression allows the cell cycle to escape the G1–S checkpoint. Generally, DDLPS displays more extensive chromosomal abnormalities than WDLPS. The 12q13–15 amplifications in DDLPS are more complex than those in WDLPS. In addition, amplifications of other loci, including 1q23, 12q24, and either 6q23 or 1p32, are observed in approximately two-thirds of DDLPS cases. The MAP3K5 gene in the 6q23 amplified region inhibits lipogenic differentiation through the JUN or PPARG-dependent pathways [7, 8].
In 2012, pazopanib was approved as the first molecular target drug for advanced STS on the basis of the results of the PALETTE study [9]; however, it did not demonstrate sufficient benefit in patients with LPS [10, 11]. Recently, small-molecule inhibitors of MDM2 and CDK4 (for example, RG 7112, flavopiridol, and PD0332991) have been developed and have shown promising results for the treatment of WDLPS/DDLPS in small-scale phase I and II clinical studies [12–16]. However, these drugs do not appear to be sufficiently effective as single agents on unresectable WDLPS and DDLPS; therefore, novel therapeutic targets are urgently needed for WDLPS/DDLPS.
Next-generation sequencing (NGS)-based genomic profiling of tumor tissues has contributed widely to the discovery of new therapeutic targets in many types of cancers [17, 18]. In addition, NGS-based targeted sequencing with small cancer-related gene panels has been used as clinical genomic testing for the selection of suitable molecular targeted therapies [19, 20]. The targeted sequencing of cancer-related genes enables rapid, highly sensitive, and cost-effective detection of actionable genetic alterations present in each tumor, including copy-number alterations; hence it is also an effective method for discovery of new therapeutic targets.
There are few reports of large-scale genomic profiling of WDLPS and DDLPS [21, 22]. Here, we performed targeted sequencing analysis of a relatively large cohort of 19 WDLPS and 37 DDLPS cases, using a panel of 104 cancer-related genes (NCC oncopanel v3), which was developed for genomic testing to select suitable molecular targeted therapies (Supplementary Table 1). We found that receptor tyrosine kinase (RTK) genes were amplified in approximately one-third of WDLPS/DDLPS samples and obtained data suggesting that inhibition of specific RTKs may become an effective therapeutic option for patients with tumors in which their genes are amplified.
RESULTS
WDLPS/DDLPS is characterized by few gene mutations and highly frequent gene amplifications
We analyzed 19 WDLPS and 37 DDLPS tumor tissue samples (Table 1) by targeted sequencing of 104 genes (Supplementary Table 1). All samples were histologically re-examined and their diagnoses were confirmed. Among them, one WDLPS (WDLPS_20T) and one DDLPS (DDLPS_6T) sample were derived from the primary and recurrent tumors, respectively, of the same patient. In this analysis, we did not examine paired normal control samples from the same patients. Instead, we obtained probable somatic mutations, by removing common single nucleotide polymorphisms (SNPs) registered in public and originally developed genomic sequence databases (see Materials and Methods). From this analysis, we identified a mean of 1.12 (1.05 in WDLPS and 1.16 in DDLPS) potential mutations (single nucleotide variations and short insertions and deletions) per patient after SNP elimination (Supplementary Table 2). When COSMIC database [23] registered mutations and truncating mutations were selected as those likely to be functionally important (potential driver mutations), the mean number of mutations decreased to 0.11 (0.05 in WDLPS and 0.14 in DDLPS) per patient (Figure 1 and Supplementary Table 2). These mutations occurred in the TP53, KIT, FGFR1, ARID1A, CHEK2, and ROCK1 genes; no recurrently mutated genes were identified. By contrast, gene amplifications were frequently observed (Figure 1 and Supplementary Table 3). As expected, MDM2 and CDK4 were amplified in the majority of tumors; MDM2 was amplified in 55 of 56 (98%) samples (19 of 19 WDLPSs and 36 of 37 DDLPSs), while CDK4 was amplified in 50 (89%) samples (14 WDLPSs and 36 DDLPSs). Interestingly, the MDM2 amplification-negative DDLPS sample had a TP53 missense mutation (Figure 1). In addition to the MDM2 and CDK4 genes, a mean of 0.79 genes (0.55 in WDLPS and 0.92 in DDLPS) were amplified per patient. The mean frequencies of potential driver mutations and amplifications were slightly higher in DDLPS (0.14 and 2.9 per patient, respectively) than in WDLPS (0.05 and 2.4 per patient, respectively).
Table 1: Clinical characteristics of WDLPS/DDLPS patients analyzed in this study
Total (N = 56) |
WDLPS (N = 19) |
DDLPS (N = 37) |
|
|---|---|---|---|
Age (years) |
|||
Median (range) |
60 (30–81) |
60 (30–81) |
60 (38–81) |
Sex |
|||
Male |
42 |
12 |
30 |
Female |
14 |
7 |
7 |
Tumor site |
|||
Retroperitoneal |
33 |
4 |
29 |
Other trunk |
6 |
3 |
3 |
Extremity |
17 |
12 |
5 |
Tumor size (cm) |
|||
Median (range) |
14.0 (3.0–38.0) |
17.0 (6.5–38.0) |
13.0 (3.0–31.0) |
M0/M1 |
|||
M0 |
53 |
19 |
34 |
M1 |
3 |
0 |
3 |
TNM stage |
|||
IA/IB |
19 |
19 |
0 |
IIA/IIB |
3 |
0 |
3 |
III |
31 |
0 |
31 |
IV |
3 |
0 |
3 |
Treatment |
|||
Surgery only |
45 |
19 |
26 |
Surgery + chemotherapy |
3 |
0 |
3 |
Surgery + RT |
3 |
0 |
3 |
PBT or CIRT only |
2 |
0 |
2 |
Palliative therapy |
3 |
0 |
3 |
Local recurrence |
|||
No |
30 |
18 |
12 |
Yes |
26 |
1 |
25 |
Distant metastasis |
|||
No |
46 |
19 |
27 |
Yes |
10 |
0 |
10 |
Recurrence |
|||
No |
29 |
18 |
11 |
Yes |
27 |
1 |
26 |
Follow-up (months) |
|||
Median (range) |
42 (3–170) |
29 (9–129) |
62 (3–170) |
Oncological outcome |
|||
No evidence of disease |
30 |
18 |
12 |
Alive with disease |
16 |
1 |
15 |
Dead of disease |
9 |
0 |
9 |
Dead of other cause |
1 |
0 |
1 |
RT, radiation therapy; PBT, proton beam therapy; CIRT, carbon ion radiation therapy.
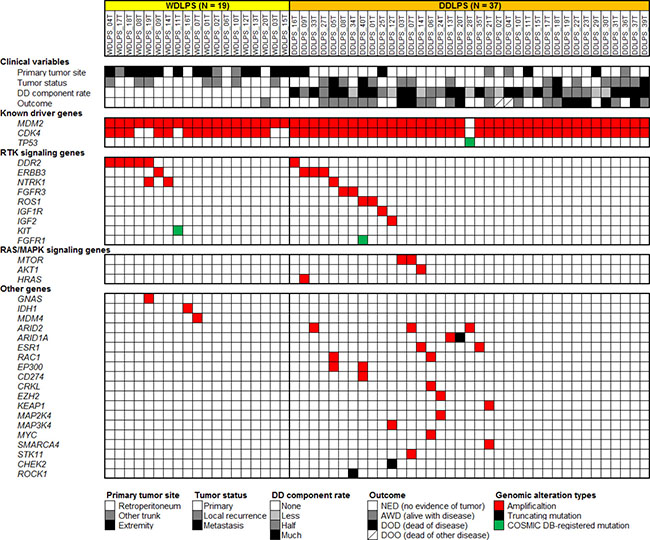
Figure 1: Summary of genetic alterations identified in 19 WDLPS and 37 DDLPS samples by targeted sequencing analysis using a panel of 104 cancer-related genes. Each column represents a patient sample. The top section indicates clinical variables of each patient. The following three sections indicate genetic alterations found in each sample.
Frequent amplification of RTK genes in WDLPS/DDLPS
Other than the MDM2 and CDK4 genes, the most remarkable category of amplified genes were those encoding RTKs, which were amplified in 18 of 56 (32%) samples (7 of 19 WDLPSs and 11 of 37 DDLPSs) (Figure 1). DDR2 (1q23) was amplified in six (11%) samples (five WDLPSs and one DDLPS), ERBB3 (12q13) in four (7%) samples (one WDLPS and three DDLPSs), NTRK1 (1q23) in three (5%) samples (two WDLPSs and one DDLPS), FGFR3 (4p16) and ROS1 (6q22) in two (4%) samples (two DDLPSs), and IGF1R (15q26) in one DDLPS sample (2%). In addition to these RTK genes, IGF2, which encodes a ligand of the IGF1R and IGF2R receptors, was also amplified in one DDLPS sample (2%). Moreover, COSMIC database-registered mutations of FGFR1 and KIT were also identified among our samples (Figure 1). These observations suggest that the activation of RTKs and their downstream signaling pathways plays an important role in WDLPS/DDLPS tumor development. Regarding other genetic aberrations, amplifications of ARID2 (12p12), MTOR (1p36), ESR1 (6q25), RAC1 (7p22), and EP300 (22q13) were recurrently observed (Figure 1).
Next, we performed quantitative PCR analysis to validate the amplification of RTK genes. We examined the five recurrently amplified RTK genes, DDR2, ERBB3, NTRK1, FGFR3, and ROS1, and all amplifications were confirmed (Figure 2A). While the quantitative PCR-estimated relative copy numbers were slightly lower than those estimated by NGS for two samples (WDLPS_04T and DDLS_09T), for the majority of samples they were higher (Figure 2A). The underestimation observed using NGS analysis was probably attributable to the relatively inefficient capture of highly amplified sequences with the limited amount of bait oligonucleotides used for the target enrichment process.
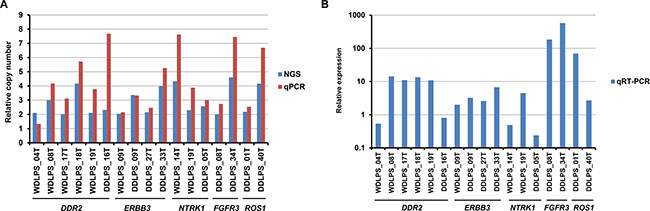
Figure 2: Quantitative PCR and RT-PCR analyses of recurrently amplified RTK genes. (A) Comparison of NGS-estimated and quantitative PCR (qPCR)-estimated relative copy numbers of amplified RTK genes. (B) mRNA expression of amplified RTK genes estimated by quantitative RT-PCR (qRT-PCR), and normalized to GAPDH expression. Relative expression levels are expressed as ratios of the median expression in non-amplified samples.
We also examined the mRNA expression of the recurrently amplified RTK genes. Quantitative RT-PCR analysis revealed that the amplified genes were overexpressed in 13 of 17 (76%) samples (Figure 2B), compared with the expression in non-amplified samples, and seven samples exhibited > 10-fold overexpression.
Then, we examined the clinical features of DDLPS patients with RTK gene amplification. Comparisons between the patients with RTK gene amplification (N = 11) and those without (N = 26) revealed no significant difference in any investigated clinical parameters, including patient age (P = 0.800), sex (P = 0.078), tumor status at presentation (P = 0.228), primary tumor site (P = 0.172), tumor size (P = 0.299), distant metastasis at presentation (M0/M1) (P = 0.240), TNM stage [24] (P = 0.220) (Supplementary Table 4), and disease-free survival (P = 0.402) (Supplementary Figure 1).
Heterogeneity of RTK gene amplification
There are some differences in amplified loci between WDLPS and DDLPS. In our cohort, one DDLPS (DDLPS_06T) had developed as a local recurrent tumor from WDLPS (WDLPS_20T) 10 years after primary tumor resection. This case acquired additional amplification of the RAC1, CRKL, and MYC genes during the dedifferentiation process (Figure 1). In addition, we observed that gene amplifications were more extensive in DDLPS than in WDLPS samples (Figure 1).
DDLPS tumors exhibit histological heterogeneity, consisting of both well-differentiated (WD) and dedifferentiated (DD) components. To examine intratumoral spatial heterogeneity and further validate the RTK gene amplifications at the cell level, we performed fluorescence in situ hybridization (FISH) analysis of the DDR2, ERBB3, NTRK1, FGFR3, and ROS1 genes in tumors in which they were amplified (seven WDLPSs and nine DDLPSs). The RTK gene amplifications in these 16 samples were repeatedly confirmed by FISH analysis (Table 2). The majority of cases had various degrees of intratumoral heterogeneity of RTK gene amplification (for example, see Figure 3A and 3B). In DDLPSs, RTK gene amplifications were generally enhanced in DD areas, compared with WD areas (Figure 3C and 3D and Table 2). These observations suggest that RTK gene amplifications are also involved in the progression from WD tumors to DD tumors.
Table 2: FISH analysis of recurrently amplified RTK genes
Gene |
Sample |
Amplification |
|
|---|---|---|---|
DD area |
WD area |
||
DDR2 |
WDLPS_04T |
NA |
+ |
WDLPS_08T |
NA |
++ |
|
WDLPS_17T |
NA |
++ |
|
WDLPS_18T |
NA |
++ |
|
WDLPS_19T |
NA |
++ |
|
DDLPS_16T |
++ |
++ |
|
ERBB3 |
WDLPS_09T |
NA |
+ |
DDLPS_09T |
++ |
++ |
|
DDLPS_27T |
++ |
+ |
|
DDLPS_33T |
++ |
NS |
|
NTRK1 |
WDLPS_14T |
NA |
++ |
WDLPS_19T |
NA |
++ |
|
DDLPS_05T |
++ |
NS |
|
FGFR3 |
DDLPS_08T |
++ |
NS |
DDLPS_34T |
++ |
NE |
|
ROS1 |
DDLPS_01T |
++ |
+ |
DDLPS_40T |
++ |
– |
|
DD, dedifferentiated; WD, well differentiated; NA, not associated; NS, no sample, NE, not evaluable; “++”, positive in many tumor cells; “+”, positive in a small subset of tumor cells; “–”, negative.
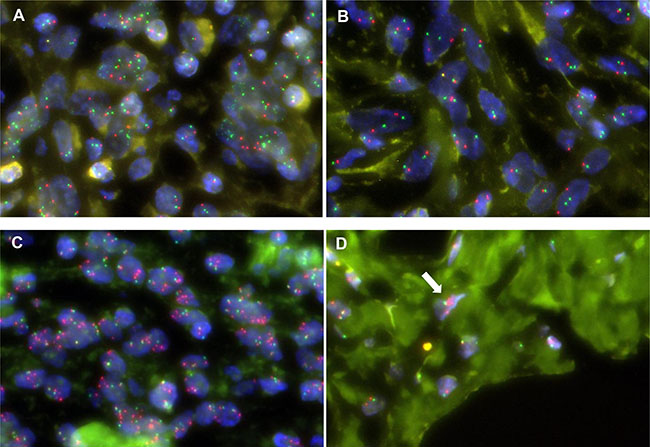
Figure 3: Intratumoral heterogeneity of RTK gene amplification in FISH. Multiple FGFR3 signals (green) are observed in the majority of cells in a certain area (A) but not in any cells in another area (B) of the DD component of DDLPS_08T. Multiple ERBB3 signals (red) are observed in the majority of cells in the DD component (A) and only a few cells in the WD component (B) of DDLPS_27T.
To examine the heterogeneity of protein expression, we also performed immunohistochemistry analysis for the four proteins encoded by the RTK genes, ERBB3, NTRK1, FGFR3, and ROS1, in the 11 samples in which they were amplified. Unexpectedly, the majority of tumors produced negative staining results for these proteins, and only one DDLPS sample (DDLPS_08T) was very sparsely FGFR3-positive. In this sample, the cytoplasm of < 1% of tumor cells in the DD component was stained (Supplementary Figure 2). These results suggest that amplified RTK genes may only be expressed at the protein level in a limited population of tumor cells.
Targetability of RTK gene amplification
Certain RTK gene alterations, such as ERBB2 amplifications in breast cancer and EGFR mutations in lung cancer, are excellent therapeutic targets and used in clinical practice. To examine whether or not the RTK gene amplifications in WDLPS/DDLPS are therapeutically targetable alterations, we searched for WDLPS/DDLPS cell lines with RTK gene amplifications and found that a WDLPS cell line, 93T449, exhibited IGF1R amplification (Figure 4A) and overexpression (Figure 4B). Therefore, we performed growth inhibition assays using this cell line. This cell line was only slightly sensitive to the IGF1R inhibitor, NVP-AEW541, and the CDK4/6 inhibitor, Palbociclib (Supplementary Figure 3). Next, we tested a combination of these CDK4/6 and IGF1R inhibitors. Although single drug treatment with the CDK4/6 inhibitor (maximum concentration 10 μM) did not achieve 50% inhibition of 93T449 cell growth (Supplementary Figure 3), combined treatment synergistically reduced cell viability in a dose-dependent manner (Figure 4C). In IGF1R inhibitor-treated 93T449 cells, phosphorylation of IGF1R was decreased (Figure 4E). This synergistic effect using a combination of CDK4/6 and IGF1R inhibitors was not observed in the control unclassified liposarcoma cell line, SW872 (Figure 4D).
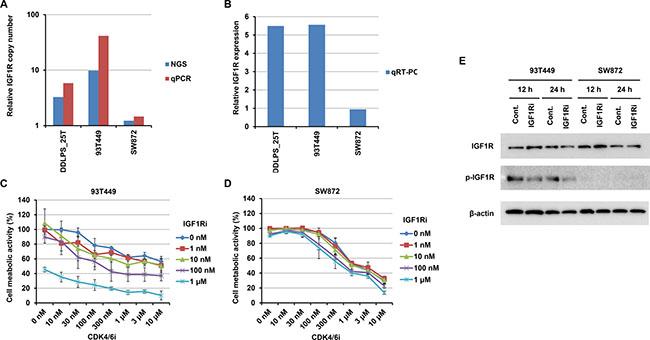
Figure 4: Effects on 93T449 and SW872 cells of combined treatment with CDK4 and IGF1R inhibitors. (A and B) IGF1R amplification and expression in 93T449 and SW872 cells, as well as an IGF1R-amplified tumor (DDLPS_25T). Relative copy number was estimated by NGS and quantitative PCR (qPCR) (A). mRNA expression was estimated by quantitative RT-PCR (qRT-PCR) and normalized to GAPDH expression (B). Relative expression levels are expressed as ratios of the median expression in non-amplified tumor samples, as in Figure 2B. (C and D) Growth inhibitory effects of CDK4 and IGF1R inhibitors on 93T449 (C) and SW872 (D) cells. Palbociclib (CDK4 inhibitor) and NVP-AEW541 (IGF1R inhibitor) were added at various concentrations, and cell metabolic activities were assayed after 6 days of culture. In this assay, synergism of these inhibitors was evaluated using CompuSyn (http://www.combosyn.com) [41]. Their effects were synergistic in 93T449 cells (average combination index score = 0.42 ± 0.19), but not in SW872 cells (average combination index score = 6.28 ± 3.22). (E) Effect of IGF1R inhibitor on IGF1R phosphorylation in 93T449 and SW872 cells. Cells were treated with NVP-AEW541 (1 μM) for 12 or 24 h and harvested. Expression and Y1135 phosphorylation of IGF1R were evaluated by western blotting analysis.
DISCUSSION
In this study, we analyzed 19 WDLPS and 37 DDLPS tumor tissue samples by targeted genomic sequencing to identify targetable genetic alterations. Our results demonstrate that WDLPS/DDLPS harbored very few mutations and had a relatively high frequency of amplifications including of RTK genes. RTK gene amplifications were found in 18 of 56 (32%) samples, and DDR2, ERBB3, NTRK1, FGFR3, and ROS1 were recurrently amplified.
Two large-scale genomic analyses of LPS tumors have previously been reported; however, they did not clearly describe the amplification of RTK genes in WDLPS/DDLPSs [21, 22]. Only one previous study has reported the identification of DDR2 amplification as a novel therapeutic target by whole genome sequencing analysis of a single WDLPS tumor [25]. Therefore, to confirm our findings and estimate the prevalence of RTK gene amplification, we used cBioPortal for Cancer Genomics (http://cbioportal.org) [26, 27] to analyze data from two publically available sarcoma genome datasets: the dataset of the Memorial Sloan Kettering Cancer Center [21] and The Cancer Genome Atlas (http://cancergenome.nih.gov). Amplifications of the 20 RTK genes included in our gene panel were observed in 19 of 50 (38%) DDLPSs in the former dataset. Recurrently amplified RTK genes were DDR2, NTRK1, ROS1, ERBB3, IGF1R, KIT, and PDGFRA (Supplementary Figure 4A). In the latter dataset, the 20 RTK genes were amplified in 28 of 58 (48%) DDLPSs, with ROS1, DDR2, ERBB3, FGFR4, IGF1R, NTRK1, FGFR1, FGFR3, PDGFRB, and RET recurrently amplified (Supplementary Figure 4B). In addition, when 38 RTK genes not included in our panel were examined, we identified amplifications of ROR1, INSR, AATK, INSRR, NTRK2, and FLT4 (Supplementary Figure 5). These similar observations in the three independent cohorts and the identification of additional RTK gene amplifications emphasize the functional importance of RTK gene amplification in WDLPS/DDLPS tumorigenesis.
Intratumoral heterogeneity can lead to underestimation of genomic alterations in the analysis of single tumor samples, and this can present major challenges to the development of personalized cancer medicine [28]. Therefore, we performed FISH analysis of the RTK gene amplifications identified by genome sequencing and found that their amplification exhibited varying degrees of intratumoral heterogeneity. In DDLPS tumors in particular, RTK gene amplification in DD areas was generally more extensive than that in WD areas. This result suggests that amplification of these RTK genes is also involved in tumor progression. If targeted therapy with inhibitors of these amplified RTK genes is effective, it is expected to be more beneficial in treating the more malignant DD areas than the WD areas.
Several agents targeting RTK genes have been investigated in preclinical or clinical situations for the treatment of WDLPS/DDLPS [29, 30]. In the preclinical studies, EGFR, FGFR, MET, AXL, KIT, and IGF1R were identified as overexpressed in WDLPS or DDLPS cells [31–33], and FGFR and MET inhibitors significantly inhibited the growth of DDLPS cell lines [31, 32]. By contrast, in clinical studies, drugs directed to RTKs, such as sorafenib (VEGFR and PDGFR inhibitor) and imatinib (ABL inhibitor), induced limited responses in phase II trials [34–36]. Pazopanib, an oral multi-targeted tyrosine kinase inhibitor with activity against VEGFR, PDGFR, and KIT, which has been approved as the first molecular targeting drug for advanced STS, also demonstrated an insufficient response in patients with LPS subtypes [10, 11]. However, in these studies, the genetic aberrations in each patient were not tested; therefore, the reported unsatisfactory results may be due to the use of drugs not matched to individual patients. Personalized therapy based on individual genomic alterations may increase response rates and lead to better clinical outcomes.
Our results, using a WDLPS cell line, 93T449, harboring co-amplification of MDM2/CDK4 and IGF1R, indicate that matched RTK inhibitor treatment could be effective. Although this cell line was only slightly sensitive to a CDK4/6 inhibitor and an IGF1R inhibitor, combination treatment with both of these inhibitors dramatically improved efficacy (Figure 4C). The improvements observed with combination therapy are most likely because of cooperative inhibition of the multiple cellular signaling events typically altered in cancer [37, 38]. Interestingly, Miller et al. also reported CDK4 and IGF1R as synergistic drug targets in DDLPS cells (DDLS8817 and LPS141), using a drug synergy screen and network modeling approach [39]. As they already pointed out, CDK4 and IGF1R inhibitors probably function through the inhibition of different survival pathways (RB and AKT/mTOR, respectively).
In conclusion, we found that RTK gene amplifications are potentially targetable genetic alterations in WDLPS/DDLPS, present in between one-third and almost half of patients. For the WDLPS/DDLPS patients with RTK gene alterations, combination therapy with CDK4 and personalized RTK inhibitors could be effective. However, not all RTK gene amplifications led to overexpression of their mRNAs (Figure 2B), and expression at the protein level was also limited (Supplementary Figure 2B). To translate our findings to the clinic, it will be necessary to improve understanding of RTK gene amplification by more comprehensive genomic analyses, and to examine the significance of this phenomenon in additional cell lines and patient-derived xenograft models.
MATERIALS AND METHODS
Patient samples
WDLPS (N = 19) and DDLPS (N = 37) frozen tumor tissue samples from the National Cancer Center Biobank (Tokyo, Japan) were used. These tumor tissues were obtained from patients who underwent surgery at the National Cancer Center Hospital (Tokyo, Japan) between 1998 and 2013. Tumor samples were collected by pathologists from regions with high macroscopic tumor content immediately after surgical excision, and cryopreserved in liquid nitrogen until use. One patient with DDLPS (DDLPS_35) received neoadjuvant chemotherapy before surgery. All others did not receive chemotherapy or radiotherapy before surgery. The diagnosis of all tumors was confirmed by critical re-examination of the clinical and histopathological findings. Follow-up periods ranged from 3 months to 14 years, with a median of 3.5 years. Clinical characteristics of all patients are summarized in Table 1. This study was approved by the institutional review board at the National Cancer Center.
Cell lines
Two human LPS cell lines, 93T449 (WDLPS) and SW872 (unclassified LPS), were used in this study. These cell lines were purchased from American Tissue Type Culture Collection (Rockville, MD, USA), and were maintained in RPMI-1640 medium supplemented with 10% fetal bovine serum (FBS) in a humidified incubator at 37°C with 5% CO2.
Genomic DNA, RNA, and protein extraction
Fresh-frozen tissues were crushed to powder using a Multi-beads Shocker (Yasui Kikai, Osaka, Japan) under cooling with liquid nitrogen. Genomic DNA samples were extracted from frozen tumor tissue powder and cell lines using the standard phenol-chloroform extraction method. Total RNA was extracted from frozen tumor tissue powder using ISOGEN reagent (Nippon Gene, Tokyo, Japan) according to the manufacturer’s protocol, and purified using an RNeasy MinElute Cleanup Kit (Qiagen, Hilden, Germany). The quality of total RNA was checked on a 2100 Bioanalyzer (Agilent Technologies, Santa Clara, CA, USA). Protein was extracted from cell lines using urea lysis buffer (6 M urea, 2 M thiourea, 3% CHAPS, and 1% Triton X-100). After centrifugation at 15,000 rpm for 30 min, the supernatant was used as the source of cellular proteins for western blotting analysis.
Targeted sequencing analysis
For targeted sequencing analysis, an original gene panel, NCC oncopanel v3, developed specifically for genomic testing for the selection of suitable molecular therapy targets, was used. This panel was designed using SureDesign (Agilent Technologies, Santa Clara, CA, USA) to capture all coding exons of 104 genes and reported translocated introns of 16 genes (Supplementary Table 1). These genes were selected from the genes that were known to be somatically affected in solid tumors as of January 2014. Sequencing libraries were prepared using SureSelect XT reagent (Agilent Technologies). Paired-end sequencing (2 × 150 bp) was performed on MiSeq and HiSeq2500 sequencers (Illumina, San Diego, CA, USA).
To detect mutations (single nucleotide variations and short insertions and deletions), gene amplifications, and gene fusions from the sequencing read data, we used an in-house program cisCall (Kato M et al., manuscript in preparation). All detected alterations were checked by manual inspection. For SNP elimination, we used 1000 Genomes (http://www.1000genomes.org), ESP6500 (http://evs.gs.washington.edu/EVS/), Human Genetic Variation Database (http://www.hgvd.genome.med.kyoto-u.ac.jp/), and in-house Japanese germline SNP data. For annotation of identified mutations, we used ANNOVAR [40] and COSMIC [23] databases. COSMIC database-registered mutations in oncogenes, and COSMIC database-registered mutations and truncating mutations in tumor suppressor genes, were considered functionally important mutations (potential driver mutations). Increases in read depth > 2-fold were judged as gene amplification.
Quantitative genomic PCR analysis
Quantitative PCR analysis was carried out using TaqMan Gene Expression Master Mix and TaqMan Copy Number Assays on a 7900HT Fast Real Time PCR System (Thermo Fisher Scientific, Waltham, MA, USA). TaqMan Copy Number Assays used for DDR2, ERBB3, NTRK1, FGFR3, ROS1, and IGF1R were Hs01066084_cn, Hs02182510_cn, Hs00946894_cn, Hs00136087_cn, Hs02890670_cn, and Hs02543373_cn (Thermo Fisher Scientific), respectively. The TaqMan Copy Number Reference Assay, human RNase P (Thermo Fisher Scientific), was used as a control. Genomic DNA (10 ng) was used as template for each PCR amplification.
Quantitative RT-PCR analysis
Quantitative RT-PCR analysis was carried out using SYBR Premix Ex Taq II (Takara Bio, Kusatsu, Japan) on a 7900HT Fast Real Time PCR System. In addition to DDR2, ERBB3, NTRK1, FGFR3, ROS1, and IGF1R, GAPDH was evaluated as a control gene. PCR primers were designed using the Takara Perfect Real Time Support System (http://www.takara-bio.co.jp/prt/intro.htm) (Supplementary Table 5). cDNA was prepared from 100–500 ng of total RNA using Superscript III Reverse Transcriptase (Thermo Fisher Scientific), and a 1/100 amount of cDNA (corresponding to 1–5 ng of total RNA) was subjected to PCR amplification. The expression level of each gene was evaluated after normalization relative to GAPDH expression.
Fluorescence in situ hybridization analysis
To validate amplification of the DDR2, ERBB3, NTRK1, FGFR3, and ROS1 genes, fluorescence in situ hybridization (FISH) was performed on formalin-fixed, paraffin-embedded tumor samples. For DDLPS, samples containing WD and DD areas were selected. The probes used were DDR2 (Texas Red)/CEN1p(FITC) FISH Probe (GSP Laboratory, Kobe, Japan) for DDR2, ZytoLight SPEC ERBB3/CEN12 Dual Color Probe (ZytoVision GmbH, Bremerhaven, Germany) for ERBB3, NTRK1(Texas Red)/CEN1p(FITC) FISH Probe (GSP Laboratory) for NTRK1, ZytoLight SPEC FGFR3/4p11 Dual Color Probe (ZytoVision) for FGFR3, and ZytoLight SPEC ROS1/CEN6 Dual Color Probe (ZytoVision) for ROS1.
Immunohistochemistry analysis
Sections were exposed to 3% hydrogen peroxide for 15 min to block endogenous peroxidase activity and then washed with deionized water for 2−3 min. Heat-induced antigen retrieval was performed. The primary antibodies used were D22C5 (1:100, Cell Signaling Technology, Danvers, MA, USA) for ERBB3, EP1058Y (1:400, Abcam, Cambridge, UK) for NTRK1, B-9 (1:500, Santa Cruz Biotechnology, Santa Cruz, CA, USA) for FGFR3, and D4D6 (1:100, Cell Signaling Technology) for ROS1. Slides were incubated for 1 h at room temperature with the primary antibody and subsequently labeled using the EnVision system (Dako, Glostrup, Denmark). Diaminobenzidine was used as the chromogen, and hematoxylin as the counterstain.
Western blotting analysis
Aliquots of protein samples (10 μg) were separated by SDS-PAGE. The separated proteins were subsequently blotted on to nitrocellulose membrane and incubated with primary antibodies against IGF1R (1:200, 7G11, Santa Cruz Biotechnology), Phospho-IGF-I Receptor β (Tyr1135) (1:1000, DA7A8, Cell Signaling Technology), and β-actin (1:5000, AC-15, Abcam, Cambridge, UK). The membrane was then treated with horseradish peroxidase-conjugated secondary anti-mouse antibody or anti-rabbit antibody (1:5000, Jackson ImmunoResearch Laboratories, Baltimore, PA, USA), processed using enhanced chemiluminescence reagents (Plus-ECL, PerkinElmer, Waltham, MA, USA), and scanned with a LAS-3000 laser scanner (FujiFilm, Tokyo, Japan).
Cell viability assay
Next, the effects of the CDK4/6 inhibitor, Palbociclib (Selleckchem, Houston, TX, USA), and the IGF1R inhibitor, NVP-AEW541 (Selleckchem), on LPS cells were examined. The CCK-8 assay, which is widely used as a measure of cell metabolic activity, was performed according to the manufacturer’s protocol (Dojindo Molecular Technologies, Kumamoto, Japan), after treatment with inhibitors. 93T449 and SW872 cells (1 × 10⁴) were plated in 100 μl of medium on 96-well plates and grown for 24 h. Cells were then treated with several different concentrations of single and combined drugs in triplicate by adding 100 μl of drug solution in medium. After 6 days of drug treatment, 10 μl of CCK-8 solution was added to each well and further incubated at 37°C for 3 h. Cell viability was determined by measuring the absorbance at 450 nm using a microplate reader (Tecan, Maännedorf, Switzerland).
Statistical analyses
Statistical analyses were performed using the PASW Statistics 18 package (SPSS, Chicago, IL, USA). The significances of differences between two groups were evaluated with Student t and χ2 tests. Disease-free survival curves were plotted according to the Kaplan–Meier method, with the log-rank test applied for comparison. All differences at the level of P < 0.05 were considered statistically significant.
ACKNOWLEDGMENTS
We thank Masayuki Komatsu for helpful suggestions and Shizuka Shinohara, Erika Arakawa, and Fusako Kito for technical assistance.
CONFLICTS OF INTEREST
The authors have no conflicts of interest to declare.
GRANT SUPPORT
This work was supported by Grants-in-Aid from the Japan Agency for Medical Research and Development (AMED) for Practical Research for Innovative Cancer Control. The National Cancer Center Biobank was supported by National Cancer Center Research and Development Funds (23-A-1 and 26-A-1).
REFERENCES
1. Fletcher CDM BJ, Hogendoorn PCW, et al. (eds). WHO classification of tumours of soft tissue and bone. IARC Press: Lyon. 2013.
2. Goldblum JR FA, Weiss SW. Enzinger & Weiss's Soft Tissue Tumors 6th edition, Elsevier: Philadelphia. 2014.
3. Coindre JM, Pedeutour F, Aurias A. Well-differentiated and dedifferentiated liposarcomas. Virchows Arch. 2010; 456:167–179.
4. Dalal KM, Antonescu CR, Singer S. Diagnosis and management of lipomatous tumors. J Surg Oncol. 2008; 97:298–313.
5. Binh MB, Sastre-Garau X, Guillou L, de Pinieux G, Terrier P, Lagace R, Aurias A, Hostein I, Coindre JM. MDM2 and CDK4 immunostainings are useful adjuncts in diagnosing well-differentiated and dedifferentiated liposarcoma subtypes: a comparative analysis of 559 soft tissue neoplasms with genetic data. Am J Surg Pathol. 2005; 29:1340–1347.
6. Sirvent N, Coindre JM, Maire G, Hostein I, Keslair F, Guillou L, Ranchere-Vince D, Terrier P, Pedeutour F. Detection of MDM2-CDK4 amplification by fluorescence in situ hybridization in 200 paraffin-embedded tumor samples: utility in diagnosing adipocytic lesions and comparison with immunohistochemistry and real-time PCR. Am J Surg Pathol. 2007; 31:1476–1489.
7. Mariani O, Brennetot C, Coindre JM, Gruel N, Ganem C, Delattre O, Stern MH, Aurias A. JUN oncogene amplification and overexpression block adipocytic differentiation in highly aggressive sarcomas. Cancer Cell. 2007; 11:361–374.
8. Snyder EL, Sandstrom DJ, Law K, Fiore C, Sicinska E, Brito J, Bailey D, Fletcher JA, Loda M, Rodig SJ, Dal Cin P, Fletcher CD. c-Jun amplification and overexpression are oncogenic in liposarcoma but not always sufficient to inhibit the adipocytic differentiation programme. J Pathol. 2009; 218:292–300.
9. van der Graaf WT, Blay JY, Chawla SP, Kim DW, Bui-Nguyen B, Casali PG, Schoffski P, Aglietta M, Staddon AP, Beppu Y, Le Cesne A, Gelderblom H, Judson IR, et al. Pazopanib for metastatic soft-tissue sarcoma (PALETTE): a randomised, double-blind, placebo-controlled phase 3 trial. Lancet. 2012; 379:1879–1886.
10. Sleijfer S, Ray-Coquard I, Papai Z, Le Cesne A, Scurr M, Schoffski P, Collin F, Pandite L, Marreaud S, De Brauwer A, van Glabbeke M, Verweij J, Blay JY. Pazopanib, a multikinase angiogenesis inhibitor, in patients with relapsed or refractory advanced soft tissue sarcoma: a phase II study from the European organisation for research and treatment of cancer-soft tissue and bone sarcoma group (EORTC study 62043). J Clin Oncol. 2009; 27:3126–3132.
11. Nakamura T, Matsumine A, Kawai A, Araki N, Goto T, Yonemoto T, Sugiura H, Nishida Y, Hiraga H, Honoki K, Yasuda T, Boku S, Sudo A, et al. The clinical outcome of pazopanib treatment in Japanese patients with relapsed soft tissue sarcoma: A Japanese Musculoskeletal Oncology Group (JMOG) study. Cancer. 2016; 122:1408–1416.
12. Ray-Coquard I, Blay JY, Italiano A, Le Cesne A, Penel N, Zhi J, Heil F, Rueger R, Graves B, Ding M, Geho D, Middleton SA, Vassilev LT, et al. Effect of the MDM2 antagonist RG7112 on the P53 pathway in patients with MDM2-amplified, well-differentiated or dedifferentiated liposarcoma: an exploratory proof-of-mechanism study. The Lancet Oncol. 2012; 13:1133–1140.
13. Luke JJ, D'Adamo DR, Dickson MA, Keohan ML, Carvajal RD, Maki RG, de Stanchina E, Musi E, Singer S, Schwartz GK. The cyclin-dependent kinase inhibitor flavopiridol potentiates doxorubicin efficacy in advanced sarcomas: preclinical investigations and results of a phase I dose-escalation clinical trial. Clin Cancer Res. 2012; 18:2638–2647.
14. Dickson MA, Tap WD, Keohan ML, D'Angelo SP, Gounder MM, Antonescu CR, Landa J, Qin LX, Rathbone DD, Condy MM, Ustoyev Y, Crago AM, Singer S, et al. Phase II trial of the CDK4 inhibitor PD0332991 in patients with advanced CDK4-amplified well-differentiated or dedifferentiated liposarcoma. J Clin Oncol. 2013; 31:2024–2028.
15. Schwartz GK, LoRusso PM, Dickson MA, Randolph SS, Shaik MN, Wilner KD, Courtney R, O'Dwyer PJ. Phase I study of PD 0332991, a cyclin-dependent kinase inhibitor, administered in 3-week cycles (Schedule 2/1). Br J Cancer. 2011; 104:1862–1868.
16. Dickson MA, Schwartz GK, Keohan ML, D'Angelo SP, Gounder MM, Chi P, Antonescu CR, Landa J, Qin LX, Crago AM, Singer S, Koff A, Tap WD. Progression-Free Survival Among Patients With Well-Differentiated or Dedifferentiated Liposarcoma Treated With CDK4 Inhibitor Palbociclib: A Phase 2 Clinical Trial. JAMA Oncol. 2016.
17. McDermott U, Downing JR, Stratton MR. Genomics and the continuum of cancer care. N Engl J Med. 2011; 364:340–350.
18. Chin L, Andersen JN, Futreal PA. Cancer genomics: from discovery science to personalized medicine. Nat Med. 2011; 17:297–303.
19. Macconaill LE, Garraway LA. Clinical implications of the cancer genome. J Clin Oncol. 2010; 28:5219–5228.
20. Wagle N, Berger MF, Davis MJ, Blumenstiel B, Defelice M, Pochanard P, Ducar M, Van Hummelen P, Macconaill LE, Hahn WC, Meyerson M, Gabriel SB, Garraway LA. High-throughput detection of actionable genomic alterations in clinical tumor samples by targeted, massively parallel sequencing. Cancer Discov. 2012; 2:82–93.
21. Barretina J, Taylor BS, Banerji S, Ramos AH, Lagos-Quintana M, Decarolis PL, Shah K, Socci ND, Weir BA, Ho A, Chiang DY, Reva B, Mermel CH, et al. Subtype-specific genomic alterations define new targets for soft-tissue sarcoma therapy. Nat Genet. 2010; 42:715–721.
22. Kanojia D, Nagata Y, Garg M, Lee DH, Sato A, Yoshida K, Sato Y, Sanada M, Mayakonda A, Bartenhagen C, Klein HU, Doan NB, Said JW, et al. Genomic landscape of liposarcoma. Oncotarget. 2015; 6:42429–44. doi: 10.18632/oncotarget.6464.
23. Bamford S, Dawson E, Forbes S, Clements J, Pettett R, Dogan A, Flanagan A, Teague J, Futreal PA, Stratton MR, Wooster R. The COSMIC (Catalogue of Somatic Mutations in Cancer) database and website. Br J Cancer. 2004; 91:355–358.
24. Sobin L GM, Wittekind C. UICC TNM classification of malignant tumours, 7th edition, Wiley-Liss: New York. 2010.
25. Egan JB, Barrett MT, Champion MD, Middha S, Lenkiewicz E, Evers L, Francis P, Schmidt J, Shi CX, Van Wier S, Badar S, Ahmann G, Kortuem KM, et al. Whole genome analyses of a well-differentiated liposarcoma reveals novel SYT1 and DDR2 rearrangements. PloS One. 2014; 9:e87113.
26. Cerami E, Gao J, Dogrusoz U, Gross BE, Sumer SO, Aksoy BA, Jacobsen A, Byrne CJ, Heuer ML, Larsson E, Antipin Y, Reva B, Goldberg AP, et al. The cBio cancer genomics portal: an open platform for exploring multidimensional cancer genomics data. Cancer Discov. 2012; 2:401–404.
27. Gao J, Aksoy BA, Dogrusoz U, Dresdner G, Gross B, Sumer SO, Sun Y, Jacobsen A, Sinha R, Larsson E, Cerami E, Sander C, Schultz N. Integrative analysis of complex cancer genomics and clinical profiles using the cBioPortal. Sci Signal. 2013; 6:pl1.
28. Gerlinger M, Rowan AJ, Horswell S, Larkin J, Endesfelder D, Gronroos E, Martinez P, Matthews N, Stewart A, Tarpey P, Varela I, Phillimore B, Begum S, et al. Intratumor heterogeneity and branched evolution revealed by multiregion sequencing. N Engl J Med. 2012; 366:883–892.
29. Crago AM, Singer S. Clinical and molecular approaches to well differentiated and dedifferentiated liposarcoma. Curr Opin Oncol. 2011; 23:373–378.
30. Tseng WW, Somaiah N, Lazar AJ, Lev DC, Pollock RE. Novel systemic therapies in advanced liposarcoma: a review of recent clinical trial results. Cancers (Basel). 2013; 5:529–549.
31. Peng T, Zhang P, Liu J, Nguyen T, Bolshakov S, Belousov R, Young ED, Wang X, Brewer K, Lopez-Terrada DH, Oliveira AM, Lazar AJ, Lev D. An experimental model for the study of well-differentiated and dedifferentiated liposarcoma; deregulation of targetable tyrosine kinase receptors. Lab Invest. 2011; 91:392–403.
32. Zhang K, Chu K, Wu X, Gao H, Wang J, Yuan YC, Loera S, Ho K, Wang Y, Chow W, Un F, Chu P, Yen Y. Amplification of FRS2 and activation of FGFR/FRS2 signaling pathway in high-grade liposarcoma. Cancer Res. 2013; 73:1298–1307.
33. Bill KL, Garnett J, Ma X, May CD, Bolshakov S, Lazar AJ. The hepatocyte growth factor receptor as a potential therapeutic target for dedifferentiated liposarcoma. Lab Invest. 2015; 95:951–961.
34. Maki RG, D'Adamo DR, Keohan ML, Saulle M, Schuetze SM, Undevia SD, Livingston MB, Cooney MM, Hensley ML, Mita MM, Takimoto CH, Kraft AS, Elias AD, et al. Phase II study of sorafenib in patients with metastatic or recurrent sarcomas. J Clin Oncol. 2009; 27:3133–3140.
35. von Mehren M, Rankin C, Goldblum JR, Demetri GD, Bramwell V, Ryan CW, Borden E. Phase 2 Southwest Oncology Group-directed intergroup trial (S0505) of sorafenib in advanced soft tissue sarcomas. Cancer. 2012; 118:770–776.
36. Chugh R, Wathen JK, Maki RG, Benjamin RS, Patel SR, Meyers PA, Priebat DA, Reinke DK, Thomas DG, Keohan ML, Samuels BL, Baker LH. Phase II multicenter trial of imatinib in 10 histologic subtypes of sarcoma using a bayesian hierarchical statistical model. J Clin Oncol. 2009; 27: 3148–3153.
37. Glickman MS, Sawyers CL. Converting cancer therapies into cures: lessons from infectious diseases. Cell. 2012; 148:1089–1098.
38. Al-Lazikani B, Banerji U, Workman P. Combinatorial drug therapy for cancer in the post-genomic era. Nat Biotechnol. 2012; 30:679–692.
39. Miller ML, Molinelli EJ, Nair JS, Sheikh T, Samy R, Jing X, He Q, Korkut A, Crago AM, Singer S, Schwartz GK, Sander C. Drug synergy screen and network modeling in dedifferentiated liposarcoma identifies CDK4 and IGF1R as synergistic drug targets. Sci Signal. 2013; 6:ra85.
40. Wang K, Li M, Hakonarson H. ANNOVAR: functional annotation of genetic variants from high-throughput sequencing data. Nucleic Acids Res. 2010; 38:e164.
41. Chou TC. Theoretical basis, experimental design, and computerized simulation of synergism and antagonism in drug combination studies. Pharmacol Rev. 2006; 58:621–681.